KOSPI Drops 10% as Crowded AI Trade Unwinds Across Global Markets
6 hrs ago

A 23.2% annualised yield from a company that has paid consecutive distributions for 23 years sounds like precisely the kind of income story long-term dividend investors seek. But when that distribution costs Oxford Square Capital Corp (OXSQ) roughly $2.10 for every $1.00 it earns in net investment income (NII), the arithmetic demands closer examination. OXSQ released its Q1 2026 results on 29 April 2026, revealing a 21.9% sequential collapse in net asset value (NAV) per share, a further step-down in quarterly earnings, and $30.7 million in realised losses during the quarter. The board simultaneously declared the unchanged $0.035 monthly dividend through September 2026. This analysis works through each layer of the Oxford Square Capital dividend sustainability question: what the earnings trajectory reveals, what the NAV trend signals, how the broader credit environment amplifies the risks, and what a rational framework for evaluating this distribution looks like in mid-2026.
The monthly dividend of $0.035 per share annualises to $0.42. Against a share price range of $1.84-$1.89 in late April 2026, that produces a headline yield commonly cited at 23.2%. Three figures anchor the reality beneath that number:
Dividend Risk Score: F Sure Dividend assigns OXSQ its lowest possible dividend risk grade, reflecting the structural disconnect between the payout level and the company’s income generation capacity.
Following the 29 April earnings release, shares fell nearly 4% to approximately $1.81 in early trading. The 23-year consecutive payout streak is a historical data point, not a sustainability indicator. Investors buying at current levels are paying a premium for an asset base that shrank by more than a fifth in a single quarter.
The quarterly NII trajectory is the sustainability indicator that matters most. Over the past four reported quarters, NII per share has followed a single direction:
| Quarter | NII per share | Quarterly dividend | Implied payout ratio |
|---|---|---|---|
| Q2 2025 | $0.09 | $0.105 | ~117% |
| Q3 2025 | $0.08 | $0.105 | ~131% |
| Q4 2025 | $0.07 | $0.105 | ~150% |
| Q1 2026 | $0.05 | $0.105 | ~210% |
NII per share has declined approximately 44% across those four quarters. At the Q1 2026 run rate, the annualised NII figure sits near $0.20 per share, less than half the $0.42 annualised dividend obligation.
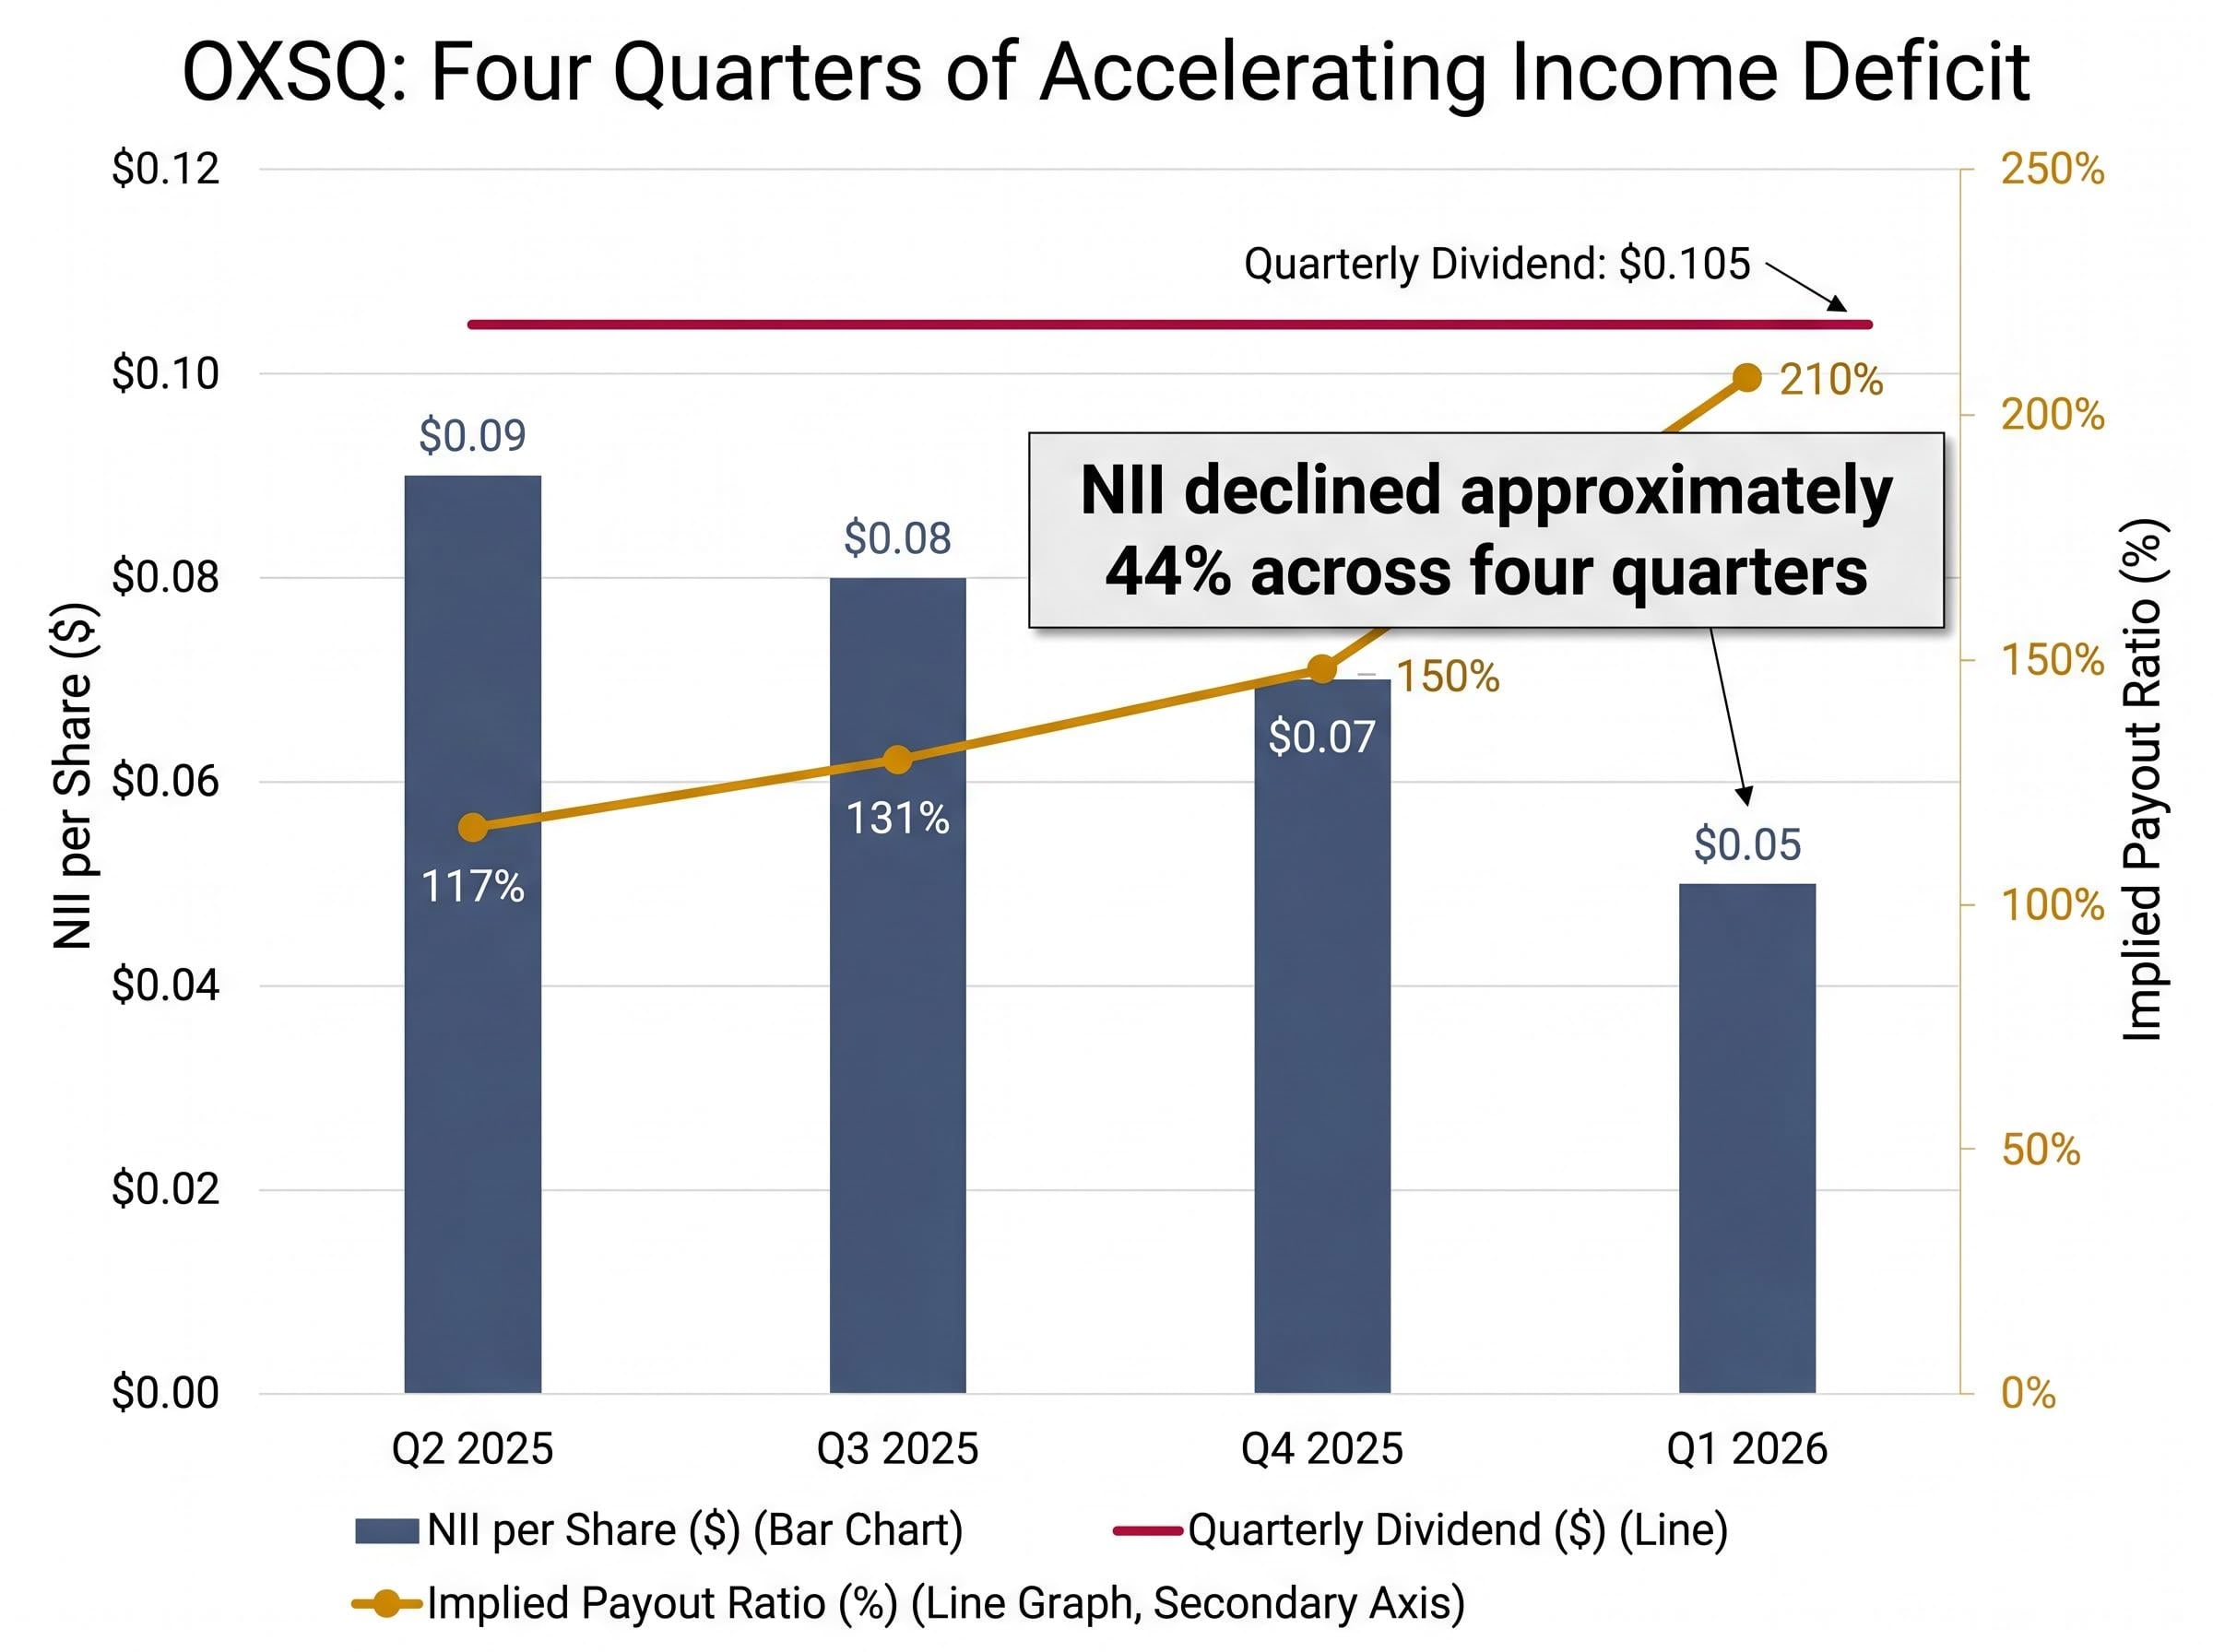
Payout ratio against NII: approximately 210% OXSQ is distributing more than twice what it earns from its portfolio on a net investment income basis.
Quarterly investment income fell to $8.9 million in Q1 2026, down from $10.4 million in Q4 2025. The Q1 2026 earnings-per-share figure of $0.05 missed analyst consensus of $0.07 by roughly 29%. Even the full-year consensus EPS estimate of $0.26 implies a payout ratio of approximately 161%, well above the threshold where income covers the distribution. This is not a single weak quarter. It is four consecutive quarters of accelerating deterioration.
Business development companies (BDCs) are investment vehicles that lend to small and mid-sized businesses. They generate income primarily from interest on those loans. To evaluate whether a BDC’s distribution is sustainable, investors apply a framework built on two connected tests: NII coverage and NAV trajectory.
The SEC investor guidance on BDCs confirms that companies electing regulated investment company tax status must distribute at least 90% of their taxable income annually, a structural requirement that limits management’s ability to retain earnings as a buffer when income declines.
BDCs that elect regulated investment company (RIC) tax status are required to distribute at least 90% of their taxable income to shareholders. This election allows the company to avoid corporate-level taxation on distributed earnings. The trade-off is that management has limited ability to retain earnings as a buffer when income declines. OXSQ currently distributes at roughly 210% of NII, far above the 90% legal minimum, which means the excess is funded from the balance sheet rather than from current earnings.
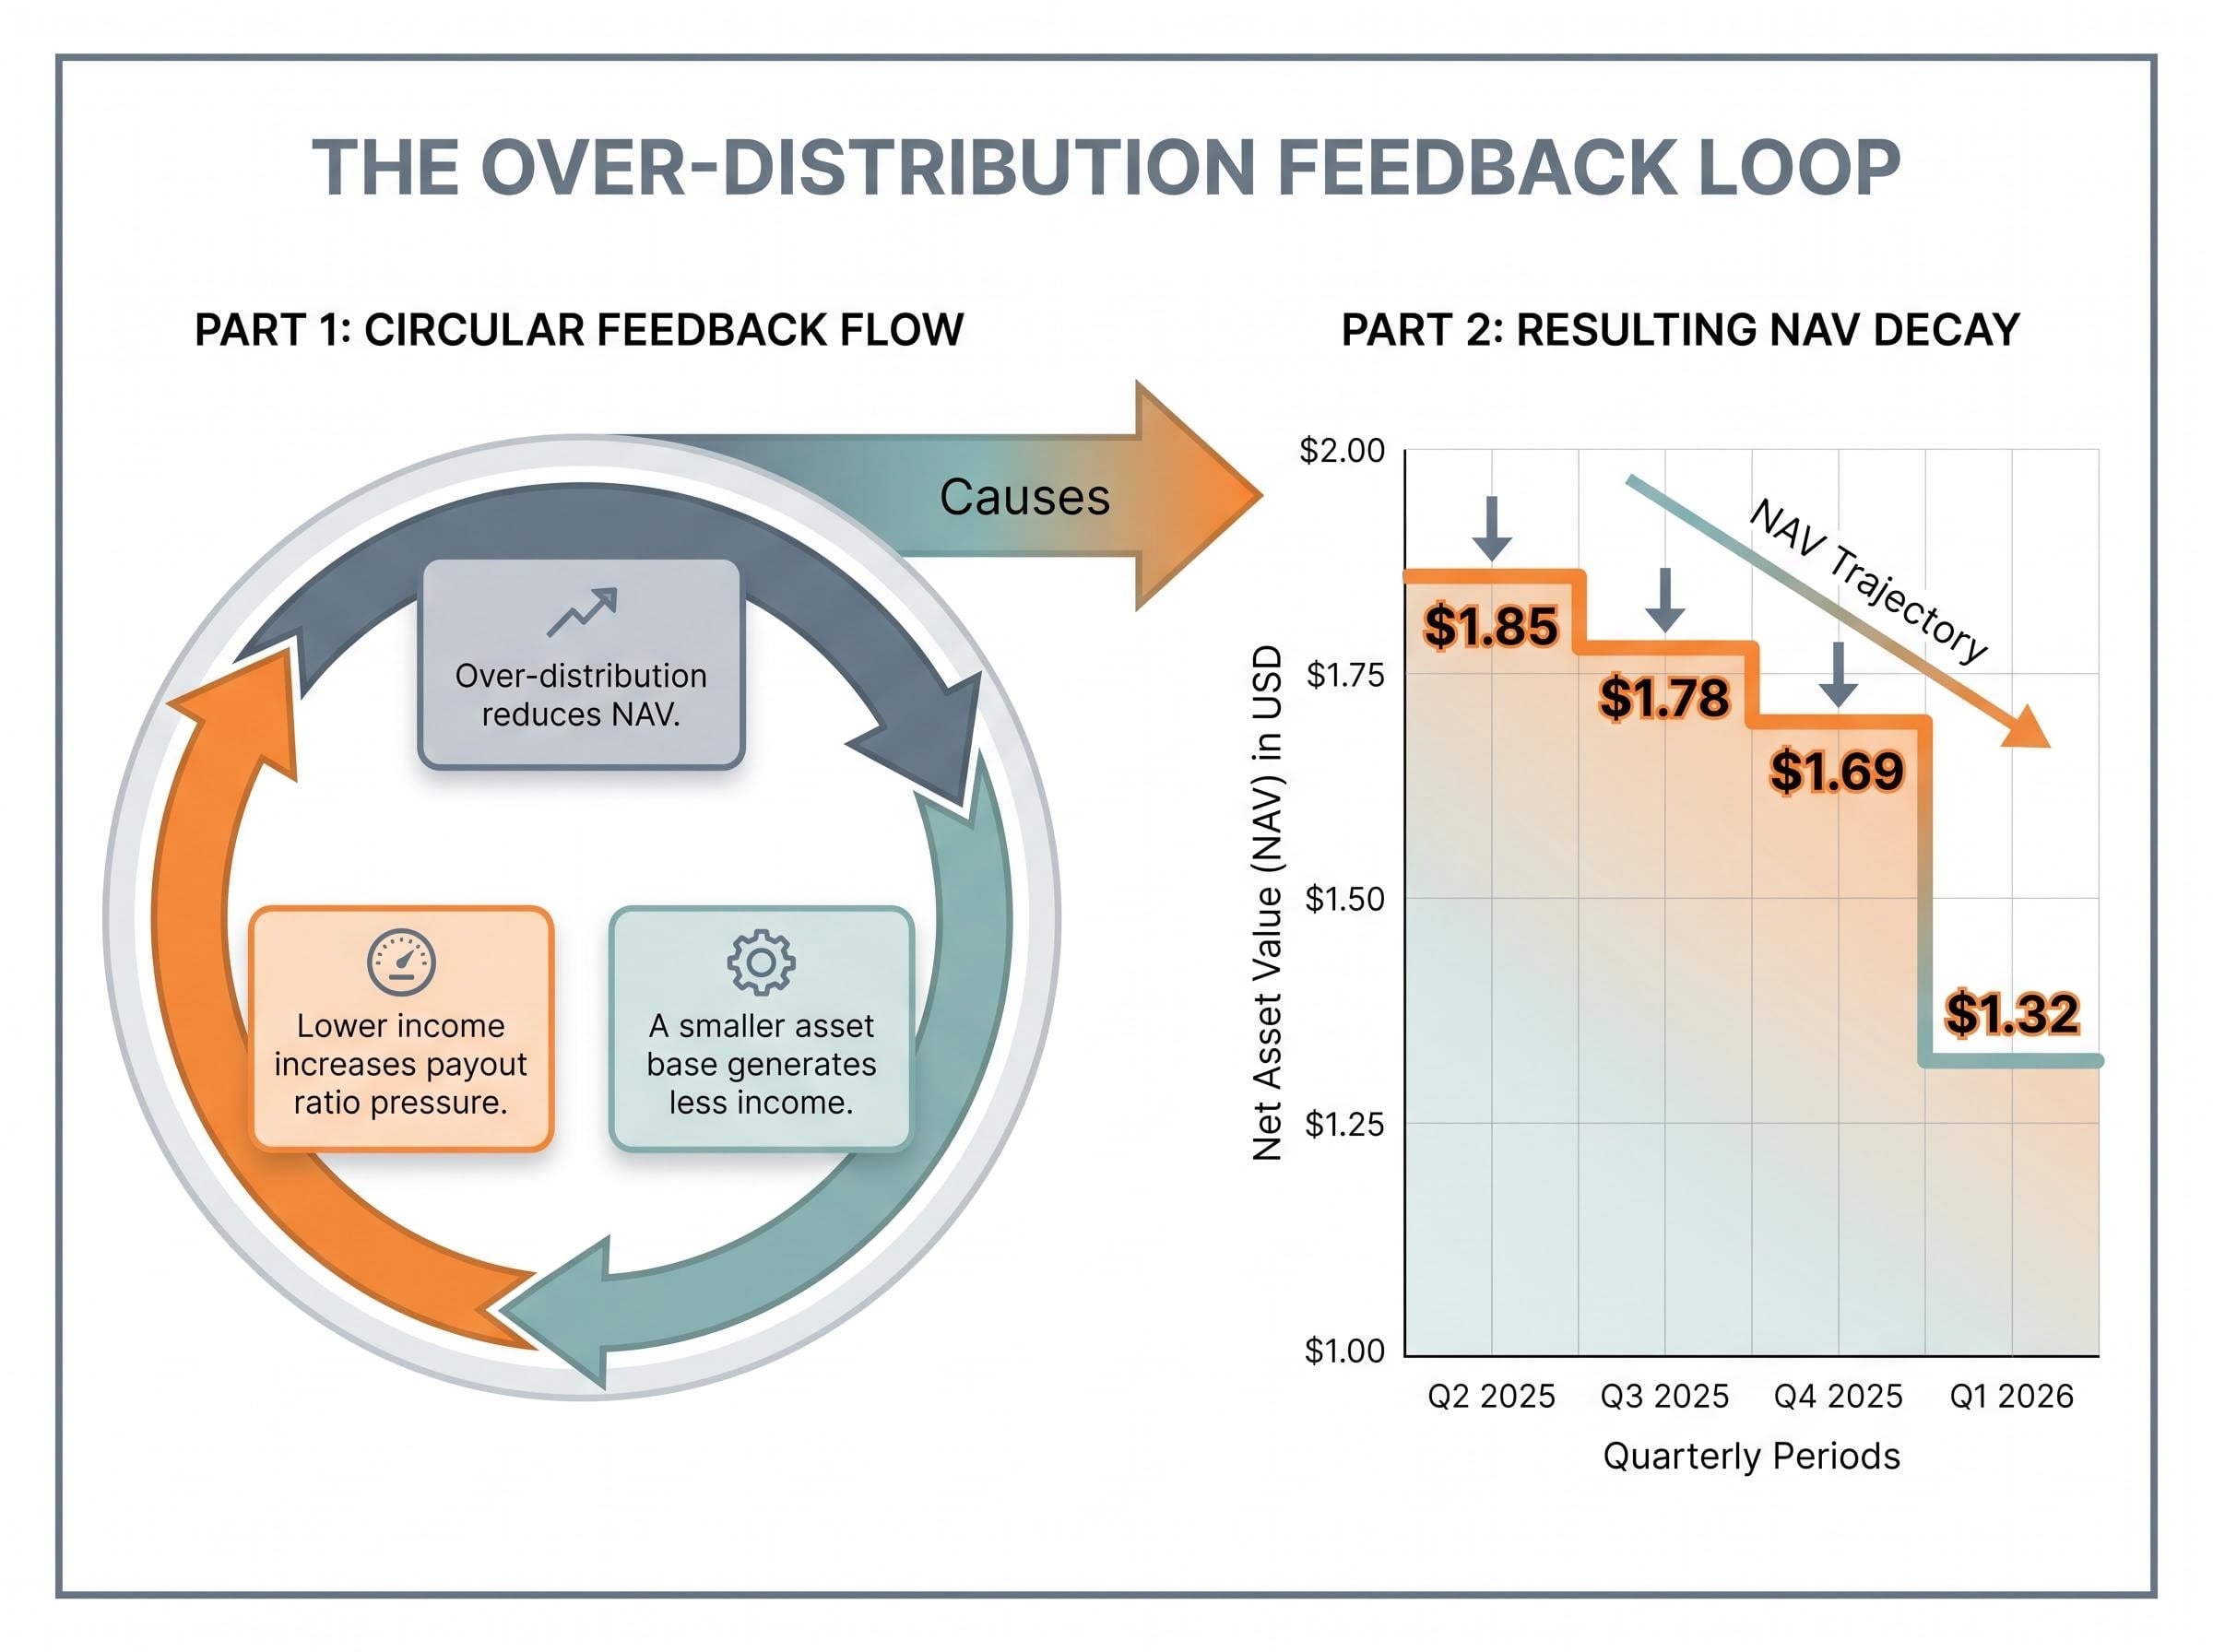
That excess distribution triggers a feedback loop:
OXSQ’s NAV trajectory illustrates this loop in practice: $1.85 in Q2 2025, $1.78 in Q3 2025, $1.69 in Q4 2025, and $1.32 in Q1 2026. The company also issued 7.2 million new shares via an at-the-market (ATM) offering in Q1 2026, raising approximately $12.3 million but diluting per-share metrics further. Smaller BDCs with payout ratios persistently above 100% of NII have historically exhibited accelerating NAV decay, and OXSQ’s trajectory aligns with that pattern.
OXSQ’s portfolio stress is not occurring in isolation. The US leveraged loan market deteriorated materially during Q1 2026, and OXSQ’s exposure to leveraged loans and collateralised loan obligation (CLO) debt tranches places it directly within that environment.
The leveraged loan market deterioration playing out in Q1 2026 is not uniform: high-rated institutional debt has held relatively stable while lower-rated CCC tranches have experienced severe distress, a K-shaped divide that makes headline index figures a poor guide to actual portfolio risk for BDCs concentrated in sub-investment-grade exposures.
| Credit indicator | Q4 2025 | Q1 2026 | Change |
|---|---|---|---|
| Morningstar LSTA index (% of par) | Not verified | Not verified | Not verified |
| Trailing 12-month default rate | 1.23% | 1.44% | Up 0.21 percentage points |
| Loans trading below 80% of face value | Not verified | Not verified | Not verified |
| New domestic credit origination | Q1 2025 baseline | $104.9B | Down 26% year-over-year |
Leading indicator: loans trading below 80 cents on the dollar nearly doubled in a single quarter, from 4.34% to 7.23%. This measure of distressed credit is the clearest forward signal for additional realised losses within portfolios like OXSQ’s.
Credit fund outflows reached approximately $5.1 billion during Q1 2026, while new domestic credit origination fell 26% year-over-year to $104.9 billion. Reduced origination constrains refinancing options for distressed borrowers, the same borrowers whose debt OXSQ holds.
OXSQ recorded $30.7 million in realised losses during Q1 2026, up from $18.3 million in Q4 2025. The company reported a modest $1.1 million in net unrealised appreciation during the quarter, but that figure does little to offset the scale of realised losses already crystallised on the balance sheet.
OXSQ made approximately $15.8 million in new portfolio acquisitions during Q1 2026, including positions in Constellation Inc. and Invisible Technologies Inc., two companies operating in the artificial intelligence and machine learning space. CEO Jonathan H. Cohen has stated his conviction that machine learning technologies will fundamentally disrupt global economic structures.
CEO Jonathan H. Cohen has expressed the view that machine learning technologies could fundamentally disrupt global economic structures, positioning OXSQ’s portfolio additions as a forward-looking strategic bet.
The strategic narrative deserves a fair hearing. Management is making a directional call on a sector that has attracted significant capital across public and private markets. The question is whether that call addresses the near-term income problem.
The net capital dynamics are stark: the company deployed $15.8 million into new positions during a quarter in which it realised $30.7 million in losses. Early-stage technology credit positions typically carry higher risk profiles and longer income ramp timelines, which means they are unlikely to contribute meaningfully to NII in the quarters when income coverage is most critical. Detailed financial profiles of Constellation Inc. and Invisible Technologies Inc. are not yet publicly verified; investors should consult OXSQ’s Q1 2026 10-Q portfolio schedules on SEC EDGAR for exact position details.
One aspect of OXSQ’s balance sheet that distinguishes it from many stressed BDC peers is OXSQ’s net cash position: where leveraged competitors carry significant debt loads relative to assets, OXSQ’s comparatively conservative leverage profile provides limited insulation against NAV erosion when realised losses are running at the current scale.
Five layers of evidence converge on a single conclusion: OXSQ’s headline yield does not represent its sustainable income generation capacity. NII has declined 44% over four quarters. NAV has fallen from $1.85 to $1.32 in the same period. The broader credit market is worsening, with distressed loan indicators nearly doubling. The medium-term annualised total return estimate of approximately 12.3%, per analyst projections, sits roughly half the current headline yield, implying that either the distribution or the share price (or both) will compress.
Investors who want a granular breakdown of the individual line items behind these results will find our full explainer on OXSQ’s Q1 2026 earnings miss, which quantifies the 62.3% expansion in aggregate realised and unrealised losses and details the pre-market share price reaction following the 29 April disclosure.
The investor decision framework distils into three conditions:
The 7.2 million shares issued via ATM at prices above NAV during Q1 2026 add a dilutive layer to the per-share NAV decline. Year-to-date share appreciation of 10.9% provides context; short-term momentum exists. But momentum and sustainability are different analytical questions.
Investors considering a position should consult OXSQ’s Q1 2026 10-Q filed on SEC EDGAR for the exact portfolio composition, including the breakdown of equity positions, CLO debt tranches, and first and second lien loans. The tax treatment of distributions, whether classified as ordinary income or return of capital, materially affects after-tax yield and is disclosed in the annual tax supplement available at ir.oxfordsquarecapital.com. Constellation Inc. and Invisible Technologies Inc. details are not publicly verified outside OXSQ’s own filings; investors should not rely on unverified third-party characterisations of these positions.
The headline yield and the payout streak are backward-looking signals. The NII trajectory and NAV erosion rate are forward-looking ones. OXSQ’s Q1 2026 results make the distinction concrete: a distribution that once reflected income earned now reflects a policy choice to return capital the company no longer generates as income.
Investors evaluating any high-yield BDC can apply the same two tests used throughout this analysis. Does NII cover the distribution? Is NAV stable, growing, or eroding? When the answers are 210% payout ratio and a 21.9% single-quarter NAV decline, the yield figure is describing risk, not income.
This article is for informational purposes only and should not be considered financial advice. Investors should conduct their own research and consult with financial professionals before making investment decisions. Past performance does not guarantee future results.
Investors considering OXSQ for income should review the Q1 2026 10-Q on SEC EDGAR and the company’s investor relations page at ir.oxfordsquarecapital.com for the most current portfolio composition and tax disclosure before making any position decision.
Based on Q1 2026 results, the Oxford Square Capital dividend appears highly unsustainable. The company is paying out approximately 210% of its net investment income, meaning it distributes roughly $2.10 for every $1.00 it earns, funding the excess by eroding its asset base.
A BDC payout ratio measures how much of a company's net investment income is paid out as dividends. A ratio above 100% means the company is distributing more than it earns from its portfolio, which forces it to return capital rather than income, gradually shrinking the asset base that generates future earnings.
Oxford Square Capital's NAV per share fell 21.9% in Q1 2026, dropping from $1.69 to $1.32. This continued a four-quarter decline from $1.85 in Q2 2025, driven by $30.7 million in realised losses and over-distribution beyond what net investment income supports.
In late April 2026, OXSQ shares traded between $1.84 and $1.89, representing a 39-43% premium to the reported Q1 2026 NAV of $1.32. Analysts cite this premium as a key risk factor, with Sure Dividend assigning the stock its lowest dividend risk grade and a fair value estimate of $1.50.
Investors can apply two core tests: first, check whether net investment income per share covers the quarterly dividend (a payout ratio consistently above 100% is a warning sign); second, track NAV per share over time, because persistent NAV erosion signals the company is returning capital rather than distributing genuine income.