KOSPI Drops 10% as Crowded AI Trade Unwinds Across Global Markets
8 hrs ago

The release of OXSQ earnings for the first quarter of 2026 has exposed a stark contrast between Oxford Square Capital Corp’s massive 23.6 percent annualised dividend yield and a rapidly deteriorating asset base. During the early hours of 29 April 2026, the company reported significant shortfalls against Wall Street projections, triggering an immediate pre-market stock drop.
While the investment firm maintains a two-decade streak of consecutive payouts, the underlying foundation funding these distributions is shrinking. The gap between what the portfolio generates and what it pays out has widened significantly this quarter.
For shareholders evaluating today’s sell-off, understanding the mechanics behind this net asset value erosion is highly important. The following analysis breaks down the specific quarterly misses, examines the mathematical reality of a double-digit yield trap, and contextualises management’s strategic pivot toward the artificial intelligence sector as a potential lifeline for the fund.
The first quarter delivered a clear divergence between historical payout expectations and current operational performance. Oxford Square Capital reported Net Investment Income of $0.05 per share, missing Wall Street estimates by $0.01.
The underlying official SEC 8-K filing details these precise operational shortfalls, confirming that the current portfolio structure struggles to generate sufficient cash flow to cover basic yield obligations.
Total revenue followed a similar downward trajectory, coming in at $8.9 million. This figure signalled structural distress across the broader portfolio.
The market absorbed these top-line and bottom-line misses quickly during early trading sessions. Shares experienced a pre-market drop of 5 percent, pushing the price down to $1.81 before the opening bell.
This quarter-over-quarter deterioration is most visible in the total value destruction of the underlying holdings. The firm recorded a net decrease in assets from operations of negative $25.5 million, illustrating how far the company’s performance has drifted from its previously stable baseline.
| Financial Metric | Q4 2025 | Q1 2026 |
|---|---|---|
| Net Investment Income (per share) | $0.07 | $0.05 |
| Total Revenue | Data Unavailable | $8.9 million |
| Net Asset Value (per share) | $1.69 | $1.32 |
For a Business Development Company, the Net Asset Value represents the actual worth of its underlying investments divided by the number of outstanding shares. When a company distributes cash faster than its portfolio generates returns, this foundational metric inevitably shrinks.
Oxford Square Capital saw its Net Asset Value per share plunge 21.9 percent, falling from $1.69 in Q4 2025 to just $1.32 in Q1 2026. This contraction occurred as combined investment losses surged.
The mathematical relationship between a shrinking asset base and a fixed dividend creates an artificially inflated yield percentage. Because the stock price drops in tandem with the deteriorating portfolio, the historical payout appears as a massive 23.2 percent annualised yield.
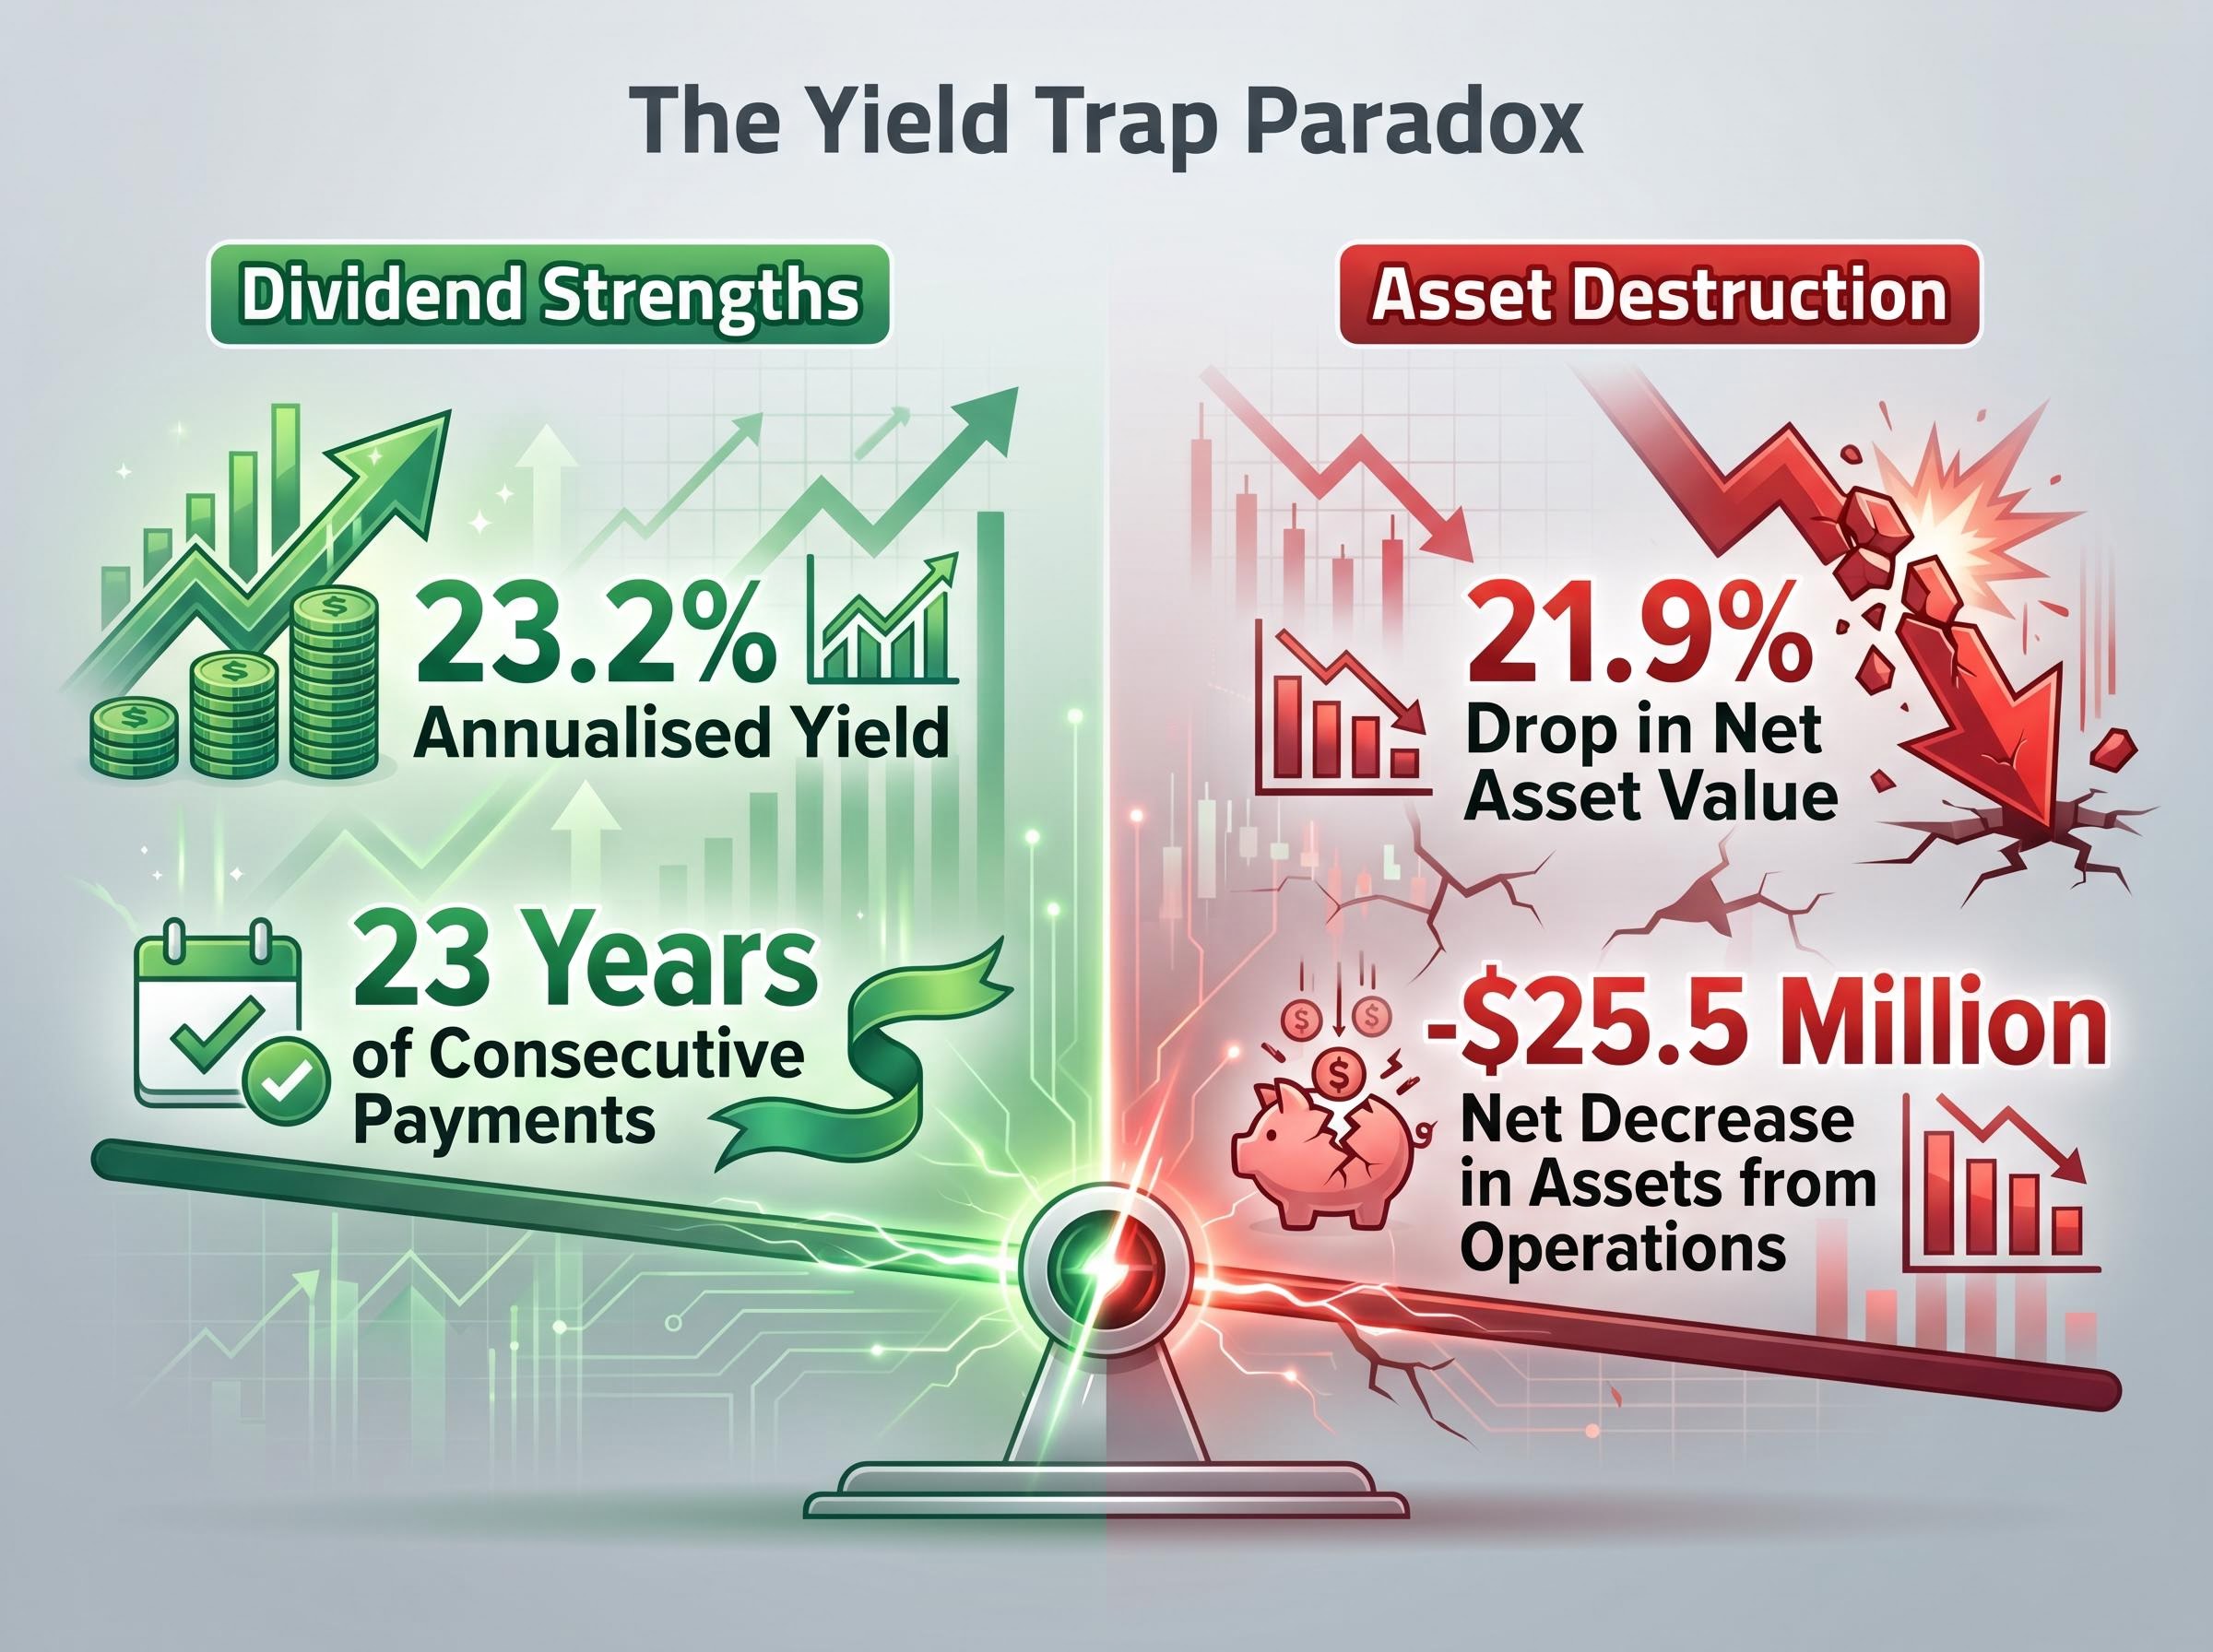
Despite these eroding fundamentals, the board has authorised regular monthly distributions of $0.035 per share for July through September 2026. This extends a historical streak of 23 years of consecutive payments, creating a paradox where steady cash flow masks severe capital destruction.
Analyst Commentary Financial analysts have expressed concern over deteriorating financials, characterising the quarter-over-quarter net asset value erosion as a clear warning sign. Industry commentary heavily emphasises the unsustainability of maintaining a long-term yield above 22 percent amid these expanding coverage issues.
This dynamic serves as a prime example of a yield trap, where the headline dividend percentage draws capital into a structurally distressed asset.
In response to legacy portfolio struggles, management is actively shifting capital away from troubled traditional loans. The firm is now targeting structured debt and equity within the high-growth artificial intelligence sector.
During the first quarter, the company deployed capital into new asset acquisitions. This pivot is designed to capture the upside of emerging technologies to offset the drag of older, underperforming debt structures.
While enterprise machine learning platforms offer significant scaling potential, investors must also weigh the software monetization challenges that are currently pressuring valuations across the broader technology infrastructure sector.
Chief Executive Officer Jonathan H. Cohen highlighted this transition during the earnings call, noting that machine learning advancements are fundamentally altering global economic structures. The strategy relies on identifying enterprise software and data automation platforms capable of rapid scaling.
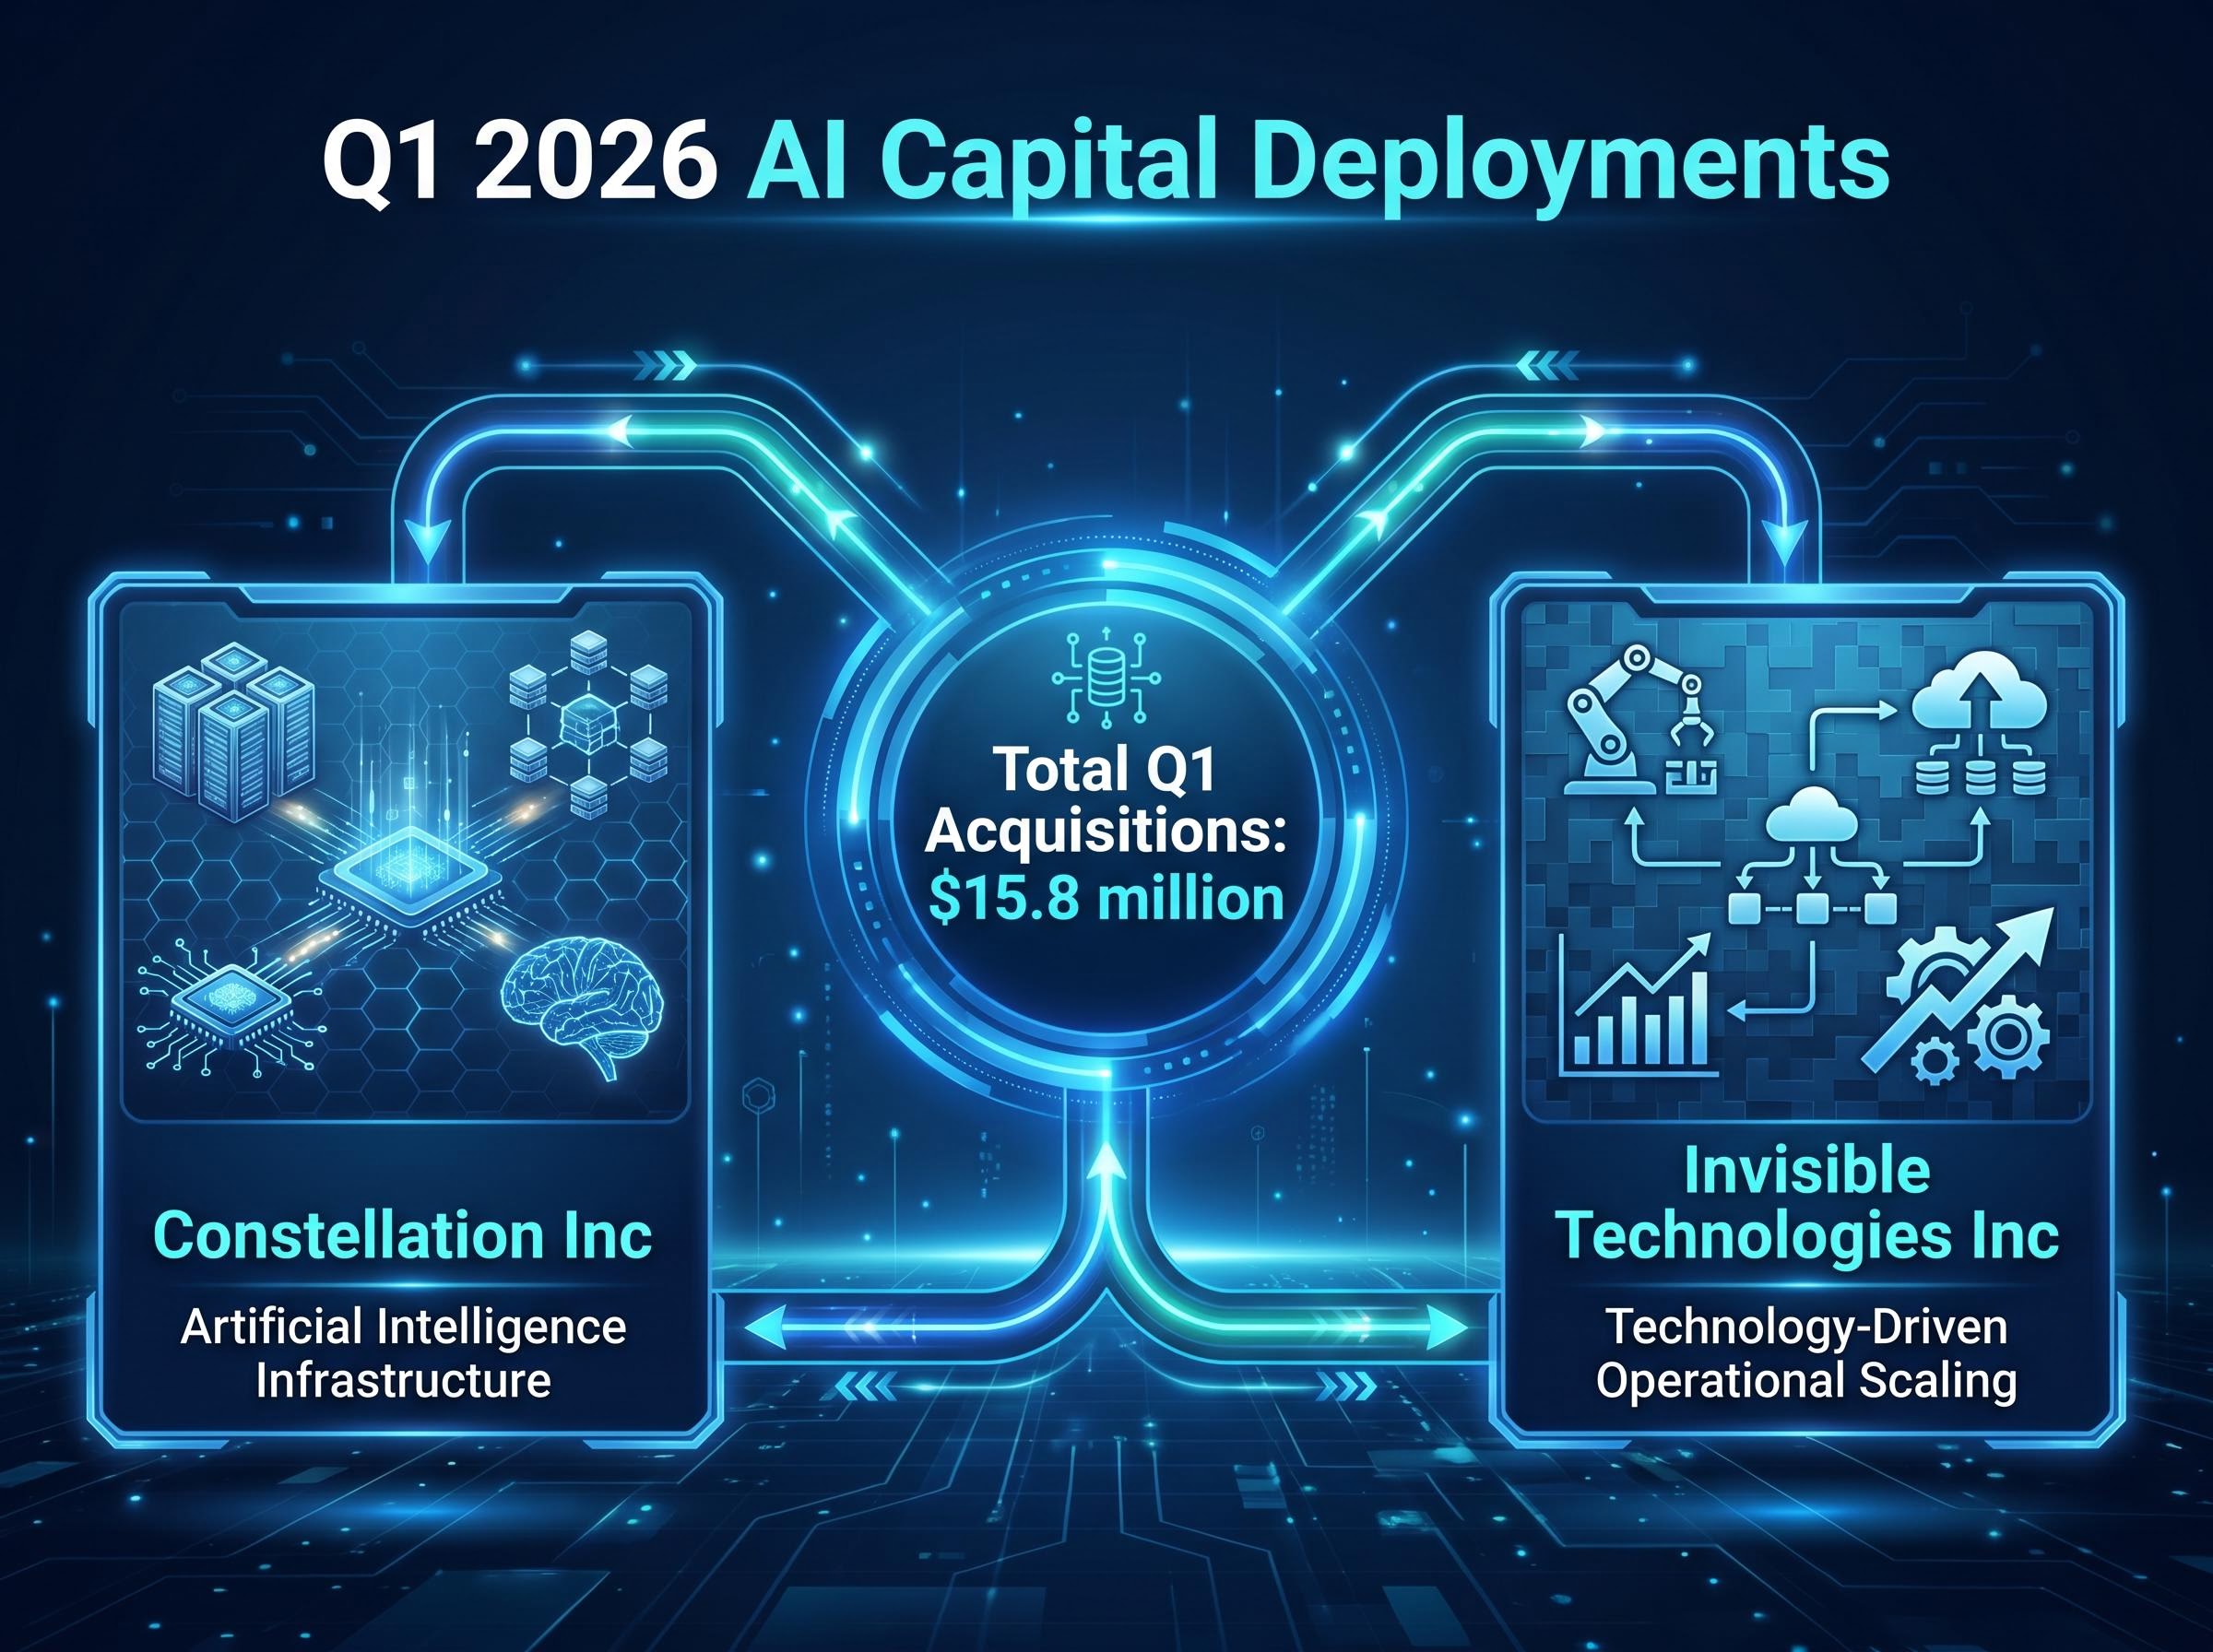
Recent capital deployments specifically target the following entities:
Constellation Inc: Funding round participation directed at artificial intelligence infrastructure. Invisible Technologies Inc: Capital allocation for technology-driven operational scaling. * Total Q1 Acquisitions: $15.8 million directed across new digital assets.
The company also reported receiving loan principal repayments during the period. Investors are currently awaiting official SEC 10-Q filings, which will provide deeper granular data on the specific valuations and terms of these new technology assets.
The specific portfolio losses at Oxford Square Capital are heavily intertwined with a broader deterioration in the United States corporate credit sector. Systemic risks are mounting across the national debt market, placing heavy pressure on legacy lending structures.
The US leveraged loan default rate rose to 1.44 percent in March 2026. Simultaneously, fresh loan originations plummeted, reflecting a sharp reduction in market liquidity and lender confidence.
The PitchBook LCD default tracker indicates that this surge represents a significant jump from previous years, reflecting severe structural distress within the broader corporate credit market.
Falling loan valuations are eroding the foundational value of domestic investment vehicles across multiple credit tiers. Valuations for B-rated debt have dropped, while higher-risk CCC-rated paper has tumbled.
Despite these macroeconomic headwinds, Oxford Square Capital maintains a highly defensive leverage position compared to its industry competitors. The company operates with a net debt to EBITDA ratio of negative 1.04x, indicating a net cash position.
This contrasts sharply with the peer average ratio of positive 1.29x. When evaluated alongside rivals like Hercules Capital and Gladstone Investment, the firm’s profile deviates significantly from standard industry averages. While its peers carry heavier debt loads, Oxford Square Capital trades at a similar premium to its underlying assets despite offering an extreme dividend yield that far exceeds the 8 to 10 percent average of the broader sector.
The central tension for shareholders lies between the reliable 23.2 percent dividend and the alarming 21.9 percent drop in underlying asset value. Maintaining such a high distribution rate while the foundational capital shrinks presents a clear mathematical challenge.
The long-term sustainability of this current payout structure will likely depend on the success of the new artificial intelligence investment pivot. If the newly acquired technology assets fail to generate outsized returns, the company may eventually be forced to recalibrate its distribution strategy.
Moving forward, market participants should closely monitor the upcoming SEC 10-Q filings for precise valuations of the AI holdings. Additionally, tracking future default rate reports within the US leveraged loan market will provide important context on whether the macroeconomic environment is stabilising or deteriorating further.
This credit market context is particularly crucial given that major financial institutions have recently elevated their recession probability forecasts to 35 percent, a macroeconomic shift that historically precedes significant equity drawdowns.
This article is for informational purposes only and should not be considered financial advice. Investors should conduct their own research and consult with financial professionals before making investment decisions.
Past performance does not guarantee future results. Financial projections and statements regarding strategic pivots are speculative and subject to change based on market developments and company performance.
—
A dividend yield trap occurs when a company's high dividend percentage masks deteriorating underlying fundamentals, such as a shrinking asset base, making the payout unsustainable in the long term.
Oxford Square Capital Corp reported Net Investment Income of $0.05 per share, missing Wall Street estimates by $0.01, and saw its Net Asset Value per share plunge 21.9 percent to $1.32.
Management is strategically pivoting its investment portfolio towards structured debt and equity within the high-growth artificial intelligence sector to offset the drag from underperforming legacy loans.
Investors should closely monitor upcoming SEC 10-Q filings for precise valuations of the new AI holdings and track future default rate reports within the US leveraged loan market.