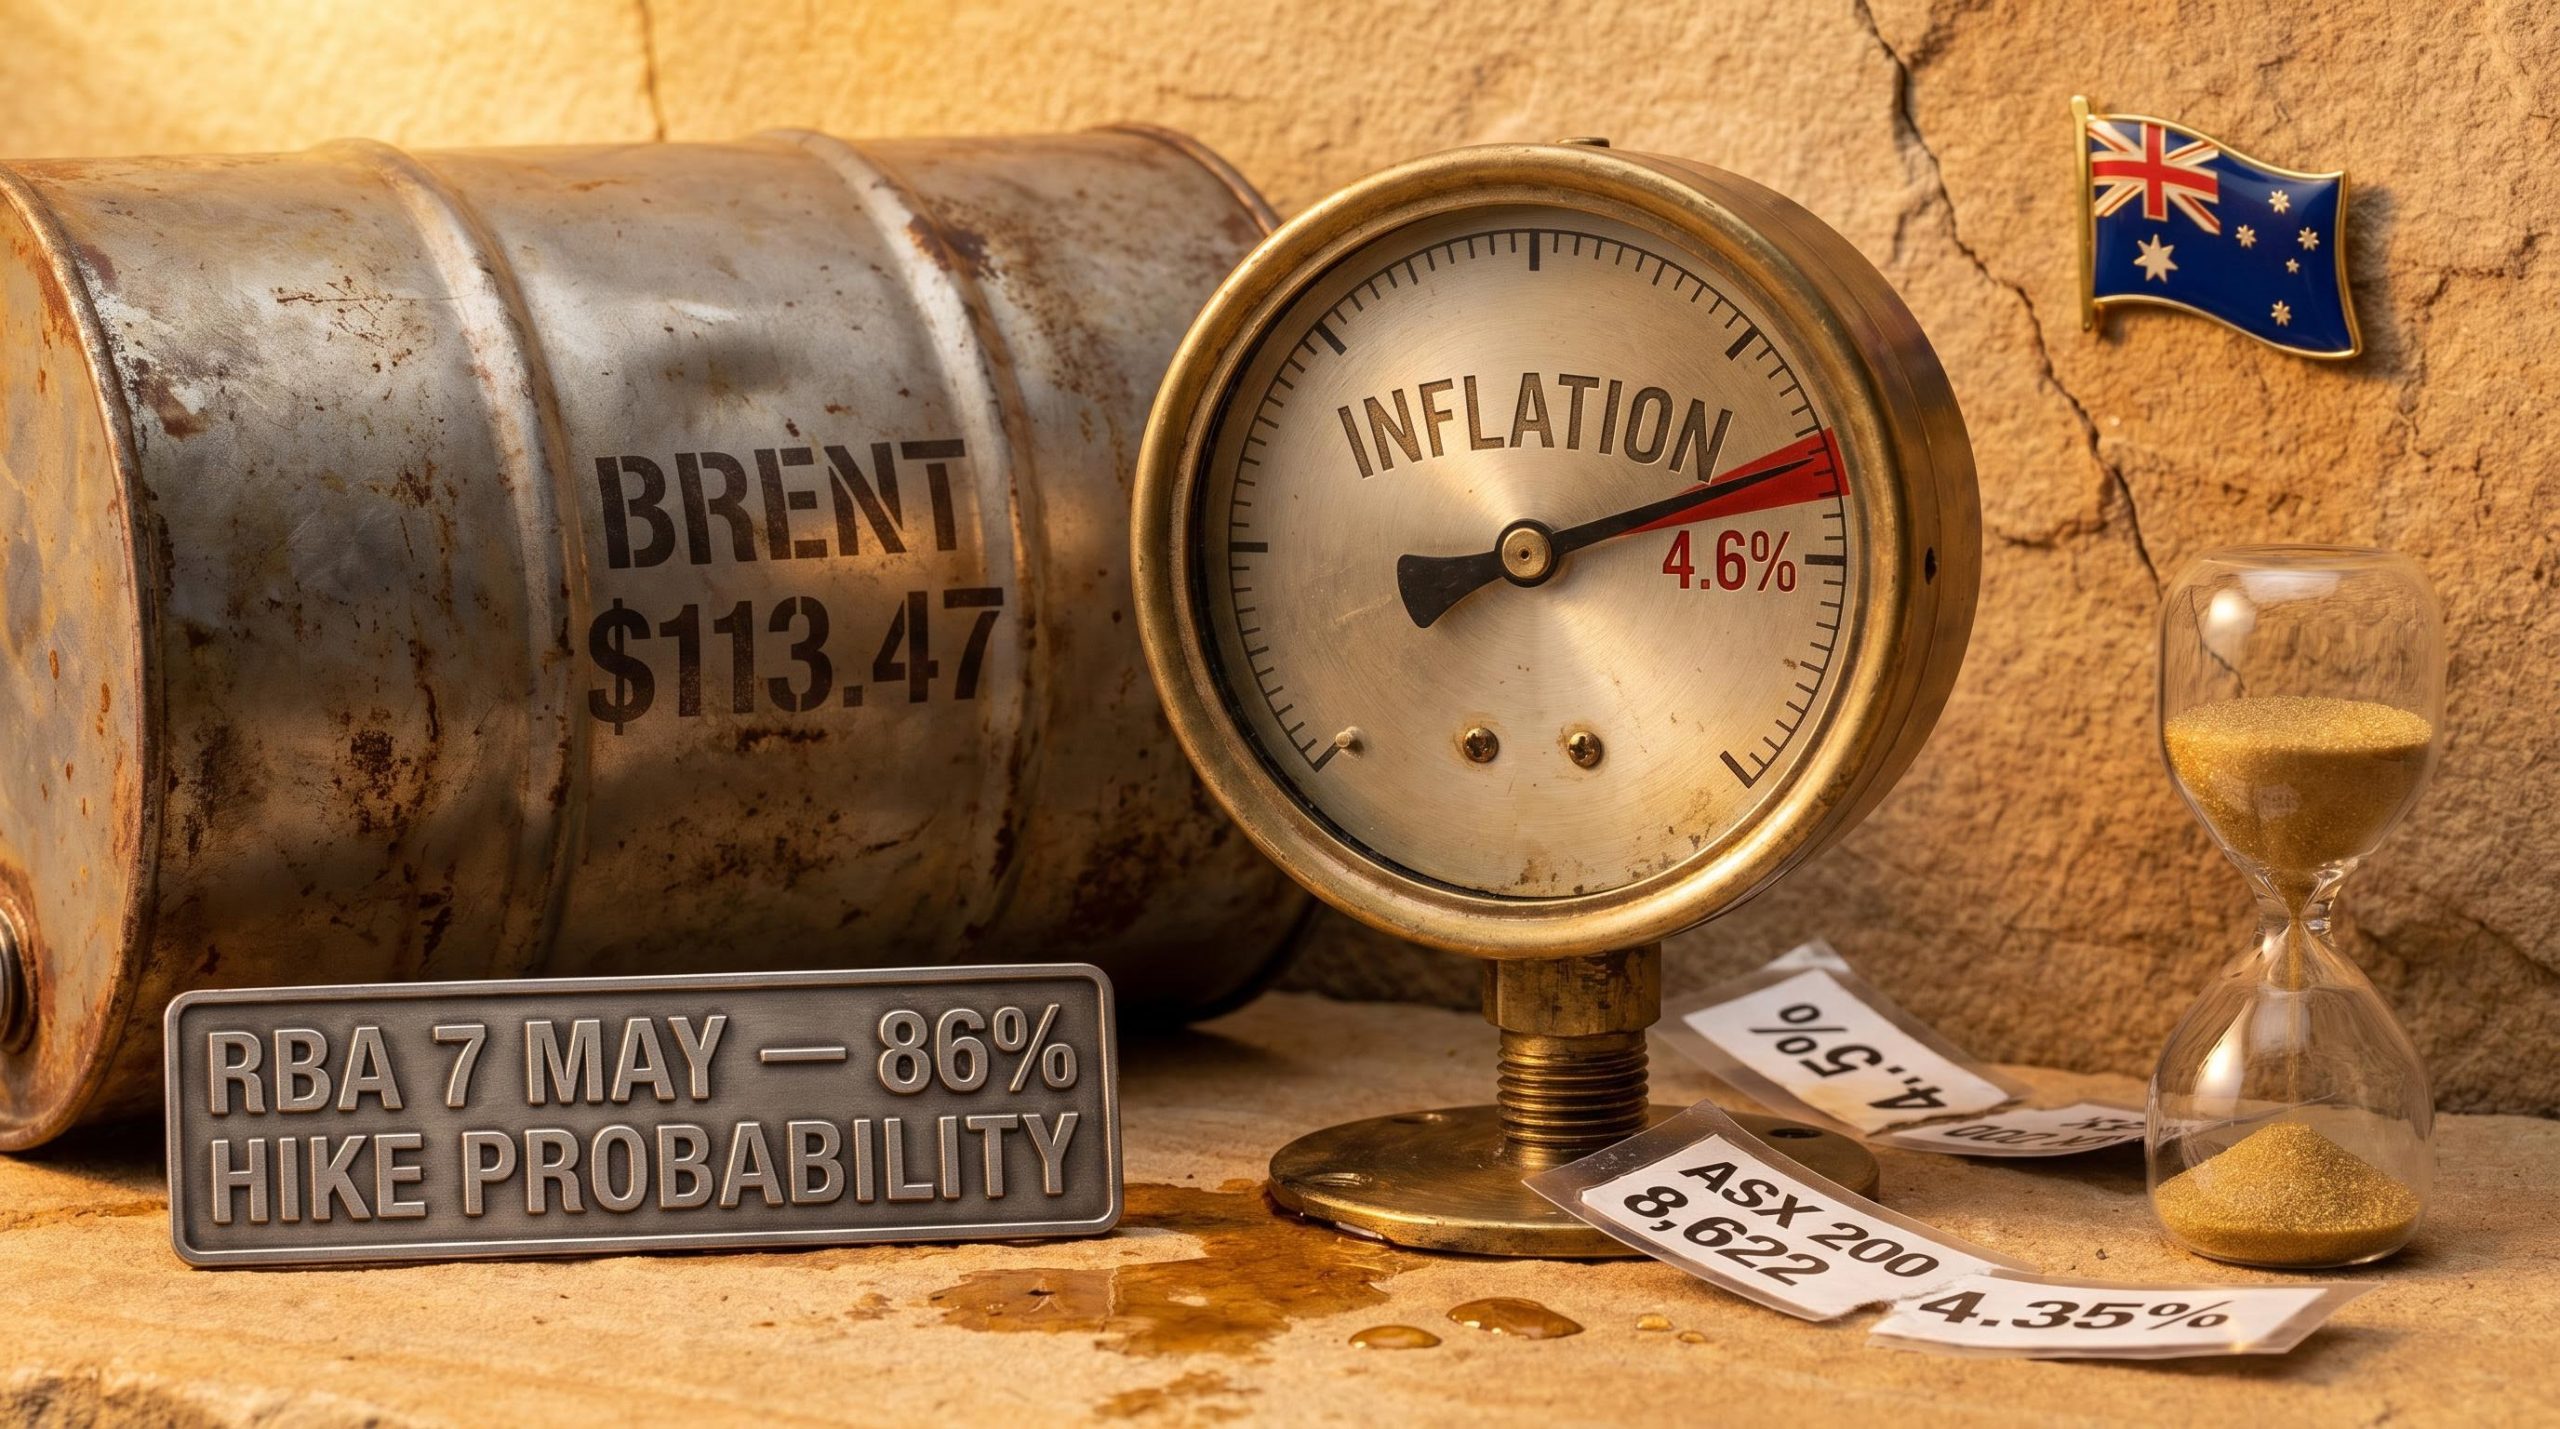
Brent crude at $113.47 a barrel. Australian headline inflation at 4.6%, its highest reading in two and a half years. An 86% market-implied probability that the Reserve Bank of Australia (RBA) will raise the cash rate at its 7 May meeting. The consensus interpretation is straightforward: inflation is back, and interest rates are going up. But the consensus may be reading the wrong playbook.
The US and Israeli strikes on Iran on 28 February 2026, and the resulting Strait of Hormuz disruption, have compressed what would normally be a slow-moving macro story into a matter of weeks. Australian investors are navigating a market that swung roughly 8-9% lower, rallied 9.2% from its trough, and still sits approximately 4-5% below pre-conflict levels. The RBA is caught between above-target inflation and Oxford Economics modelling that points to potential back-to-back quarterly GDP contractions.
The rate-hike narrative, while currently dominant, is likely to reverse faster than markets expect. Understanding why requires examining how oil supply shocks have historically interacted with central bank behaviour, and the investors who grasp this pattern hold a timing advantage most of the market is currently missing.
How a conflict 8,000 kilometres away repriced Australian inflation overnight
The International Energy Agency has not been subtle in its assessment.
The Strait of Hormuz closure represents the largest supply disruption in the history of the global oil market.
That characterisation sets the scale of what followed. As of 30 April 2026, near-zero shipping traffic passes through the strait. Insurance costs for vessels remain elevated even under partial reopening scenarios. The disruption is not theoretical; it is priced into every barrel of crude moving through global markets.
The transmission chain from the Gulf to Australian consumer prices runs through a short and direct sequence:
- Strait of Hormuz closure removes a significant share of global oil supply from transit
- Brent crude rises to $113.47 USD/bbl (as of 30 April 2026)
- Australian fuel and logistics costs climb in lockstep with global crude benchmarks
- Headline CPI lifts as energy costs flow through to goods and services pricing
From the Gulf to the grocery aisle: the Australian transmission channel
Australia is a structural oil importer. The country’s fuel supply depends on seaborne crude and refined product shipments, which means global crude price movements feed directly into domestic petrol prices, freight costs, and ultimately the consumer price index.
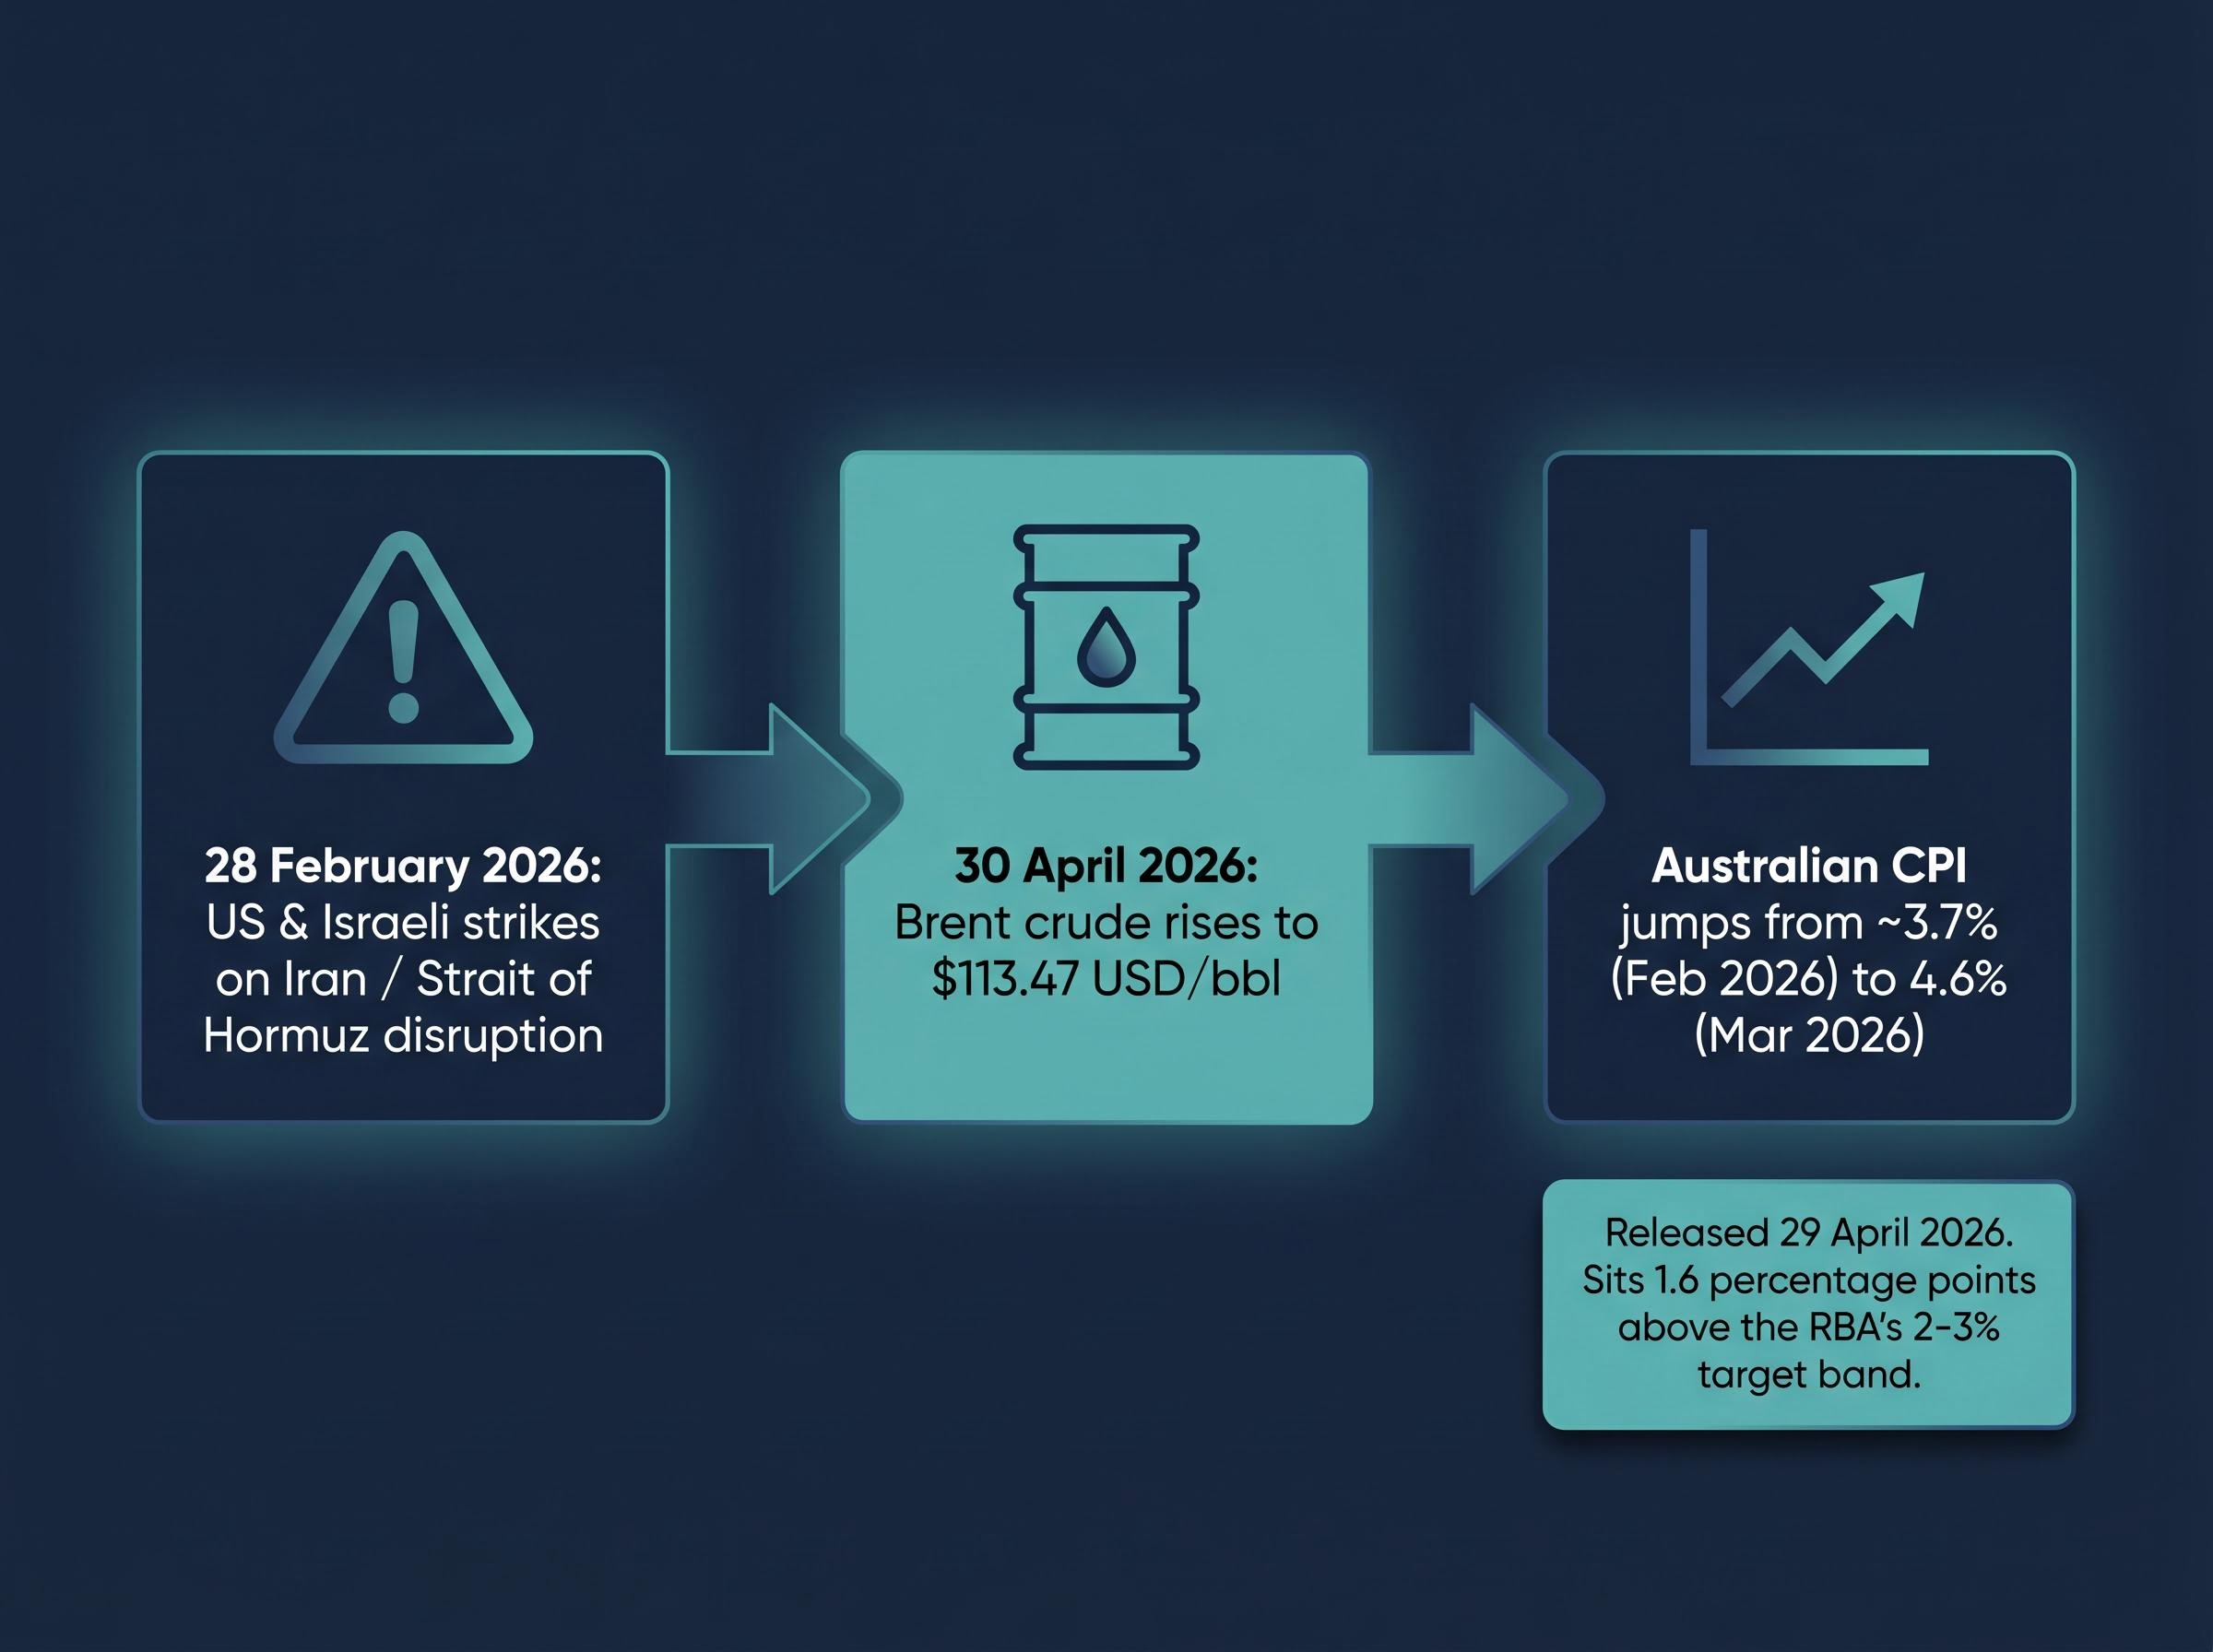
The speed of the pass-through has been striking. Australian CPI sat at approximately 3.7% in February 2026 and below 4% in late 2025. The March 2026 reading, released by the Australian Bureau of Statistics on 29 April 2026, came in at 4.6% year-on-year, a jump of nearly a full percentage point in a single month. That 4.6% figure sits 1.6 percentage points above the ceiling of the RBA’s 2-3% target band.
The ABS Consumer Price Index release for March 2026 confirmed the 4.6% headline reading, with housing and transport costs among the primary contributors, validating the speed and breadth of the energy price pass-through into domestic consumer prices.
Whether this inflation shock is structural (requiring sustained rate hikes) or exogenous and temporary (likely to reverse as oil supply normalises) drives the entire investment case from here.
When big ASX news breaks, our subscribers know first
What the Taylor Rule says the RBA should do, and why that answer is uncomfortable
The Taylor Rule is a framework economists use to estimate where a central bank’s interest rate should sit, given current inflation and economic output. It provides a principled benchmark: not a prediction of what the RBA will do, but a measure of what a rules-based approach would imply.
The arithmetic is uncomfortable. The standard Taylor Rule applies a coefficient of approximately 1.5x, meaning that for every 1 percentage point by which inflation exceeds the target, the central bank should raise rates by roughly 1.5 percentage points above the neutral rate.
| Indicator | Value |
|---|---|
| Australian CPI (March 2026) | 4.6% |
| RBA target midpoint | 2.5% |
| Inflation overshoot | 2.1 percentage points |
| Taylor Rule implied adjustment (1.5x coefficient) | ~3.15 percentage points above neutral |
| Market-implied May terminal rate | ~4.255% |
Oxford Economics expects the RBA to hike at the 7 May meeting regardless of geopolitical resolution. ASX 30-Day Interbank Cash Rate Futures, trading at 95.745 as of 24 April 2026, imply a cash rate of approximately 4.255%, consistent with an 86% probability of a move from 4.1% to 4.35%.
RBA rate path forecasts diverge sharply between commercial bank models and the central bank’s own medium-term guidance; major bank projections cluster around a terminal rate of 4.85% by August 2026, materially above the single 25 basis point increment that futures markets currently price as the most probable outcome.
The gap between 4.35% and what “genuinely tight” actually means
The Taylor Rule implies the RBA needs to be materially higher than 4.35% to be genuinely restrictive. A rate of 4.35% is a single 25 basis point increment. By the rule’s standards, real policy remains accommodative at that level, not tight.
This gap is the core reason why rate-reversal timing matters. If the RBA hikes less aggressively than the rule implies, it signals that policymakers are already weighing growth risks against inflation. And when growth concerns dominate, the pivot arrives sooner than the headline rate trajectory suggests.
The 1970s playbook, and why this time the ending may be written faster
The closest structural analogue to the current moment sits in the oil shocks of the 1970s and early 1980s. The pattern that unfolded then is worth tracing in sequence, because the structural similarity to today becomes visible through the facts before any parallel needs to be drawn explicitly.
NBER research on oil shocks and monetary policy finds that the interaction between energy price surges and central bank rate responses has historically compressed growth before inflation was fully contained, a dynamic that sits at the centre of the current RBA dilemma.
- An exogenous supply shock (oil embargo, Iranian revolution) lifts energy prices sharply
- Headline inflation spikes as energy costs flow through the economy
- Central banks respond with rate hikes, prioritising inflation control
- Economic growth deteriorates as higher energy costs and tighter monetary policy compress demand simultaneously
- Central banks pivot to rate cuts as recession risk overtakes inflation risk
- Recovery follows, rewarding investors who positioned during the dislocated phase
The Volcker period of 1980-1982 illustrates what happens when a central bank refuses to reverse early. The US Federal Reserve raised rates aggressively, driving inflation from approximately 14% down to roughly 3%, but at the cost of unemployment exceeding 10% and a severe recession. The inflation was defeated. The economic damage was considerable.
The four simultaneous channels through which oil price surges and recession risk interact, reduced consumer disposable income, rising business input costs, central bank rate pressure, and an investment and hiring pullback, help explain why every major recession since 1973 has been preceded by a supply-driven energy shock following this same structural sequence.
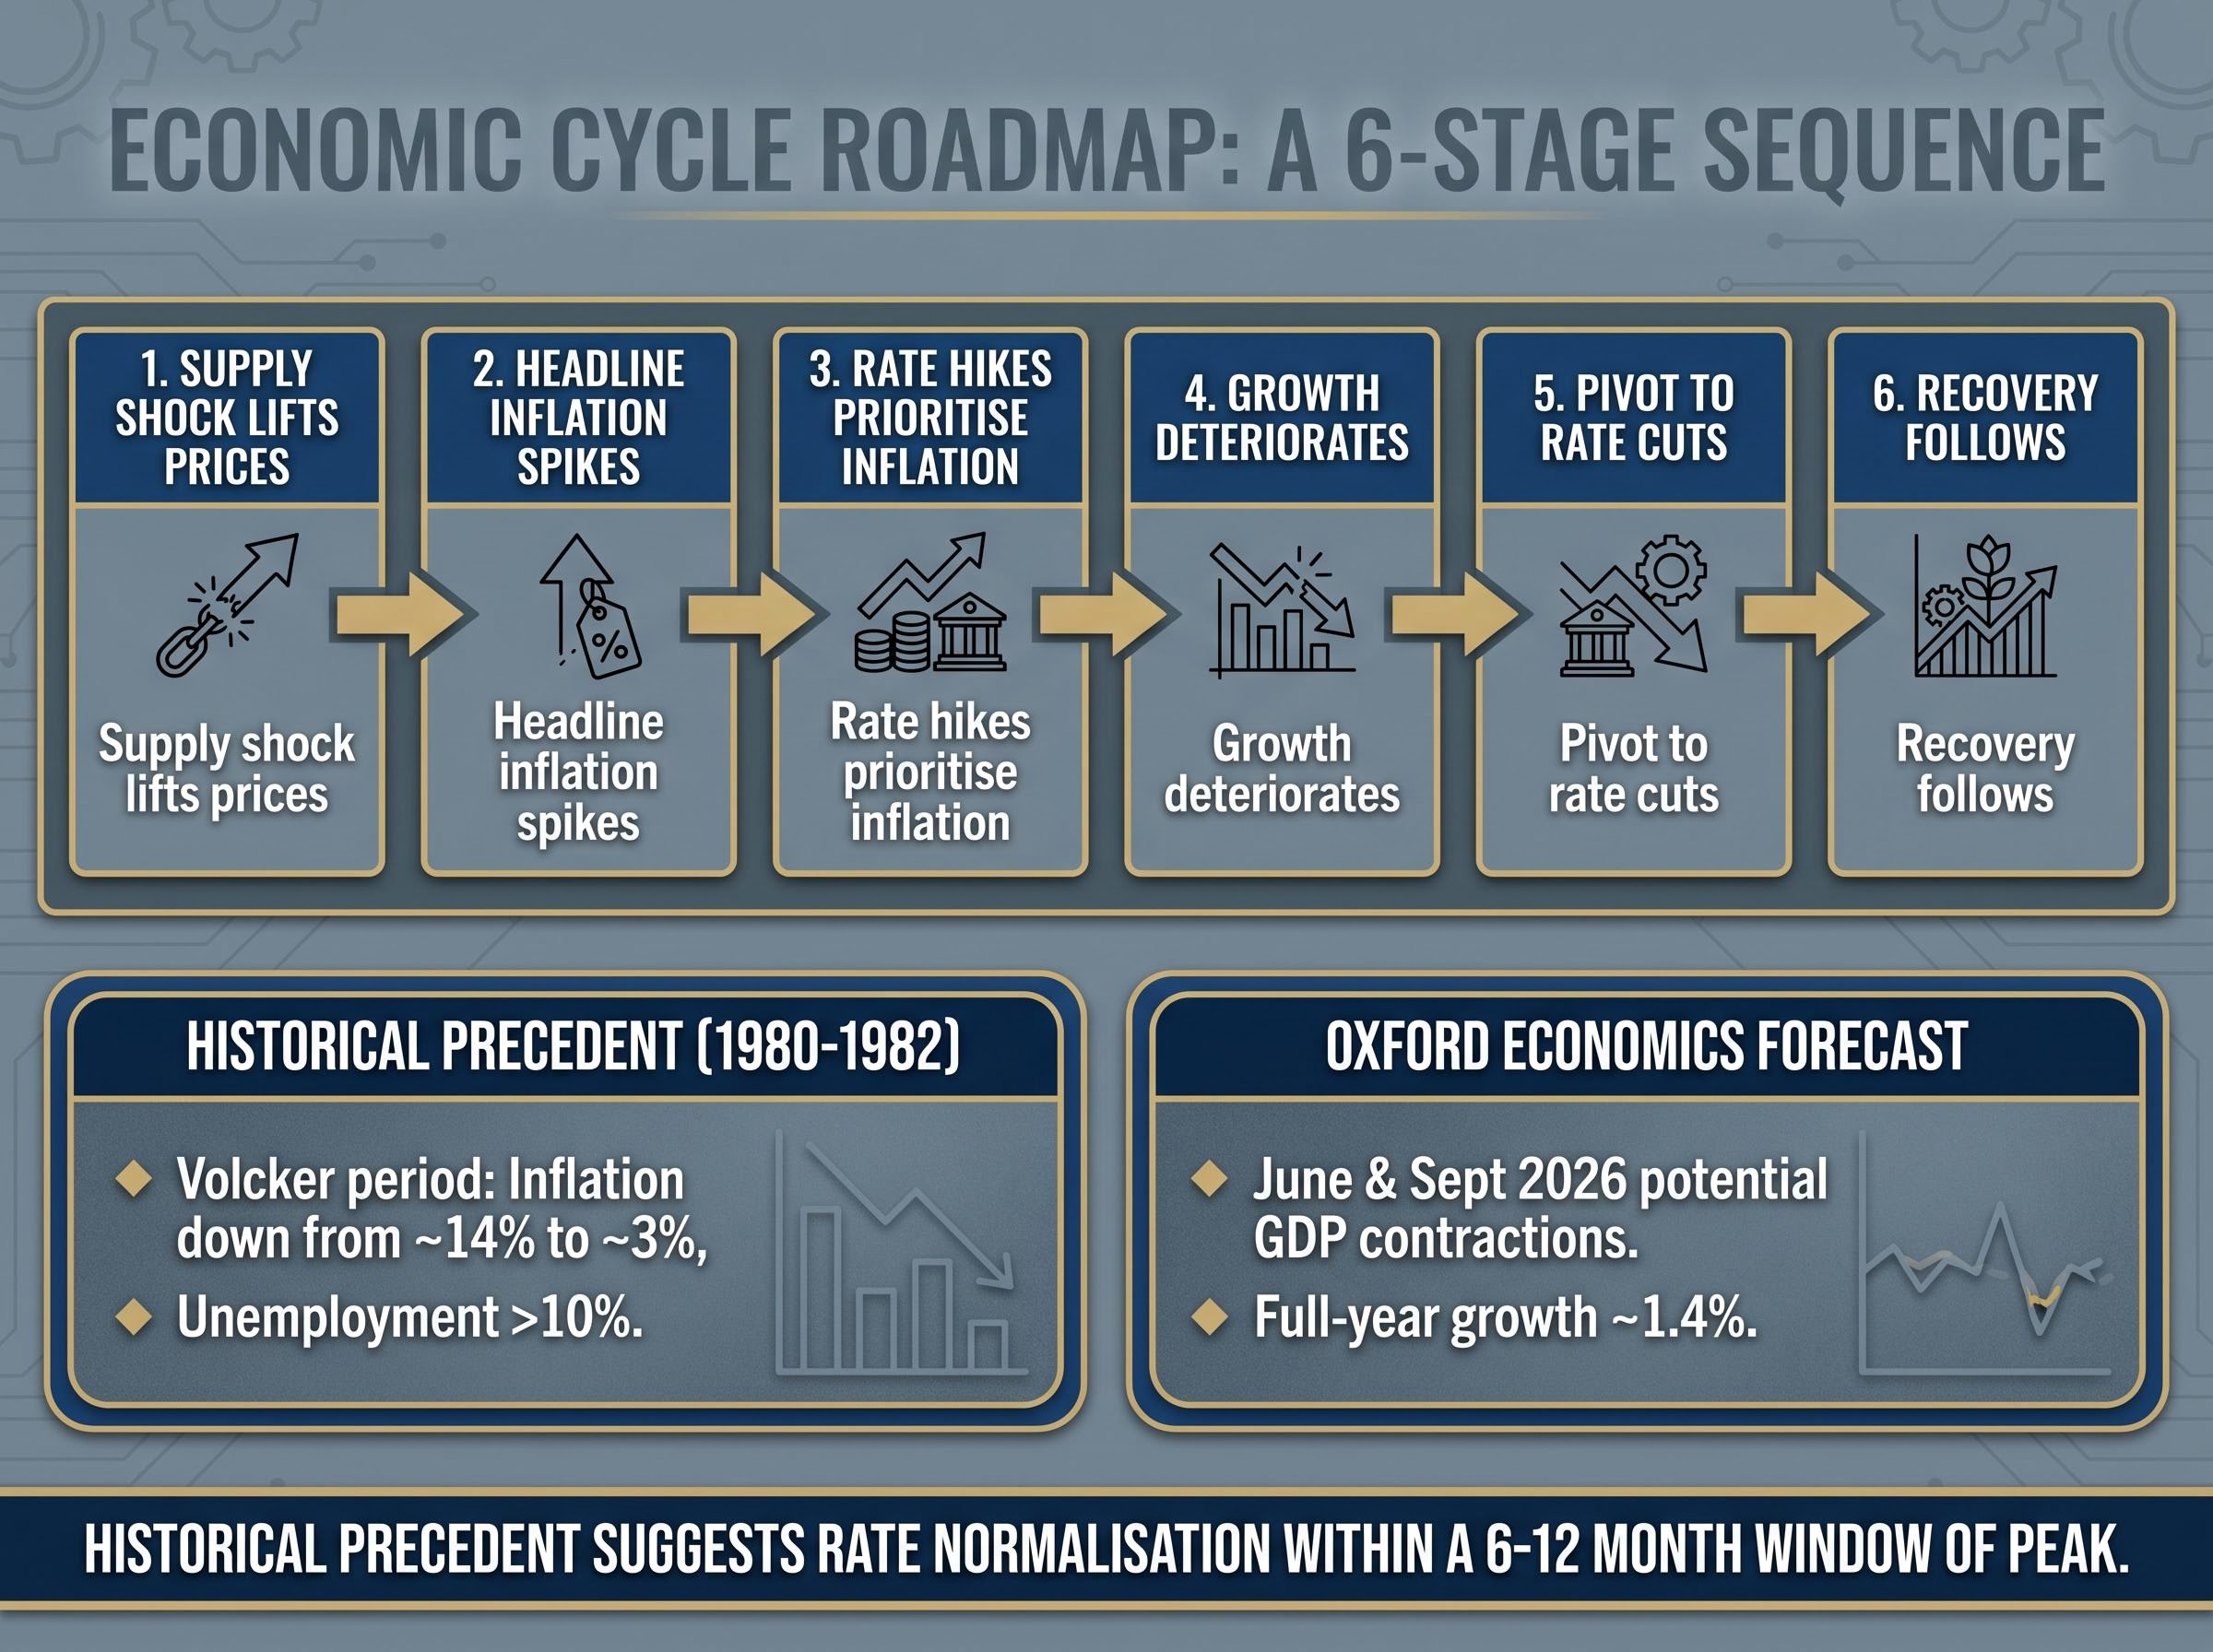
Oxford Economics has assessed that Australia could face its sharpest recession since the early 1990s (outside the pandemic period), with modelling pointing to potential back-to-back GDP contractions in the June and September 2026 quarters and full-year growth slowing to approximately 1.4% under a prolonged conflict scenario.
The structural insight from these historical episodes is that supply shocks simultaneously damage growth and lift prices. Over time, the growth damage tends to dominate, shifting central bank priorities whether policymakers intend it or not. Historical precedent suggests rate normalisation following supply shocks has occurred within a 6-12 month window of the shock’s peak.
What oil futures are actually signalling about the road ahead
The oil futures curve is currently in backwardation. Near-term contracts are priced above longer-dated contracts, a structure that carries a specific and directionally informative signal.
Backwardation in oil futures reflects the market’s implicit assessment that the current supply disruption is temporary rather than permanent. Buyers are willing to pay a premium for immediate delivery, but not for delivery six or twelve months from now, a bet that supply conditions improve over time.
This signal matters directly for the rate narrative. If the futures market is correct that oil prices will moderate as the Hormuz disruption resolves (even partially), the inflationary pulse driving rate-hike expectations is time-limited. The foundation beneath the 86% hike probability begins to shift once the oil price trajectory changes.
Disinflationary forces waiting in the wings
Several structural disinflationary forces are currently suppressed by the oil shock but positioned to reassert as the energy price spike moderates:
- AI-driven productivity improvements compressing input costs across industries
- Softening wage growth reducing demand-side inflation pressure
- Chinese export redirection as goods diverted from US markets (due to tariffs) increase global supply and push prices lower elsewhere
- Falling US rental costs from increased housing supply, reducing a major component of global services inflation
These are not speculative forces. They were actively compressing inflation readings through late 2025, before the 28 February strikes disrupted the trajectory. They represent the conditions that make a faster-than-expected rate reversal structurally plausible, not merely historically precedented.
Global central bank divergence is sharpening the disinflationary picture: some institutions are delaying rate cuts in response to commodity-driven inflation, while others face structural conditions, including redirected Chinese manufacturing exports and AI-driven input cost compression, that make premature tightening genuinely counterproductive.
How Australian investors can position their portfolios through the current ASX dislocation
The ASX 200 closed at 8,622 points on 30 April 2026, down 0.75% on the session. The index touched 8,262 on 23 March at its post-conflict low, rallied to approximately 9,021.5 by mid-April, and has since retraced. The net position: roughly 4-5% below where the market sat before the strikes.
That dislocation, combined with the macro argument established above, points to a three-part positioning framework:
- Preserve capital now using short-duration cash instruments while rate uncertainty persists
- Build fixed income exposure at yield highs, locking in attractive yields on investment-grade bonds that offer capital gain potential when rates eventually reverse
- Add quality equities through the dislocation, favouring companies with strong pricing power and global revenue diversification
The following ASX-listed exchange-traded funds illustrate (but do not constitute recommendations for) how each element of this framework could be expressed:
| ETF Name | ASX Code | Asset Class | Rate Cycle Relevance |
|---|---|---|---|
| Vanguard Global Aggregate Bond (Hedged) | VBND | Global bonds (AUD-hedged) | Yield entry now; capital gain at rate pivot |
| BetaShares Australian Inv. Grade Corp. Bond | CRED | Australian investment-grade bonds | Yield entry now; capital gain at rate pivot |
| Vanguard MSCI Index International Shares | VGS | Global developed market equities | Quality equity exposure through dislocation |
| VanEck MSCI International Quality | QUAL | Quality factor global equities | Pricing power focus for inflation resilience |
| BetaShares High Interest Cash | AAA | Short-duration cash | Capital preservation while awaiting conviction |
The framework does not require calling the exact turning point. It requires recognising that the rate-hike phase, while real, is late-cycle by historical standards, and building positions that benefit from the second chapter: the pivot.
Investors wanting to stress-test the ETF selections above against specific portfolio construction criteria will find our full explainer on ASX portfolio defence during inflation useful; it examines pricing power screening metrics for ASX equities, the role of Australian 10-year government bond yields in capital allocation decisions, and the dollar-cost averaging sequencing logic suited to a high-rate, supply-shock environment.
This article is for informational purposes only and should not be considered financial advice. Investors should conduct their own research and consult with financial professionals before making investment decisions. Past performance does not guarantee future results. Financial projections are subject to market conditions and various risk factors.
The supply shock cycle has a second chapter, and patient investors know to wait for it
The pattern is now legible. An oil shock triggers inflation. Inflation triggers rate hikes. Rate hikes arrive late in the cycle, when growth damage is already underway. The pivot follows as recession risk overtakes inflation risk on the central bank’s priority list. Historical precedent places that normalisation within a 6-12 month window of the shock’s peak.
Genuine uncertainty remains. The Strait of Hormuz situation is unresolved. A conditional ceasefire is nominally in place, but insurance costs remain elevated, and a prolonged closure extends the timeline for everything in this analysis. The ultra-low inflation environment of the 2010s appears structurally unlikely to return; 2% looks more like a lower bound than an upper limit in the regime ahead.
The supply shock cycle has a second chapter. The oil futures market is already pricing it through backwardation. Rate expectations have not yet caught up. The gap between those two signals is where the timing advantage sits.
The investors who benefited most from past supply shock cycles were not those who predicted the peak with precision. They were those who understood, during the dislocated first chapter, that the second chapter was coming, and positioned accordingly.
These forward-looking statements are speculative and subject to change based on market developments, geopolitical resolution, and central bank decisions.