
How to Position for the Most Event-Dense Week of July 2026
6 hrs ago

Approaching defence contractor investing requires looking past top-line headline figures to uncover the true financial health of an organisation. This reality was exposed by earnings reports released today, 29 April 2026. Parsons Corporation announced a revenue contraction for the first quarter, yet simultaneously reported a historic $9.3 billion pipeline of future work.
This sharp divergence captures the complex nature of the current United States military spending environment. An $848.3 billion fiscal year 2026 budget request is currently colliding with intricate project execution timelines and supply chain realities. Geopolitical pressures continue to drive consistent sector growth, but translating federal appropriations into immediate corporate earnings remains challenging for mid-tier operators.
This analysis provides a forensic look at financial health within the aerospace and security sector. By using the recent Parsons results as a practical case study to evaluate backlog quality and revenue visibility, investors can better understand how to read structural growth signals that the broader market might easily miss.
A contract pipeline is not a theoretical abstraction. In the government services sector, it serves as the primary leading indicator of a firm’s long-term survival and capacity for future expansion. Investors must first understand the specialised accounting used by these firms, starting with the critical distinction between funded and unfunded obligations within corporate backlogs.
Funded obligations: These represent signed contracts where the federal government has already appropriated the capital and authorised the company to perform the specified work immediately. Unfunded obligations: These denote awarded contracts where specific funding is subject to future congressional appropriation cycles, introducing timeline risks and administrative delays.
The federal appropriation cycle creates structural bottlenecks that can delay these unfunded projects for months or even years. Because of this political dynamic, financial analysts rely heavily on the book-to-bill ratio to gauge genuine operational growth. This metric divides the value of new orders received by the amount billed for current work over a specific reporting period.
The industry standard benchmark sits at a 1.0x ratio, meaning a company is replacing its completed government contracts at an equal pace. A ratio above 1.0x represents the ultimate metric of expansion for a mid-tier operator. It signals that future revenue streams are growing faster than current execution capacity, providing a buffer against future budget cuts.
Specialized financial advisory firms track government contractor book-to-bill metrics closely because they provide a reliable leading indicator of an organization’s ability to maintain operations when federal appropriations face administrative delays.
Investors who grasp this distinction can look past immediate revenue misses to spot underlying momentum. When a firm consistently books more work than it bills, it builds a defensive moat against the cyclical nature of federal spending packages.
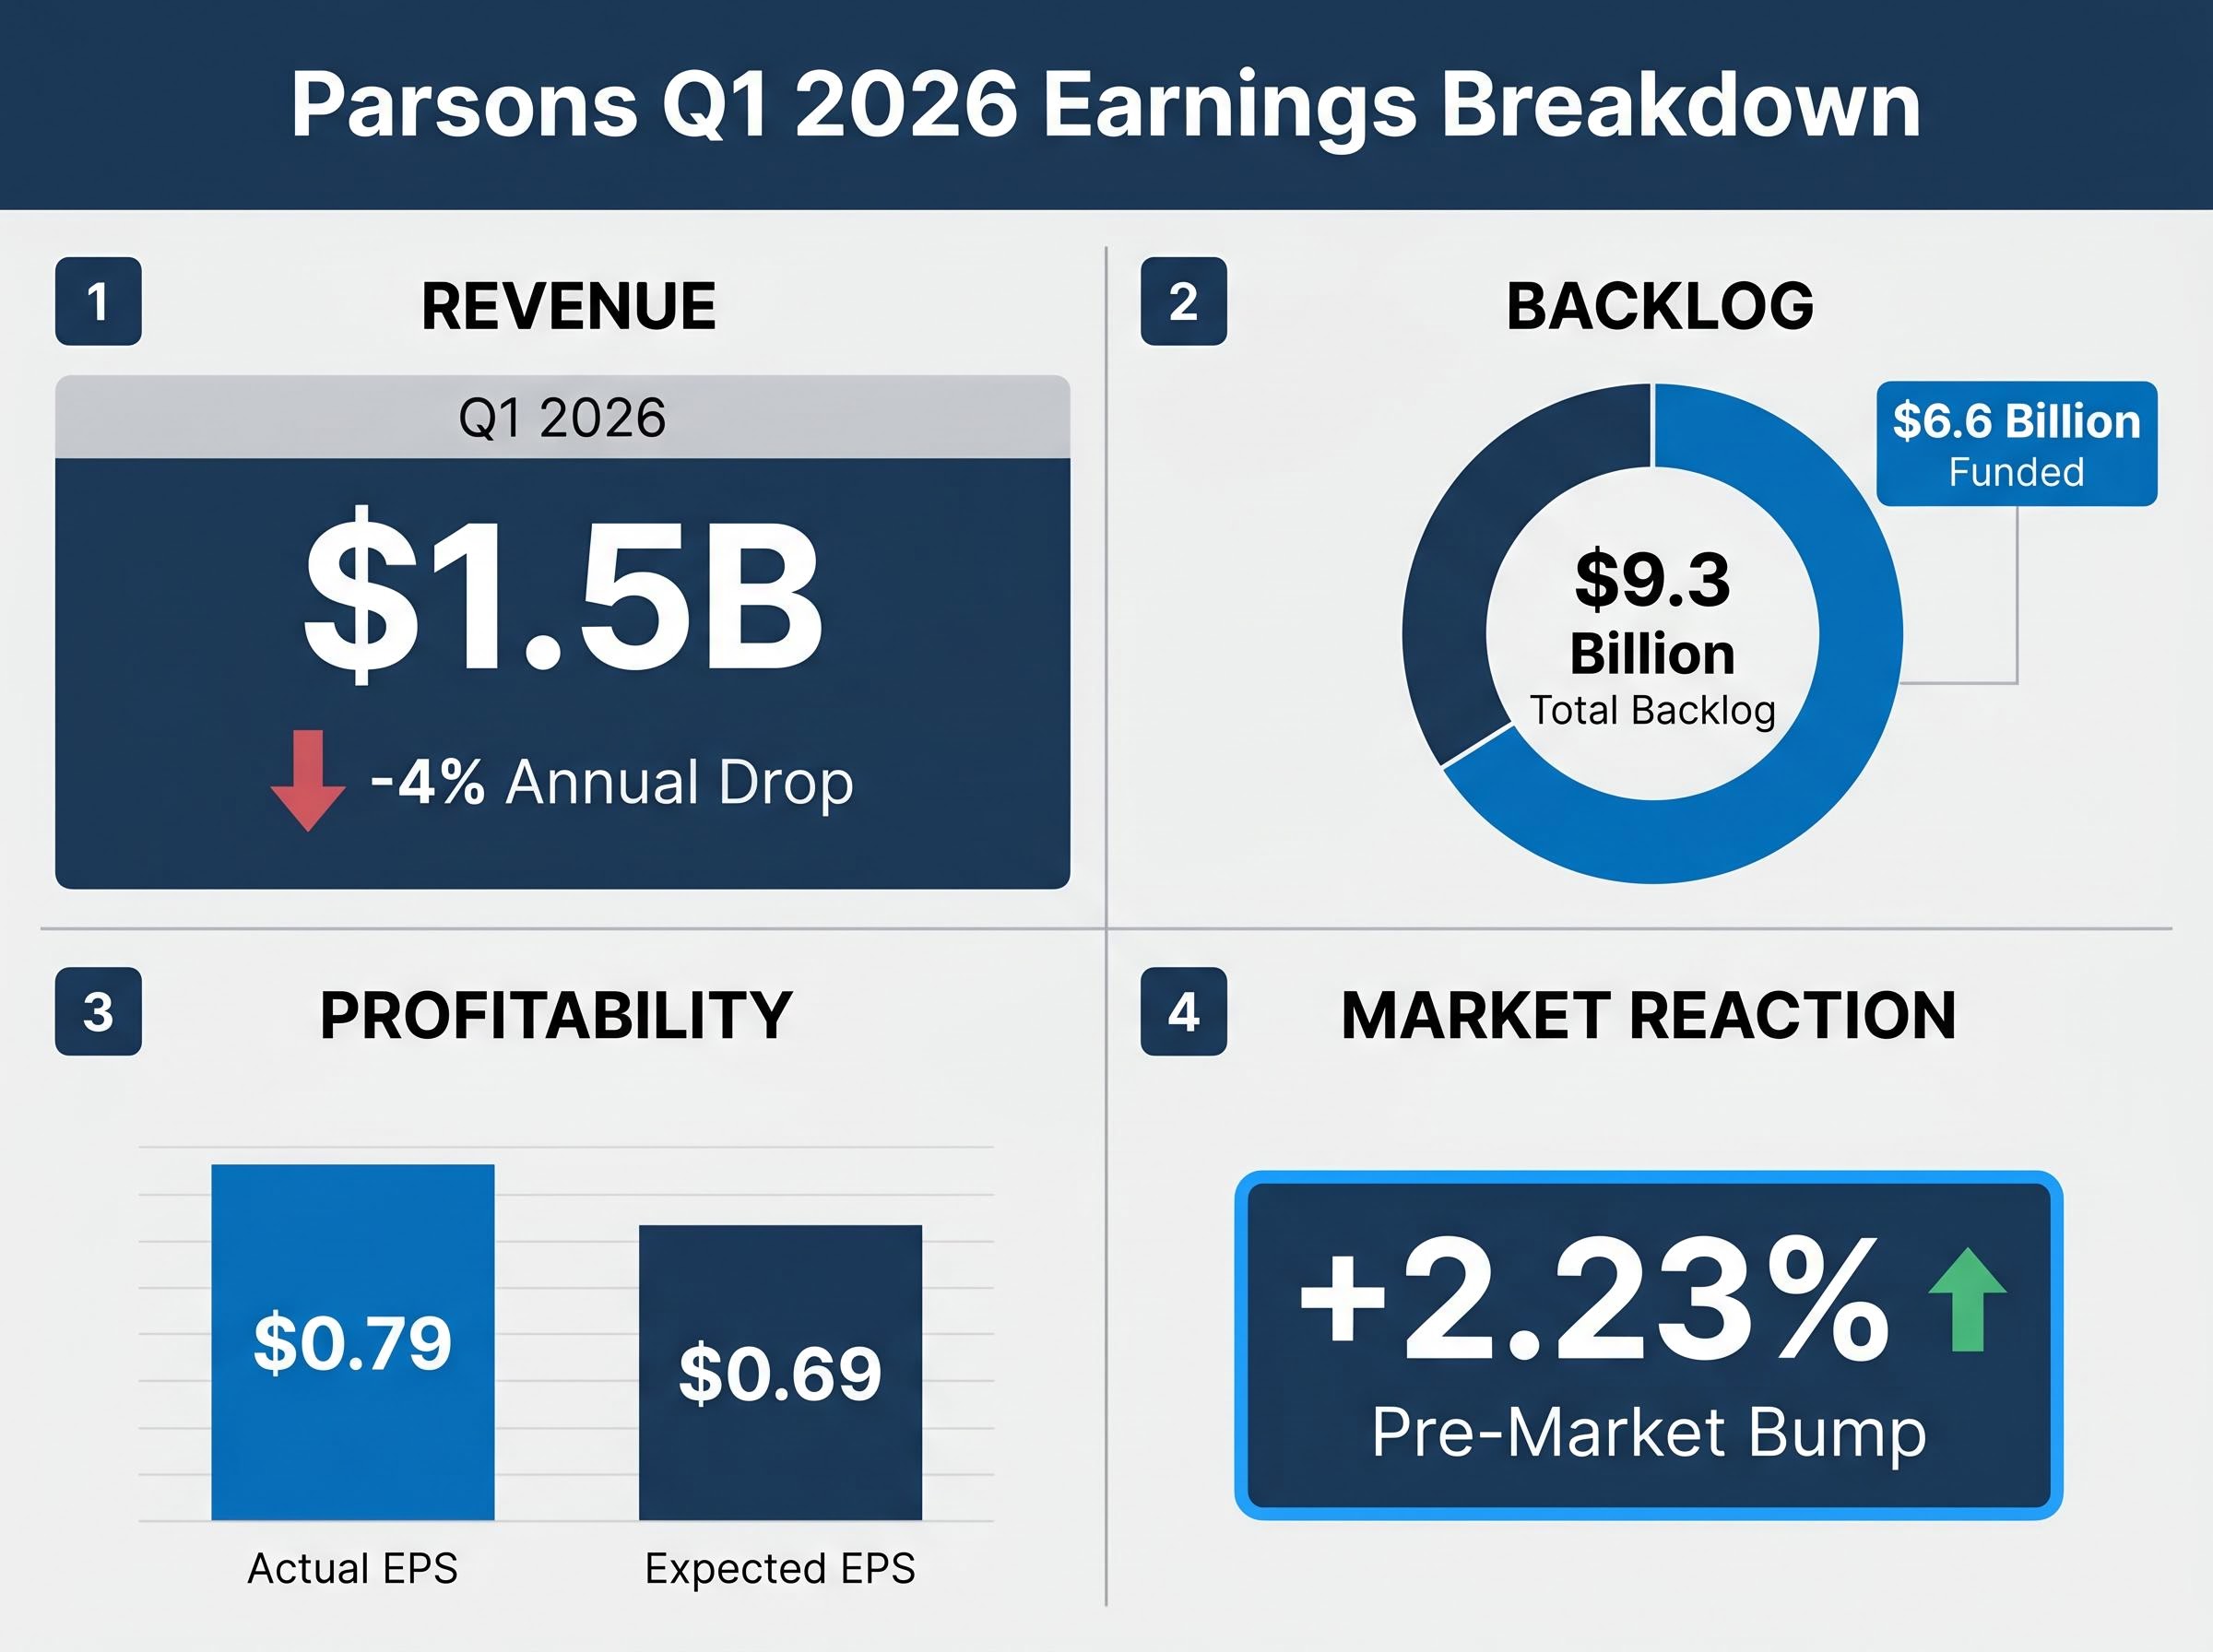
The first quarter 2026 performance data from Parsons demonstrates exactly how a headline top-line drop can mask a structurally healthier underlying business. The company reported Q1 2026 revenue of $1.5 billion, representing a 4% annual drop from the previous year. However, this contraction was primarily driven by the timing of a specific, undisclosed classified project that skewed the immediate reporting figures.
Excluding the impact of that classified project, the company actually achieved an organic expansion rate across its broader portfolio. More importantly, the future pipeline expanded significantly during the quarter. The total backlog reached $9.3 billion, with a substantial $6.6 billion of that figure sitting as financially backed, funded future work.
The official SEC Form 10-Q filing provides a detailed breakdown of these funded obligations, allowing analysts to strip away the noise of classified project timing to evaluate genuine portfolio expansion.
This extensive pipeline generated a strong book-to-bill ratio, comfortably above the industry benchmark and signalling aggressive future expansion. Operational capital efficiency also improved markedly during the quarter, further strengthening the underlying financial position of the firm.
The company expanded its profitability ratio and delivered an adjusted earnings per share (EPS) of $0.79, comfortably outperforming analyst expectations. This rare combination of margin expansion and capital efficiency explains why the stock experienced a +2.23% pre-market bump on the day of the announcement. Market participants recognised that the top-line revenue miss was a temporary timing issue rather than a structural defect.
| Financial Metric | Q1 2026 Expectations | Q1 2026 Actual Results | Market Implication |
|---|---|---|---|
| Revenue | ~$1.53B | $1.49-$1.50B | Timing-driven contraction |
| Adjusted EPS | $0.69 | $0.79 | Profitability beat |
| Total Backlog | N/A | $9.31B | Forward visibility expansion |
| Profitability Margin | N/A | Operational efficiency gain |
Evaluating a single company requires benchmarking its performance against the broader macro tailwinds supporting the entire military ecosystem. The proposed FY2026 United States military budget request totals $848.3 billion, pushing total federal appropriations toward the historic $1 trillion mark. This massive capital injection provides significant top-line potential across the board, but political risk and operational scale continue to dictate the ceiling for actual corporate growth.
This vast capital pool is heavily weighted toward autonomous systems, with US military drone procurement allocations expanding rapidly as the Pentagon shifts its focus away from legacy hardware platforms.
Structural vulnerabilities remain a pressing concern for the sector despite the heavy funding environment. Supply chain bottlenecks continue to restrict delivery cadences for advanced hardware, and shifting political mandates can abruptly alter long-term procurement priorities.
Macroeconomic Risk Commentary According to April 2026 industry analysis, aggressive military spending plans proposed by the current administration could potentially backfire. These policies may cause unstable funding cycles that ultimately impact contractor stability and delay long-term delivery timelines.
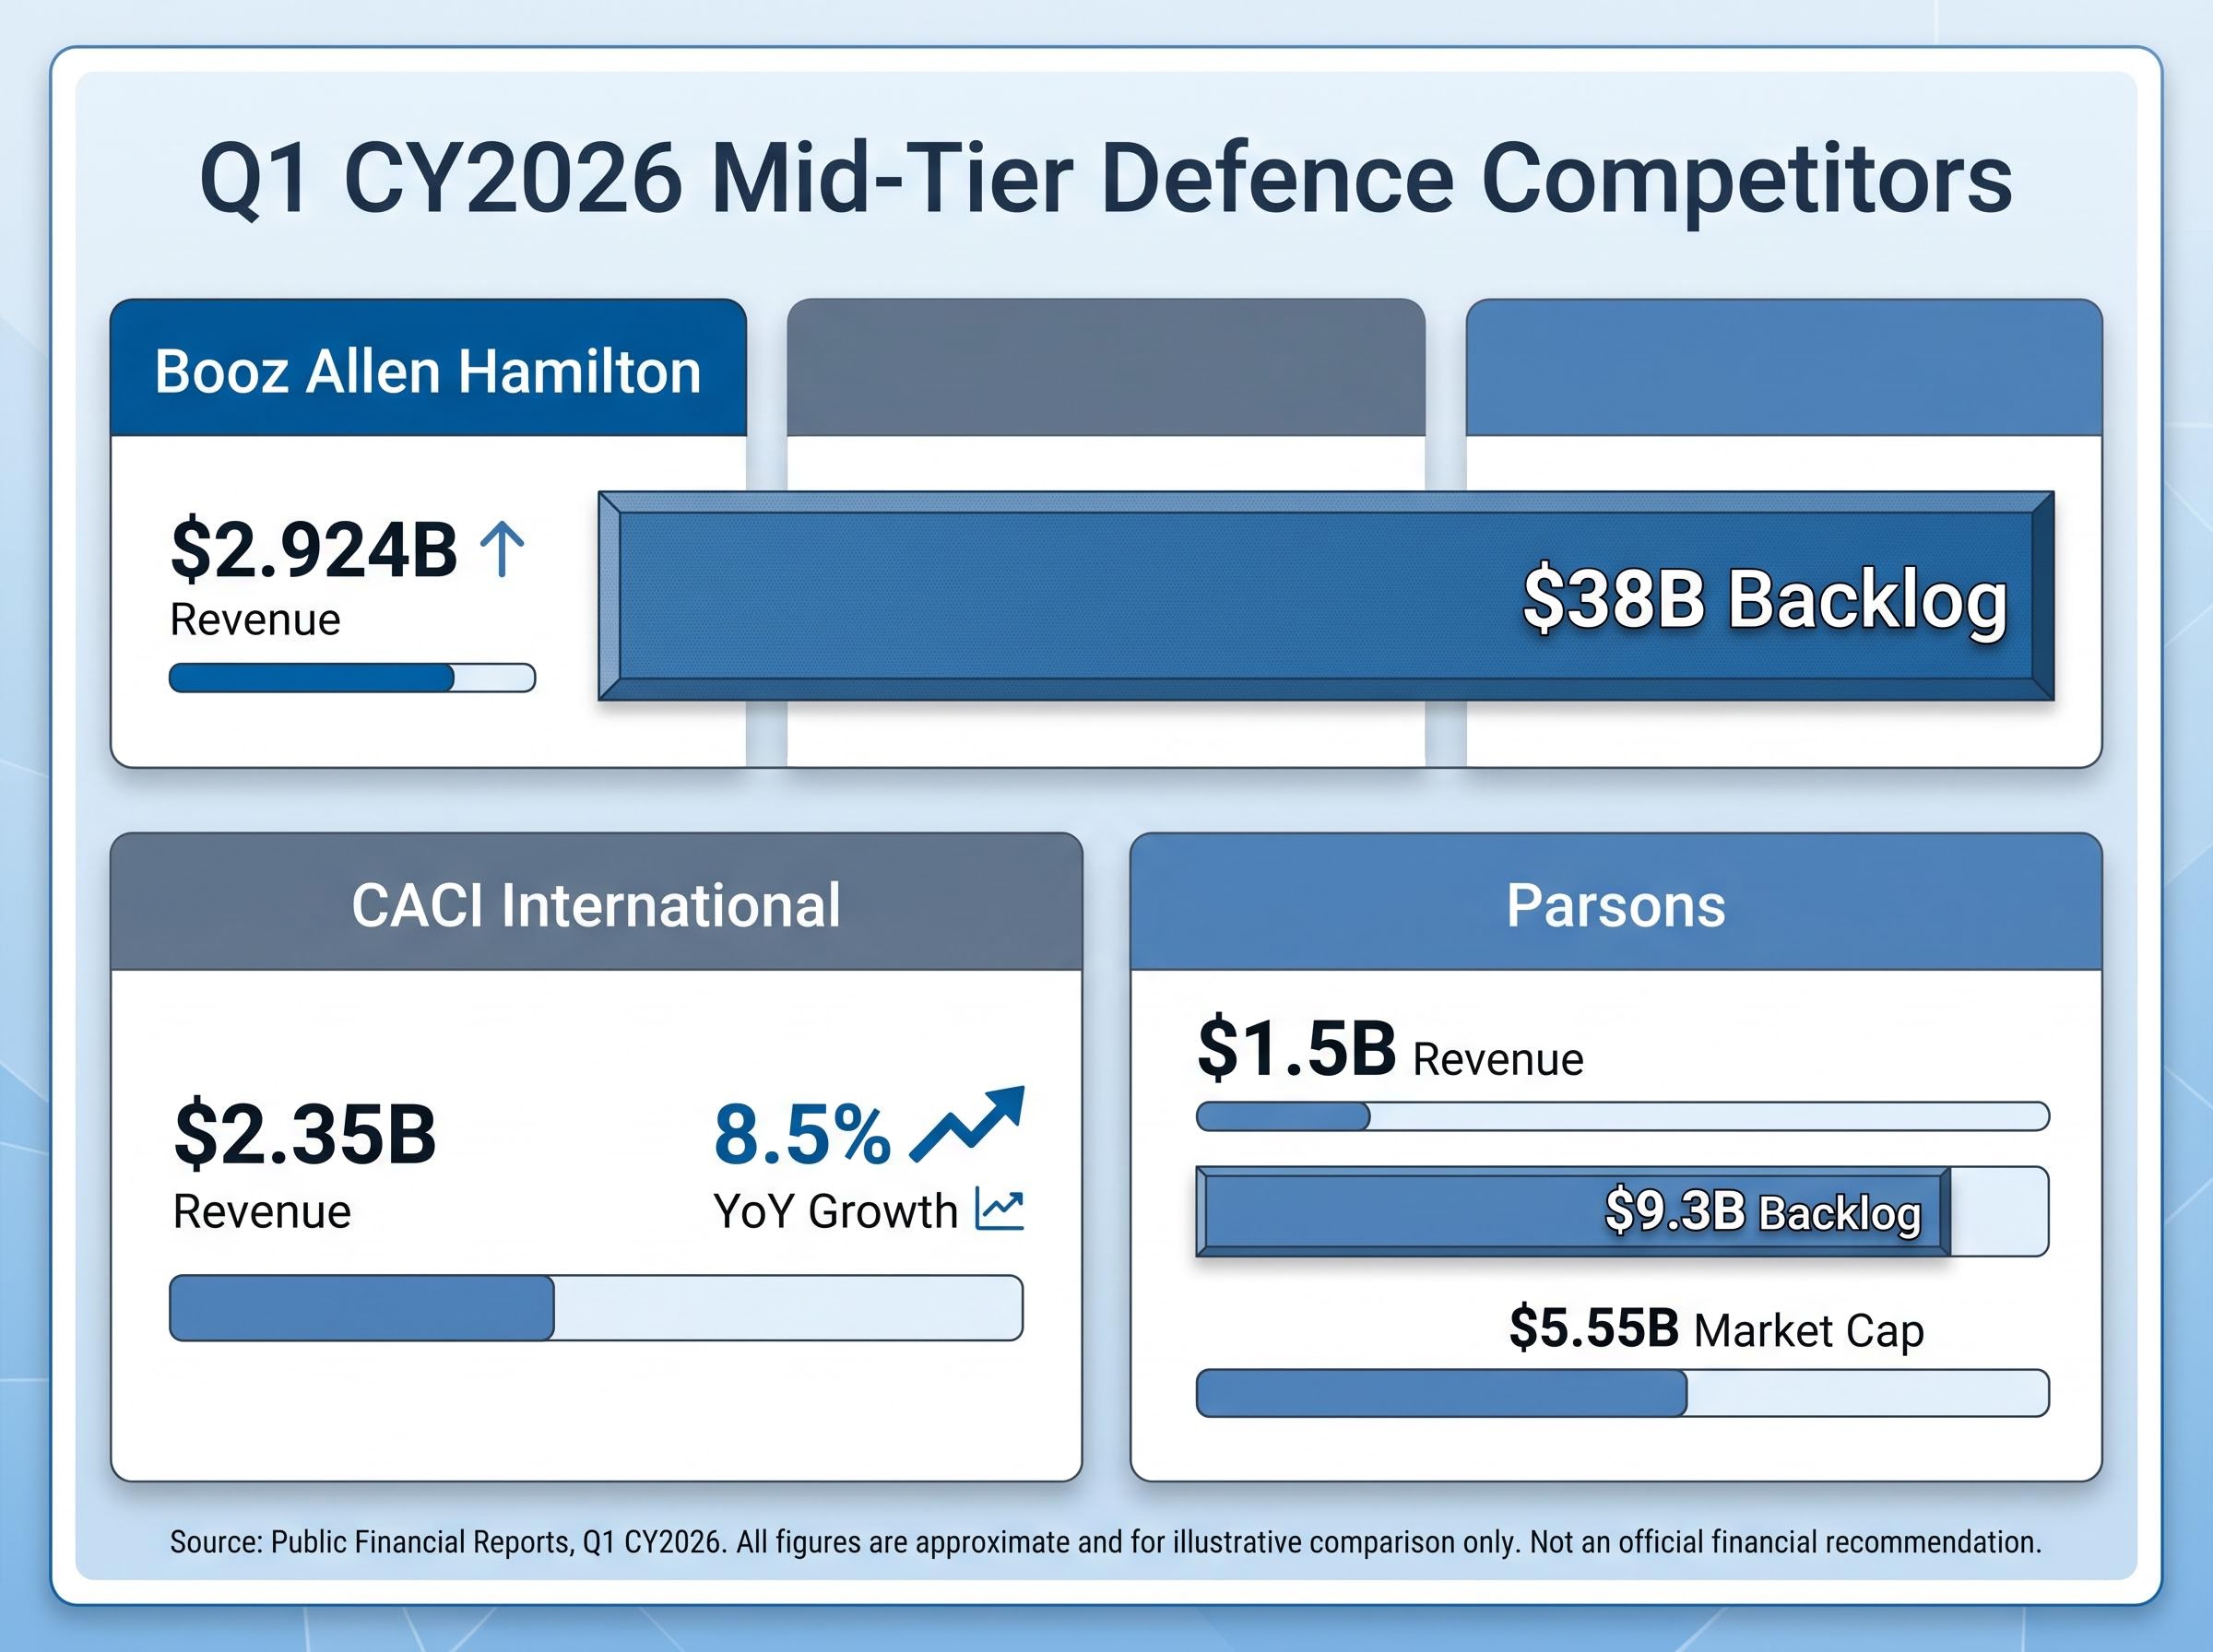
With a market capitalisation of $5.55 billion, Parsons occupies a specific niche within the mid-tier operating ecosystem. Comparing this scale to industry heavyweights reveals varying approaches to backlog volume and revenue growth rates across the sector. Booz Allen Hamilton reported $2.924 billion in Q1 CY2026 revenue, supported by a massive $38 billion backlog that outpaces almost all peers in pure volume.
Conversely, CACI International generated $2.35 billion in Q1 CY2026 revenue, representing an 8.5% year-over-year growth rate. While Parsons trades at lower valuation multiples than these larger competitors, its 71% funded backlog ratio provides a highly stable foundation against sector volatility.
As geopolitical competition with China accelerates, mid-tier firms with specialised national security capabilities are increasingly viewed as strategic acquisition targets. Market participants must carefully weigh the sheer scale of a firm like Booz Allen Hamilton against the higher relative growth ceiling of a smaller, specialised operator.
Translating this analytical framework into a commercial strategy requires a systematic approach to portfolio allocation. Investors can evaluate their own holdings by applying a concrete assessment matrix to any mid-tier defence operator they encounter. Balancing lower valuation multiples against the demand for high backlog volume is the primary trade-off market participants face in this highly regulated sector.
Investors must also weigh the upside of early stage defence technology commercialisation, such as advanced radar signature reduction materials, which carry higher execution risk but offer significant growth potential.
For risk-averse market participants, gaining broad sector exposure through specialised exchange-traded funds (ETFs) offers a practical alternative strategy. Funds such as the iShares U.S. Aerospace & Defense ETF (ITA) and the Invesco Aerospace & Defense ETF (PPA) spread capital across both prime contractors and mid-tier competitors. This diversification limits exposure to single-contract delays while capturing the broader upside of the $848.3 billion federal spending environment.
The relationship between massive contractual pipelines and long-term execution risks defines the current military procurement market. Historic budget appropriations create the appearance of guaranteed growth, but federal spending bottlenecks and shifting political mandates constantly test corporate operational resilience.
In the 2026 defence market, revenue visibility and high-quality funded backlogs stand as the ultimate premium assets. Companies cannot survive on unfunded promises alone when capital costs remain elevated. Mid-tier operators that can maintain margin stability while converting government awards into actual billable hours will continue to differentiate themselves through the remainder of the fiscal year.
For readers exploring how these sector dynamics fit into the wider macroeconomic picture, our full explainer on current equity market vulnerabilities details the geopolitical and energy inflation risks that could impact overall portfolio performance in 2026.
This article is for informational purposes only and should not be considered financial advice. Investors should conduct their own research and consult with financial professionals before making investment decisions. Past performance does not guarantee future results. Financial projections are subject to market conditions and various risk factors.
The book-to-bill ratio divides the value of new orders received by the amount billed for current work, indicating a defense contractor's growth or contraction. An industry standard above 1.0x signals expansion.
Investors should assess the ratio of funded to unfunded obligations within a defense contractor's backlog, as funded obligations represent capital already appropriated by the government. High funded backlogs provide greater revenue certainty against political delays.
Parsons Corporation's stock rose because its Q1 2026 revenue drop was attributed to specific project timing, while the company reported a significantly expanded total backlog of $9.3 billion, strong book-to-bill ratio, and outperforming EPS. This indicated underlying structural health.
Risk-averse investors can gain broad sector exposure through specialized exchange-traded funds like the iShares U.S. Aerospace & Defense ETF (ITA) or the Invesco Aerospace & Defense ETF (PPA). These funds diversify capital across prime and mid-tier contractors, limiting single-contract exposure.