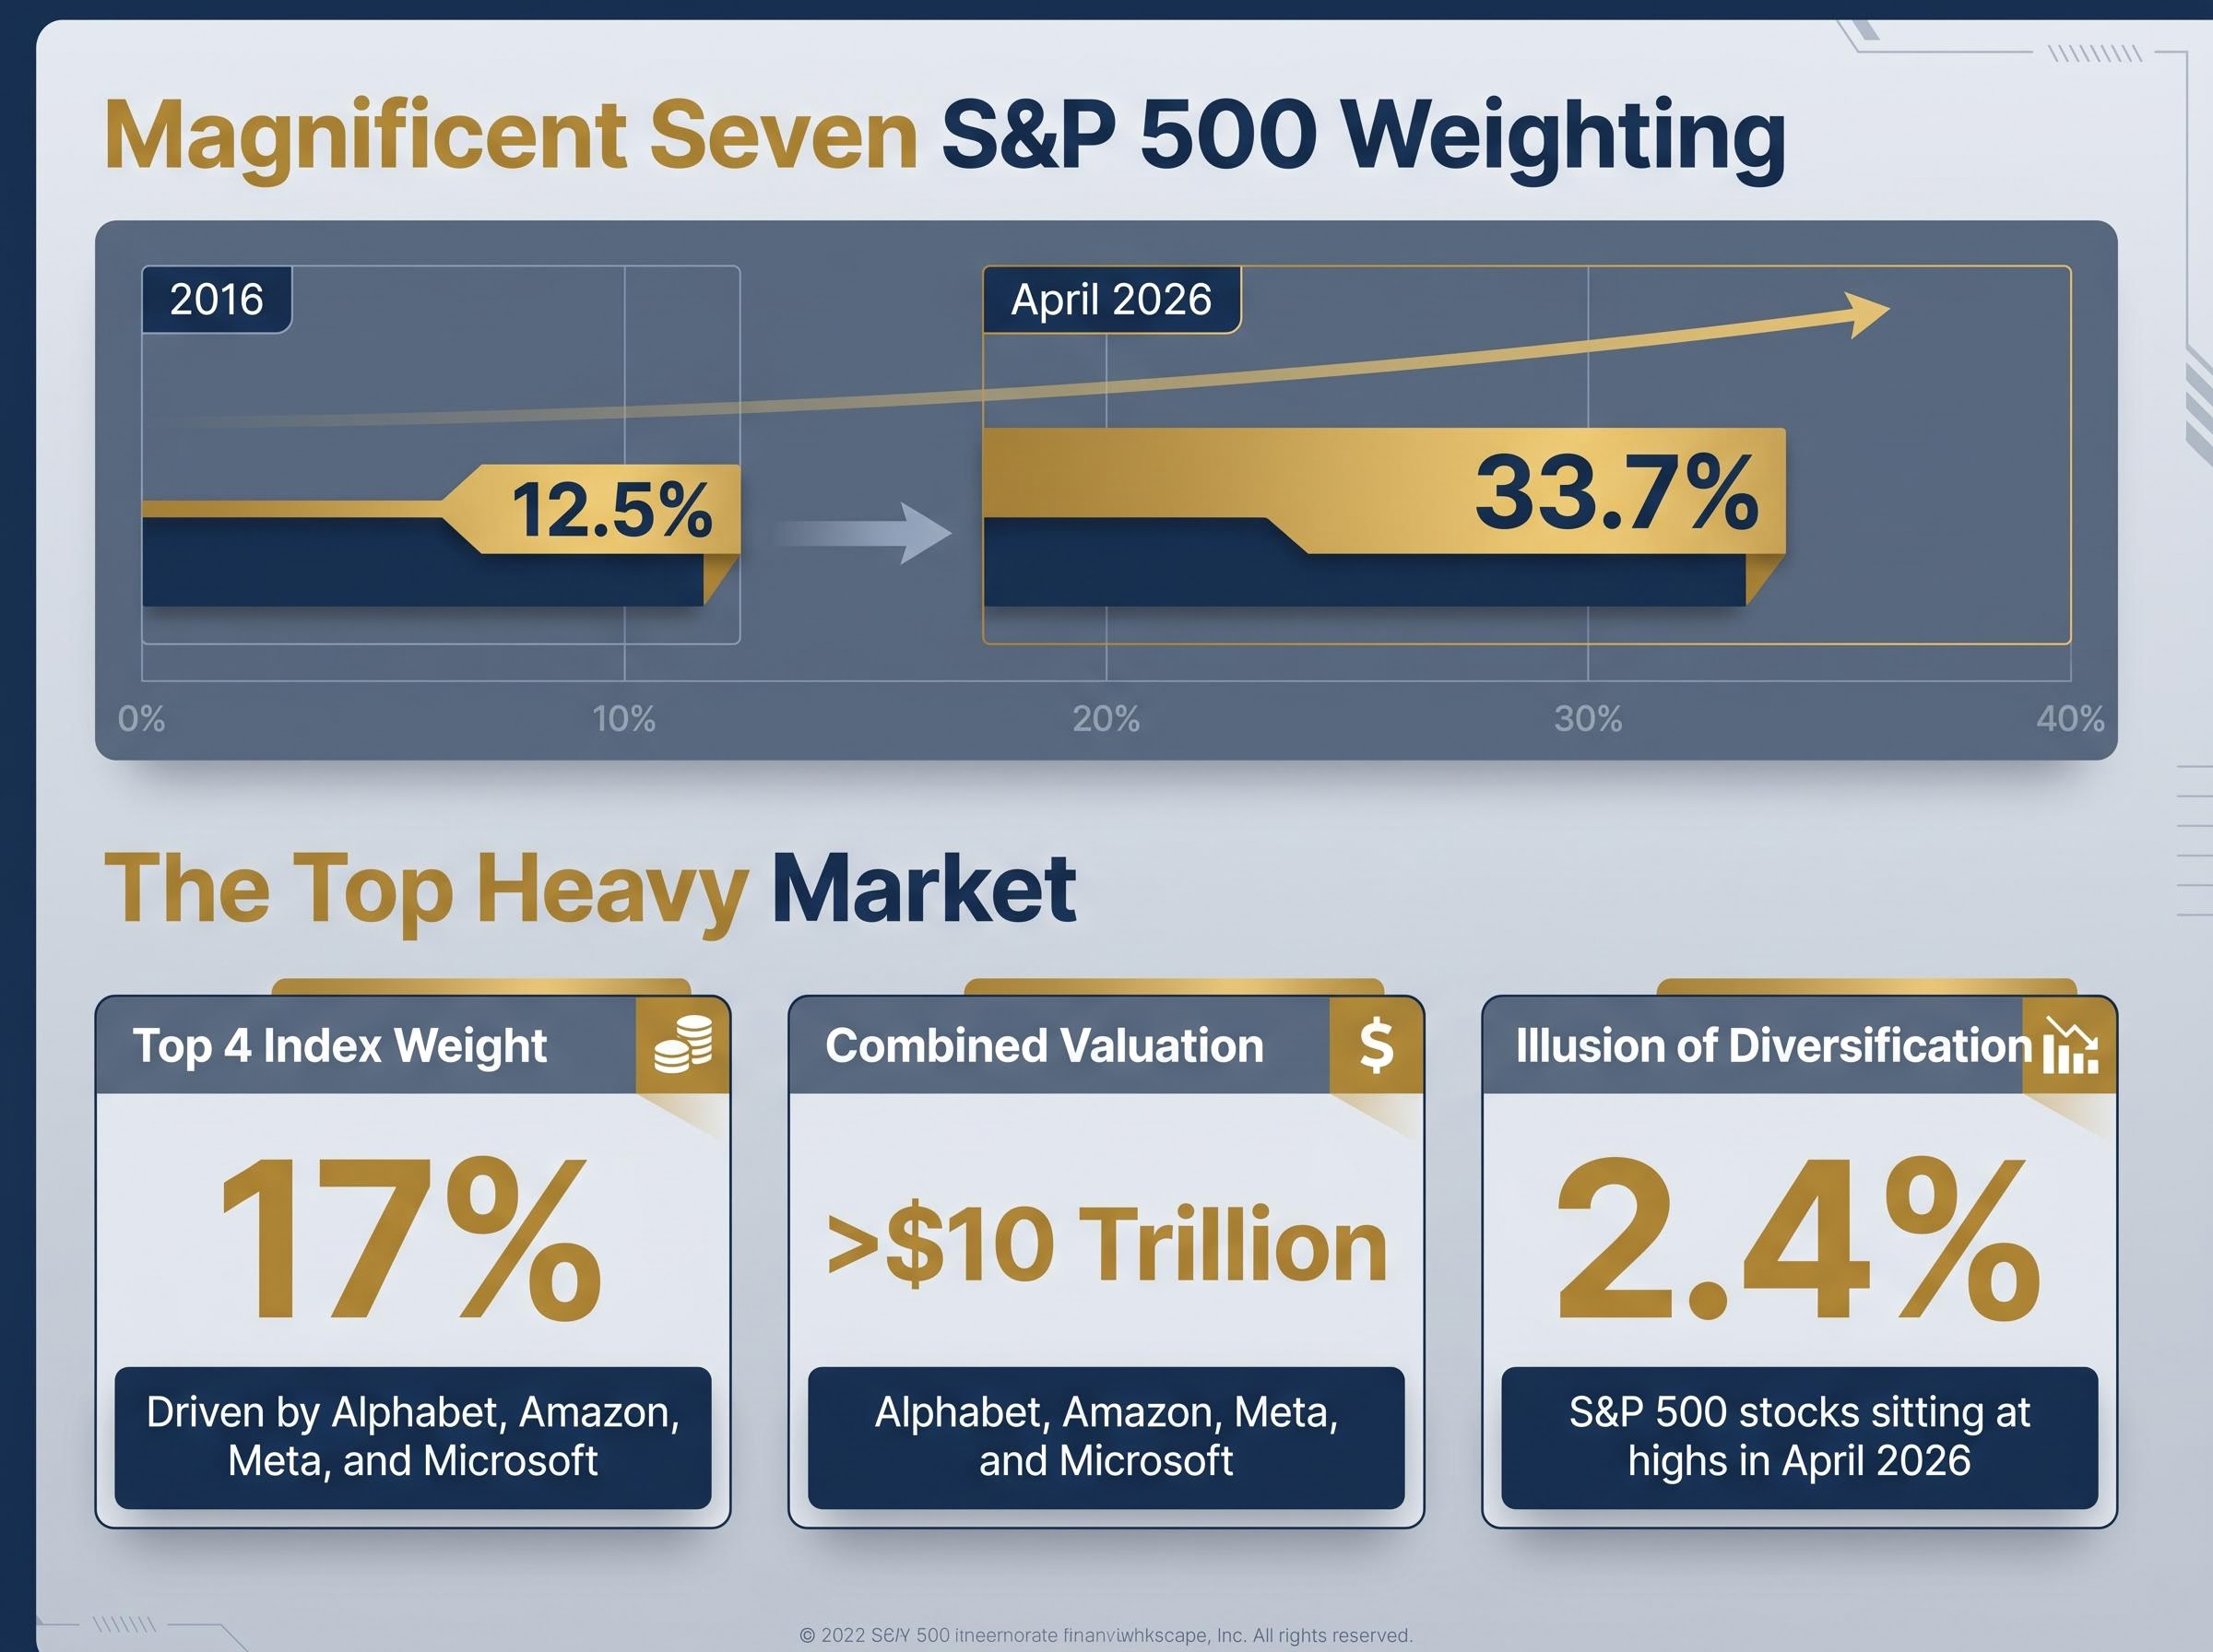
The scale of big tech market influence has fundamentally altered the mechanics of traditional equity portfolios. As of April 2026, the group of stocks known as the Magnificent Seven accounts for nearly 33.7% of the S&P 500. According to market estimates, just four major technology companies now drive 17% of the total index weight.
This intense concentration shapes the current context of the early 2026 stock market. Investors and analysts are applying unprecedented scrutiny to first-quarter earnings disclosures across the technology sector. The market has shifted its focus from abstract growth narratives to immediate financial realities, punishing companies that fail to demonstrate clear returns on their recent investments.
What follows is an explanation of how mega-cap corporate spending directly dictates broad portfolio performance. By understanding these shifting market mechanics, investors can accurately evaluate their exposure to underlying volatility and recognise why capital is rotating away from dominant technology leaders.
The Mechanics of Cap-Weighted Vulnerability
A market capitalisation-weighted index allocates representation based on the total market value of its constituent companies. When a company’s stock price rises, its share of the index expands, forcing passive funds to buy more of that specific stock. This mechanical loop turned the top tier of US technology companies into index-dominating behemoths between 2016 and 2026.
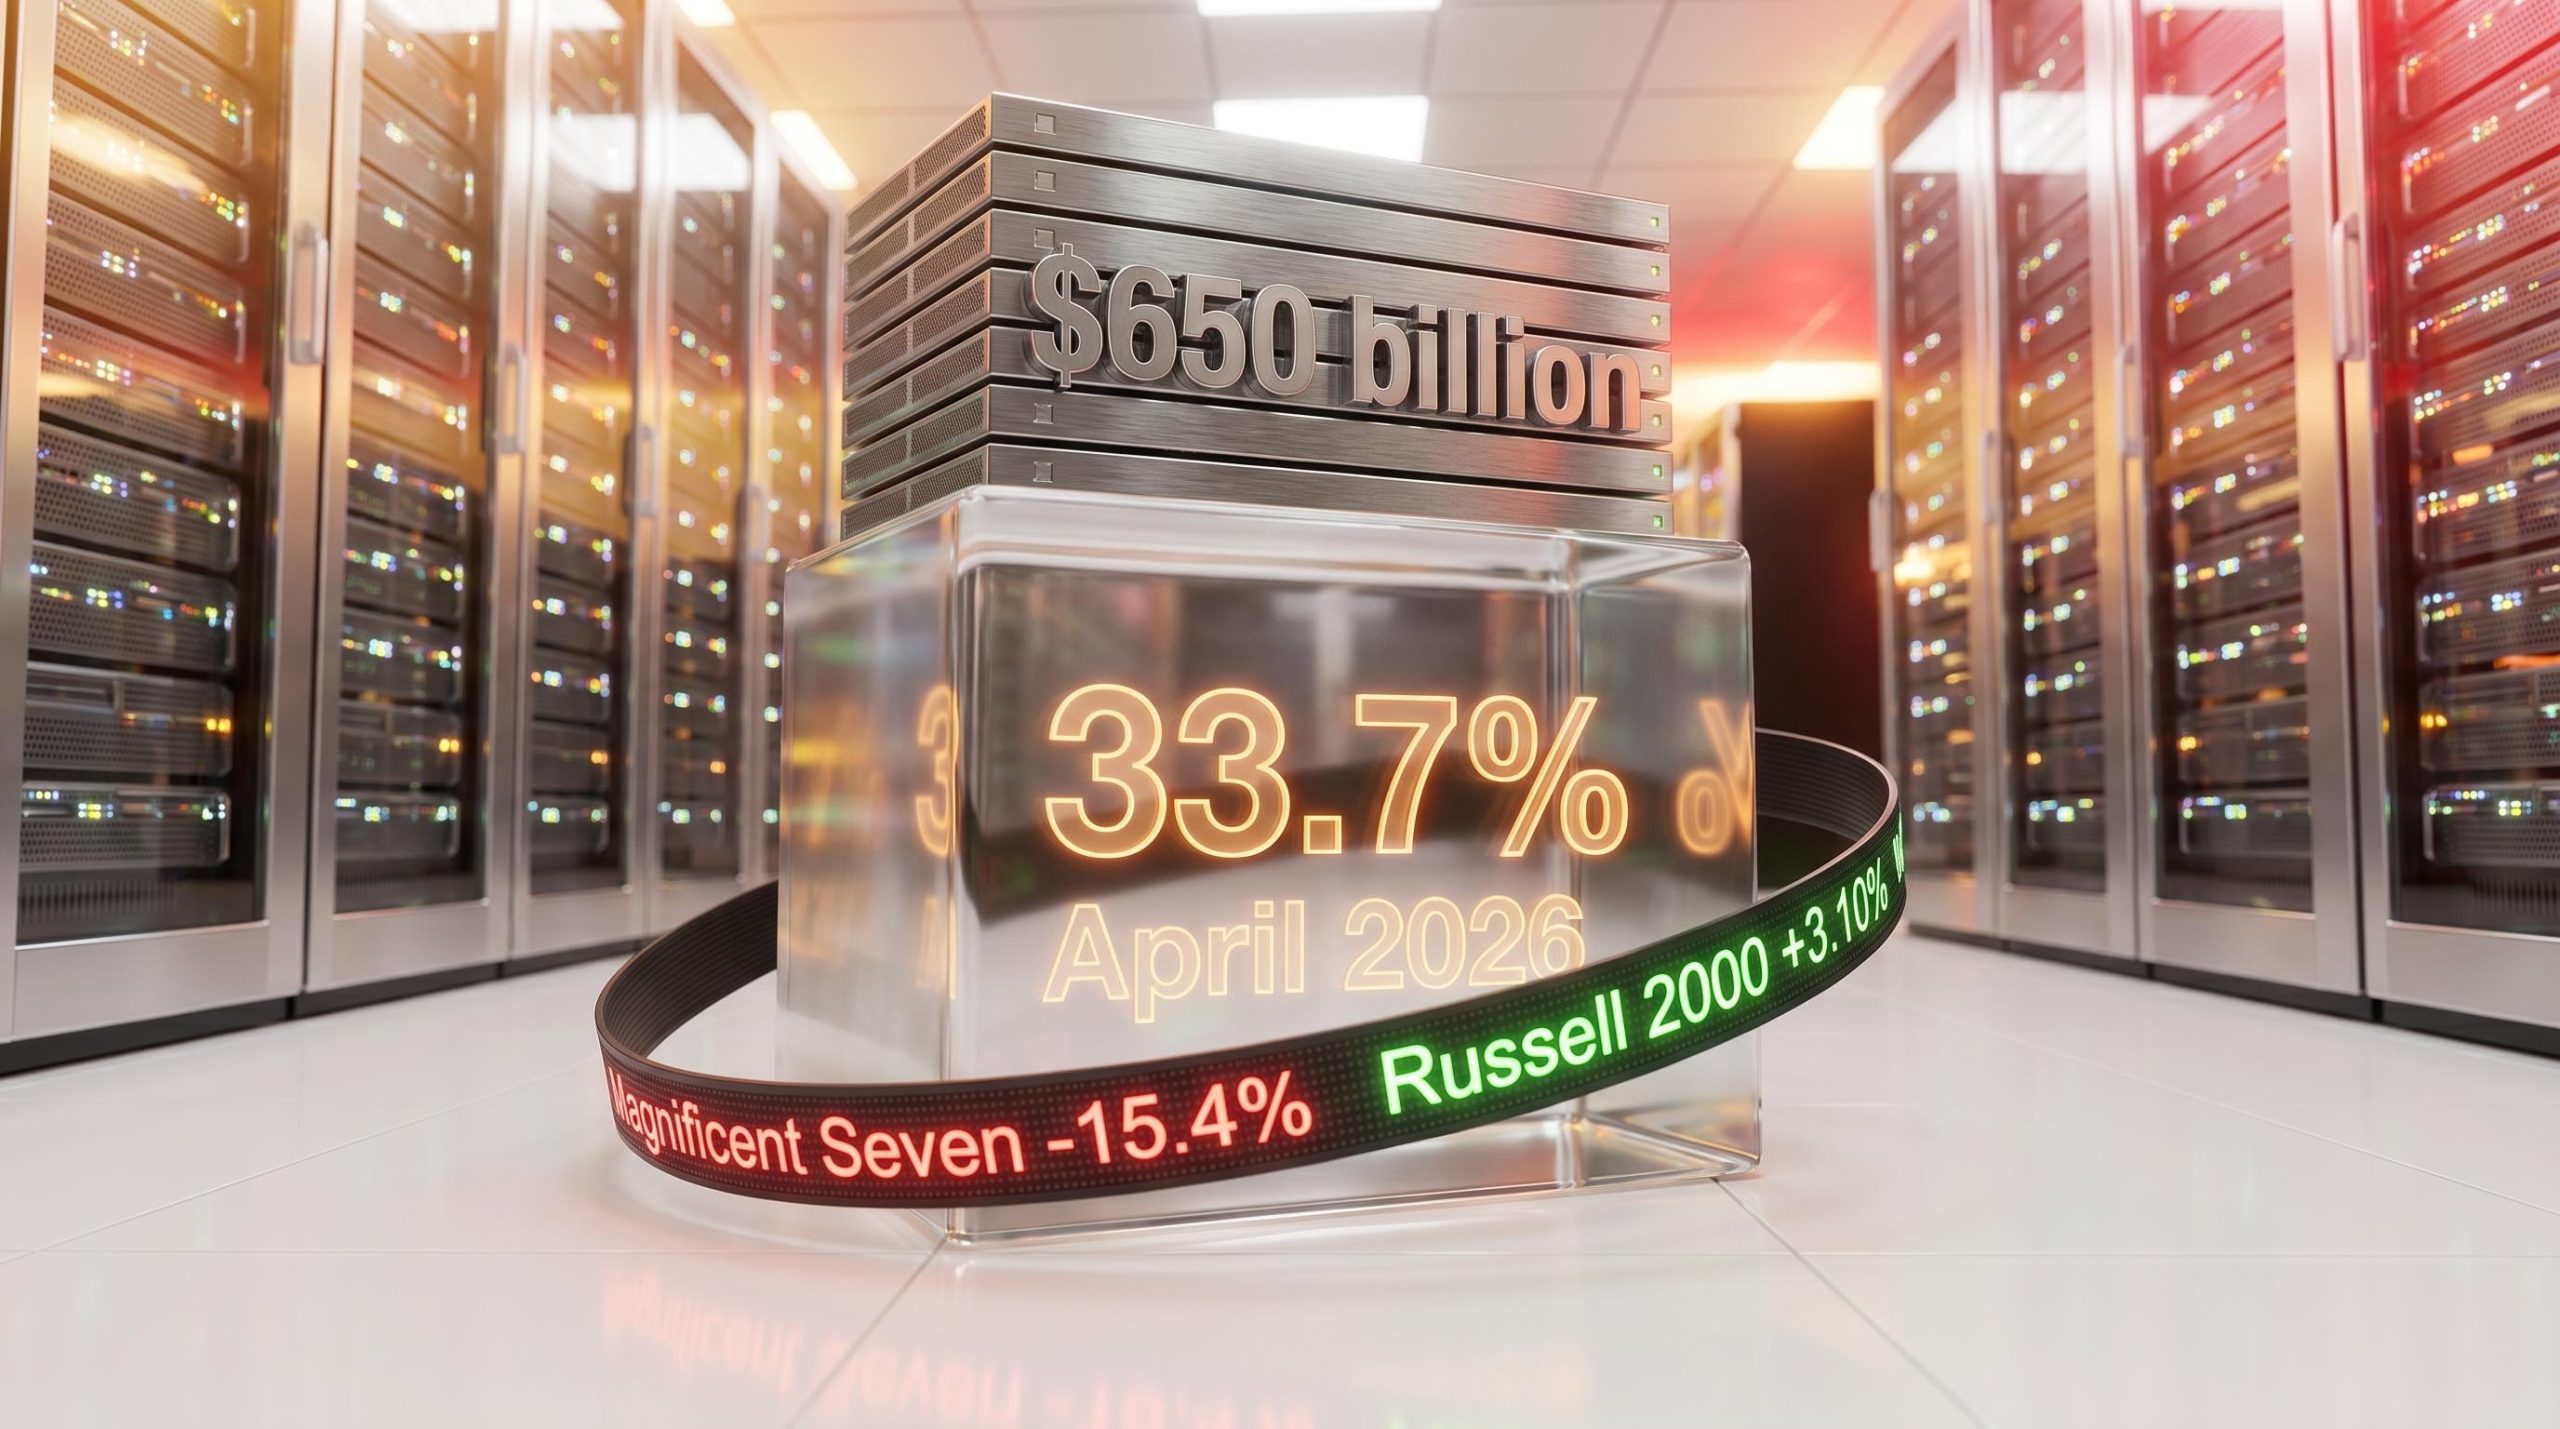
The mathematical concentration has reached historic extremes over the past decade. The weighting of the Magnificent Seven grew from 12.5% in 2016 to 33.7% by April 2026. According to market estimates, the combined market valuation of Alphabet, Amazon, Meta, and Microsoft now exceeds the $10 trillion mark, dwarfing the economic output of most nations.
Official S&P Dow Jones Indices research on sector concentration demonstrates how index providers use the Herfindahl-Hirschman Index to formally quantify this top-heavy phenomenon, confirming that current benchmark dominance is mathematically unusual.
This structure creates a significant downstream vulnerability for passive investors who assume an S&P 500 index fund provides broad diversification. Buying the broader market now essentially means buying a concentrated portfolio of technology hardware and software providers. This facade of diversification became evident during market rallies in April 2026, when statistical data revealed that only 2.4% of S&P 500 stocks were actually sitting at their highs.
The mechanism by which a single mega-cap stock dictates broader fund performance follows a specific mathematical sequence:
- Valuation Dominance: A single technology giant accounts for a disproportionate percentage of a cap-weighted index, establishing an outsized baseline influence.
- Amplified Drawdowns: When that specific stock experiences a sharp price decline following an earnings miss, the entire index sheds significant points regardless of how the remaining hundreds of companies perform.
- Forced Selling Pressure: Passive funds must automatically rebalance their holdings to track the declining index, triggering algorithmic sell orders that drag down the broader market ecosystem.
When big ASX news breaks, our subscribers know first
The AI Infrastructure Spending Cliff
Artificial intelligence investment is no longer viewed by Wall Street as an automatic growth driver. It has transitioned into a massive financial burden that demands immediate revenue validation. This marks a structural shift away from the patience investors exhibited throughout the prior two years.
The primary catalyst disrupting technology dominance is the unprecedented capital expenditure required to build and maintain artificial intelligence infrastructure. Analysts describe this current environment as the “capex cliff”. Market tolerance is rapidly wearing thin after years of aggressive corporate spending without proportional, near-term revenue growth.
Failure to show returns on these data centre investments penalises the hyperscalers and the entire ecosystem of hardware vendors. The financial outlays required to sustain these artificial intelligence models are fundamentally altering corporate profit margins across the sector.
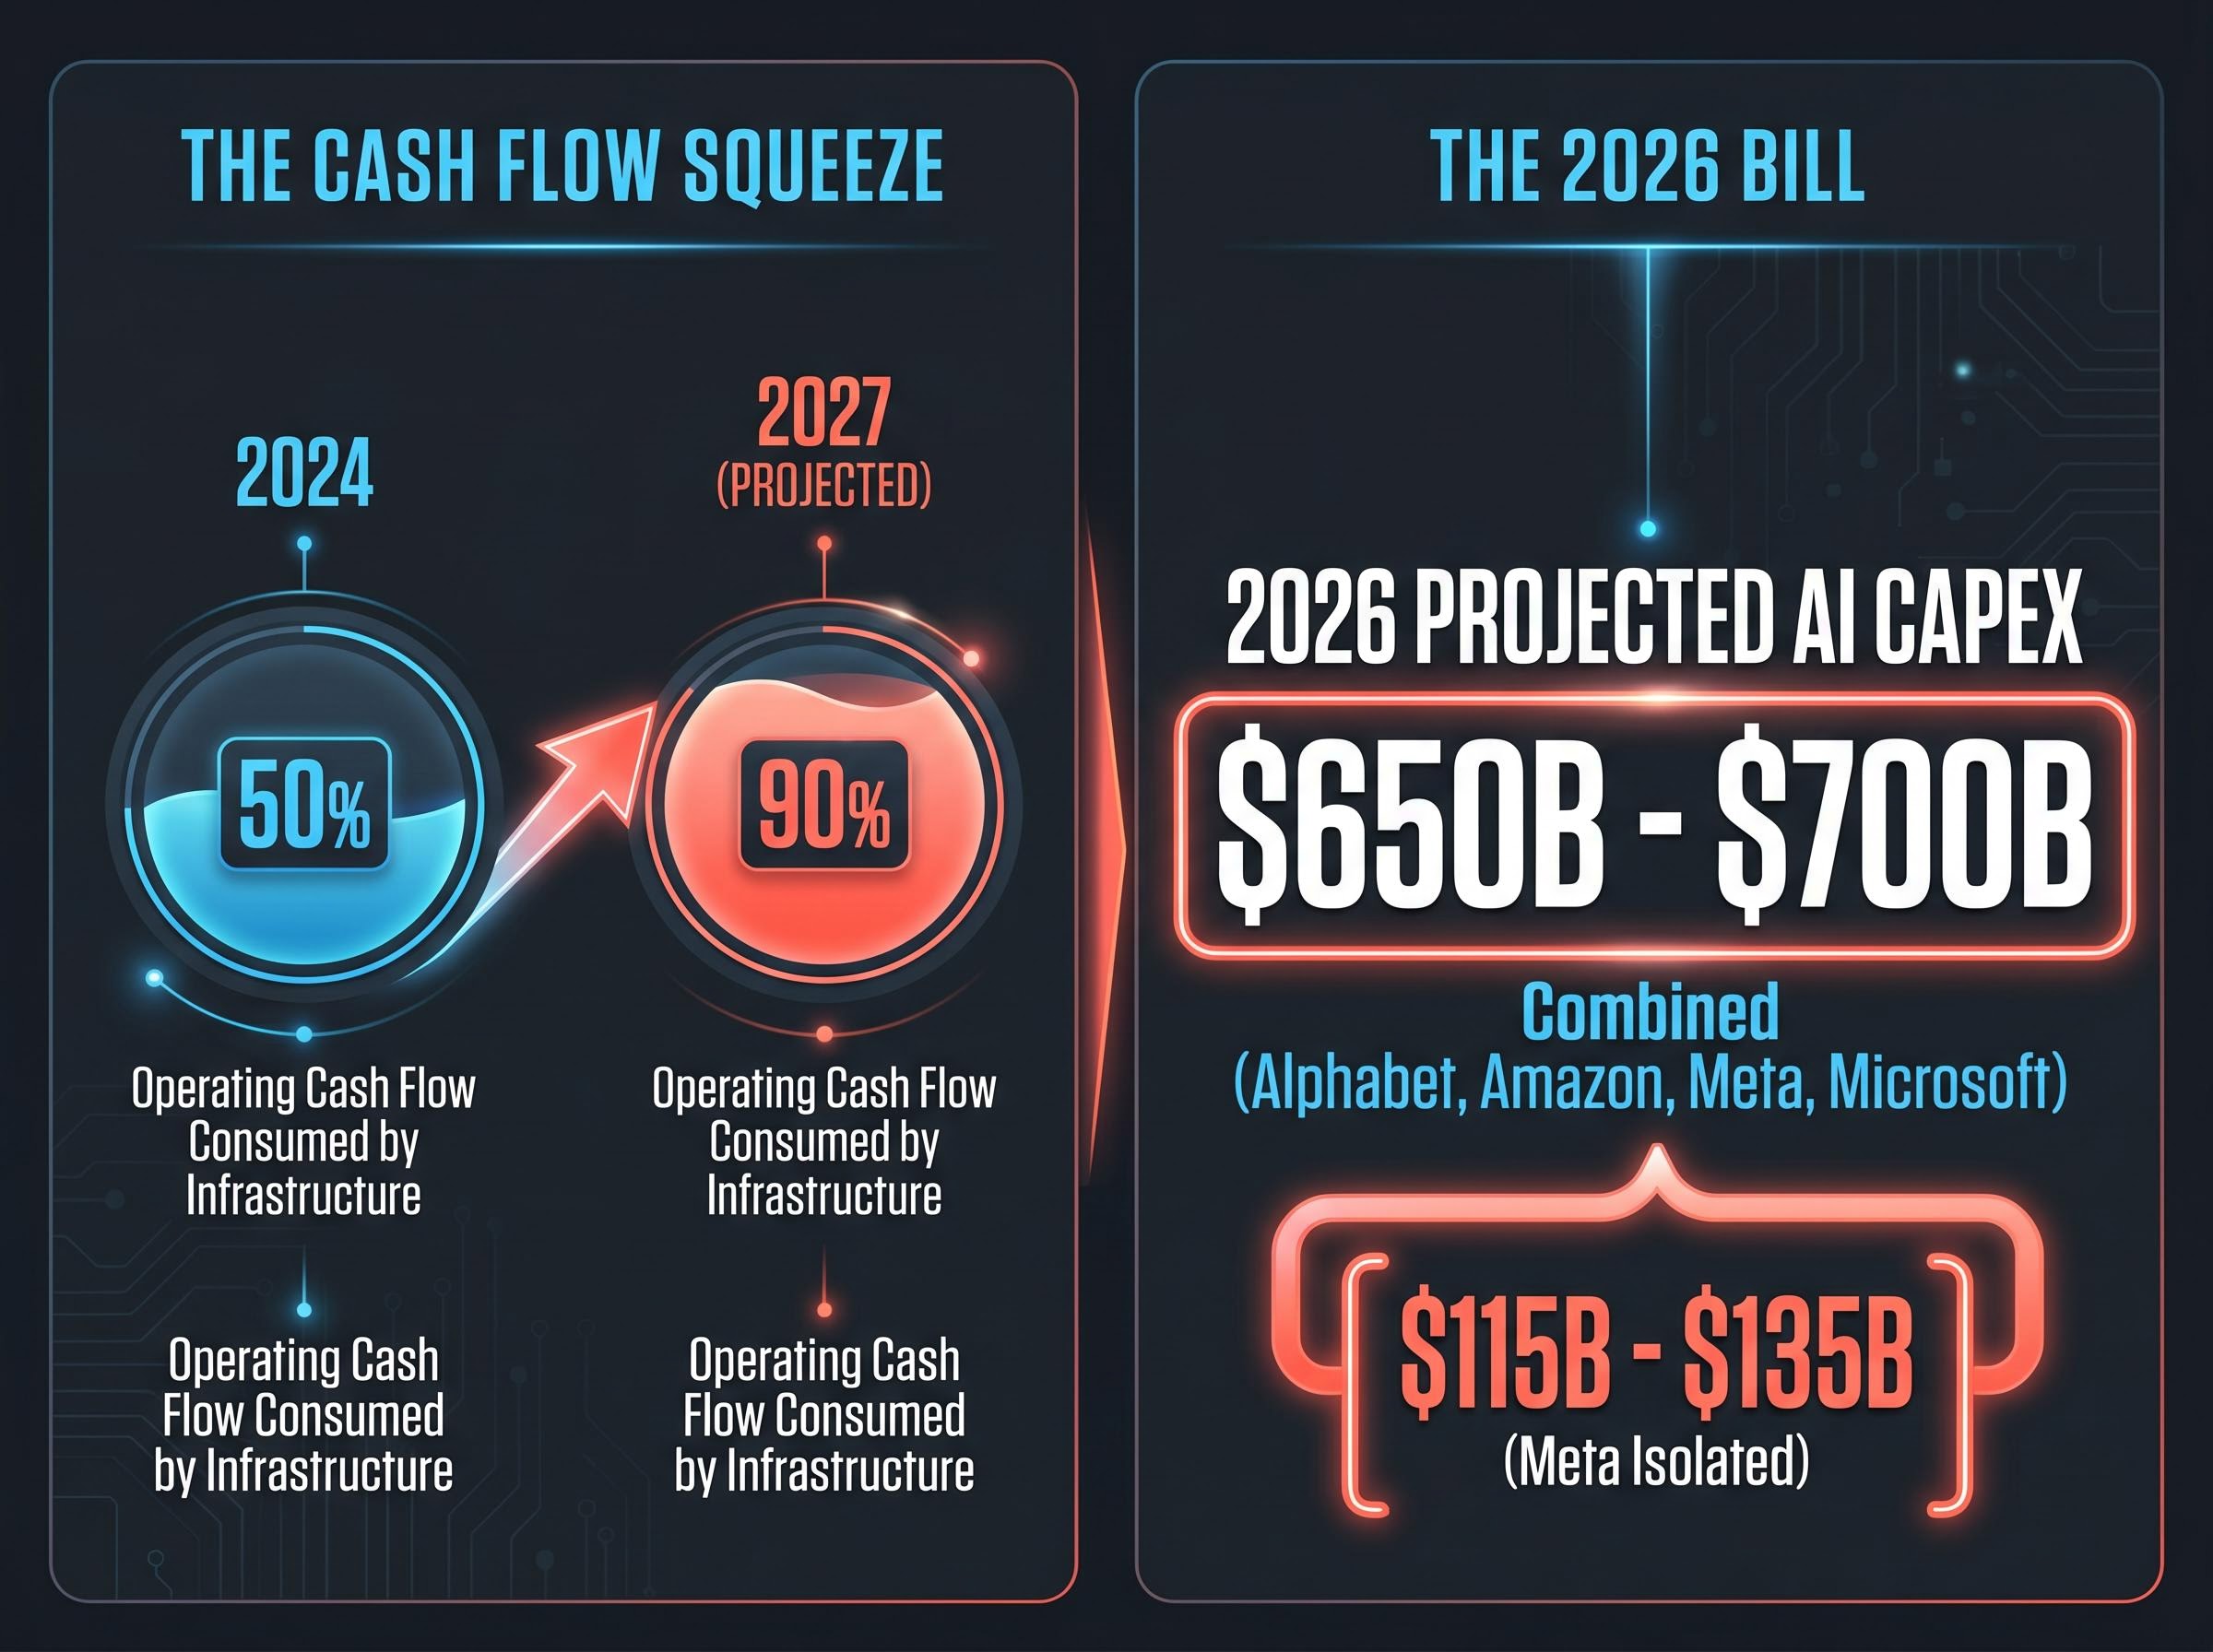
Alphabet, Amazon, Meta, and Microsoft face a combined projected artificial intelligence capital expenditure of $650 billion to $700 billion for 2026. Meta carries an isolated capital expenditure estimation of $115 billion to $135 billion for 2026 alone. * According to some estimates, industry forecasts project infrastructure investments will consume nearly 90% of operating cash flow for major tech firms by 2027, a steep increase from 50% in 2024.
“Market consensus indicates that Wall Street will only tolerate heavy infrastructure spending without corresponding revenue growth before applying severe valuation penalties.”
Shifting Timelines for Corporate Returns
Technology leaders face intense timeline pressures from institutional shareholders who demand near-term cash flow transparency. The 2024 narrative of limitless long-term potential has been entirely replaced by a requirement for verifiable quarterly returns.
If these companies cannot demonstrate that their capital expenditures are generating proportional top-line revenue, their historic valuations become mathematically unsupportable. This tension forces technology executives to justify their infrastructure spending on every earnings call, fundamentally changing how the market prices future innovation.
For investors exploring how this $650 billion spending pipeline filters down to hardware suppliers, our deep-dive into AI infrastructure capital expenditures details the specific cloud monetization metrics and semiconductor valuations driving the current market cycle.
Dissecting the Early 2026 Sector Rotation
Between late 2025 and April 2026, capital actively fled the Magnificent Seven toward value sectors like Utilities, Energy, and Industrials. This movement, widely referred to as the Great Rotation, was not a random market fluctuation. It was a logical, mathematically driven reallocation of funds away from overvalued technology assets.
Traditional indicators measuring this industrial sector market divergence show that a healthy bull market requires confirmation across transportation and manufacturing benchmarks, a signal that remains notably absent in the current environment.
The differing performance of large-cap technology indices versus small-cap and value-oriented benchmarks during this period illustrates the severity of the rotation. The Magnificent Seven composite experienced a significant drawdown, falling from $65 to $55, which represented a 15.4% year-to-date decline by late March 2026.
In stark contrast, the Russell 2000 Index gained 3.10% year-to-date, absorbing the capital that was exiting the technology sector. The Russell 1000 Growth Index fell 7.80% over the same period, confirming that the rotation was specifically targeting growth premiums. Interestingly, this stock price rotation occurred despite net income for the Magnificent Seven still being projected to grow 25% in 2026, compared to an 11% growth estimate for the remaining S&P 493.
| Index or Composite Focus | Year-to-Date 2026 Performance | 2026 Projected Profit Growth |
|---|---|---|
| Magnificent Seven Composite | -15.4% | +25.0% |
| Russell 1000 Growth Index | -7.80% | Sector Dependent |
| Russell 2000 Index (Small-Cap) | +3.10% | Broader Economic Alignment |
| S&P 493 (Excluding Mag 7) | Positive Inflows | +11.0% |
The Catalyst of AI Fatigue
External shocks accelerated this reallocation of funds, heavily driven by investor fatigue regarding artificial intelligence promises. The “DeepSeek Shock” in early 2026, where highly efficient open-source models successfully challenged proprietary systems, disrupted the perceived competitive moats of US technology firms.
This technological disruption validated the growing institutional fear that massive infrastructure spending might not secure long-term market dominance. Further validating these concerns, Cisco and Nvidia both delivered signals in February 2026 that enterprise-level spending on technology upgrades was actively cooling.
Pricing Turbulence in the Derivatives Market
The derivatives market functions as a real-time fear gauge ahead of major financial disclosures, allowing institutional traders to anticipate shockwaves before earnings hit the wire. Options pricing reveals exactly how much volatility the market expects from a specific stock following its quarterly report.
Implied volatility represents the options market’s expectation of future price movement, whereas historical volatility measures how much a stock has actually moved in the past. When implied volatility exceeds historical trading patterns, it signals that institutions are paying high premiums to protect against an unusually large price swing.
The Federal Reserve Financial Stability Report identifies these elevated option-implied volatility levels as a key indicator of systemic vulnerability, noting that sudden shifts in mega-cap valuations could trigger wider market disruptions.
Current options pricing suggests Wall Street is bracing for significant post-earnings turbulence that completely diverges from typical cyclical behaviour. Elevated options pricing across first-quarter 2026 earnings stems directly from widespread uncertainty surrounding the sustainability of tech valuations.
Implied Versus Historical Market Moves
Traders are currently paying steep premiums for downside protection on major technology holdings. Options contracts suggest steep 7% implied moves for certain Magnificent Seven stocks, indicating traders are locking in expectations of above-average earnings volatility overall. Conversely, derivatives pricing indicates a potential price shift for Amazon.
This divergence presents a specific risk to retail investors holding these underlying equities. If actual financial results cause these stocks to breach their derivative-implied boundaries, market makers will be forced to dynamically hedge their positions, potentially triggering rapid, cascading price gaps that passive investors cannot avoid.
Redefining Portfolio Balance for the 2026 Landscape
The central tension in the current equity market exists between record corporate earnings projections and the immediate punishment of capital-intensive infrastructure spending. Institutions are demanding immediate returns on capital, actively reallocating funds when technology leaders fail to deliver.
This environment reiterates that the era of passive, set-and-forget index investing carries distinct new risks. When a handful of companies dominate the benchmarks, buying an index fund exposes the investor to the concentrated volatility of a single sector’s spending cycle. Everyday investors must evaluate their true exposure to mega-cap volatility by looking past the label of broad diversification and examining the underlying mathematical weighting of their holdings.
With elevated recession probability estimates from major financial institutions reaching nearly 50 percent, unmanaged index exposure leaves passive investors fully vulnerable to both concentrated technology shocks and broader economic contractions.
Looking forward, the market will eventually reconcile corporate artificial intelligence investments with real-world revenue generation. Until that equilibrium is reached, capital will likely continue rotating toward sectors that offer immediate cash flow and traditional valuations, bypassing the structural risks embedded in cap-weighted technology indices.
This article is for informational purposes only and should not be considered financial advice. Investors should conduct their own research and consult with financial professionals before making investment decisions. Past performance does not guarantee future results. Financial projections are subject to market conditions and various risk factors.