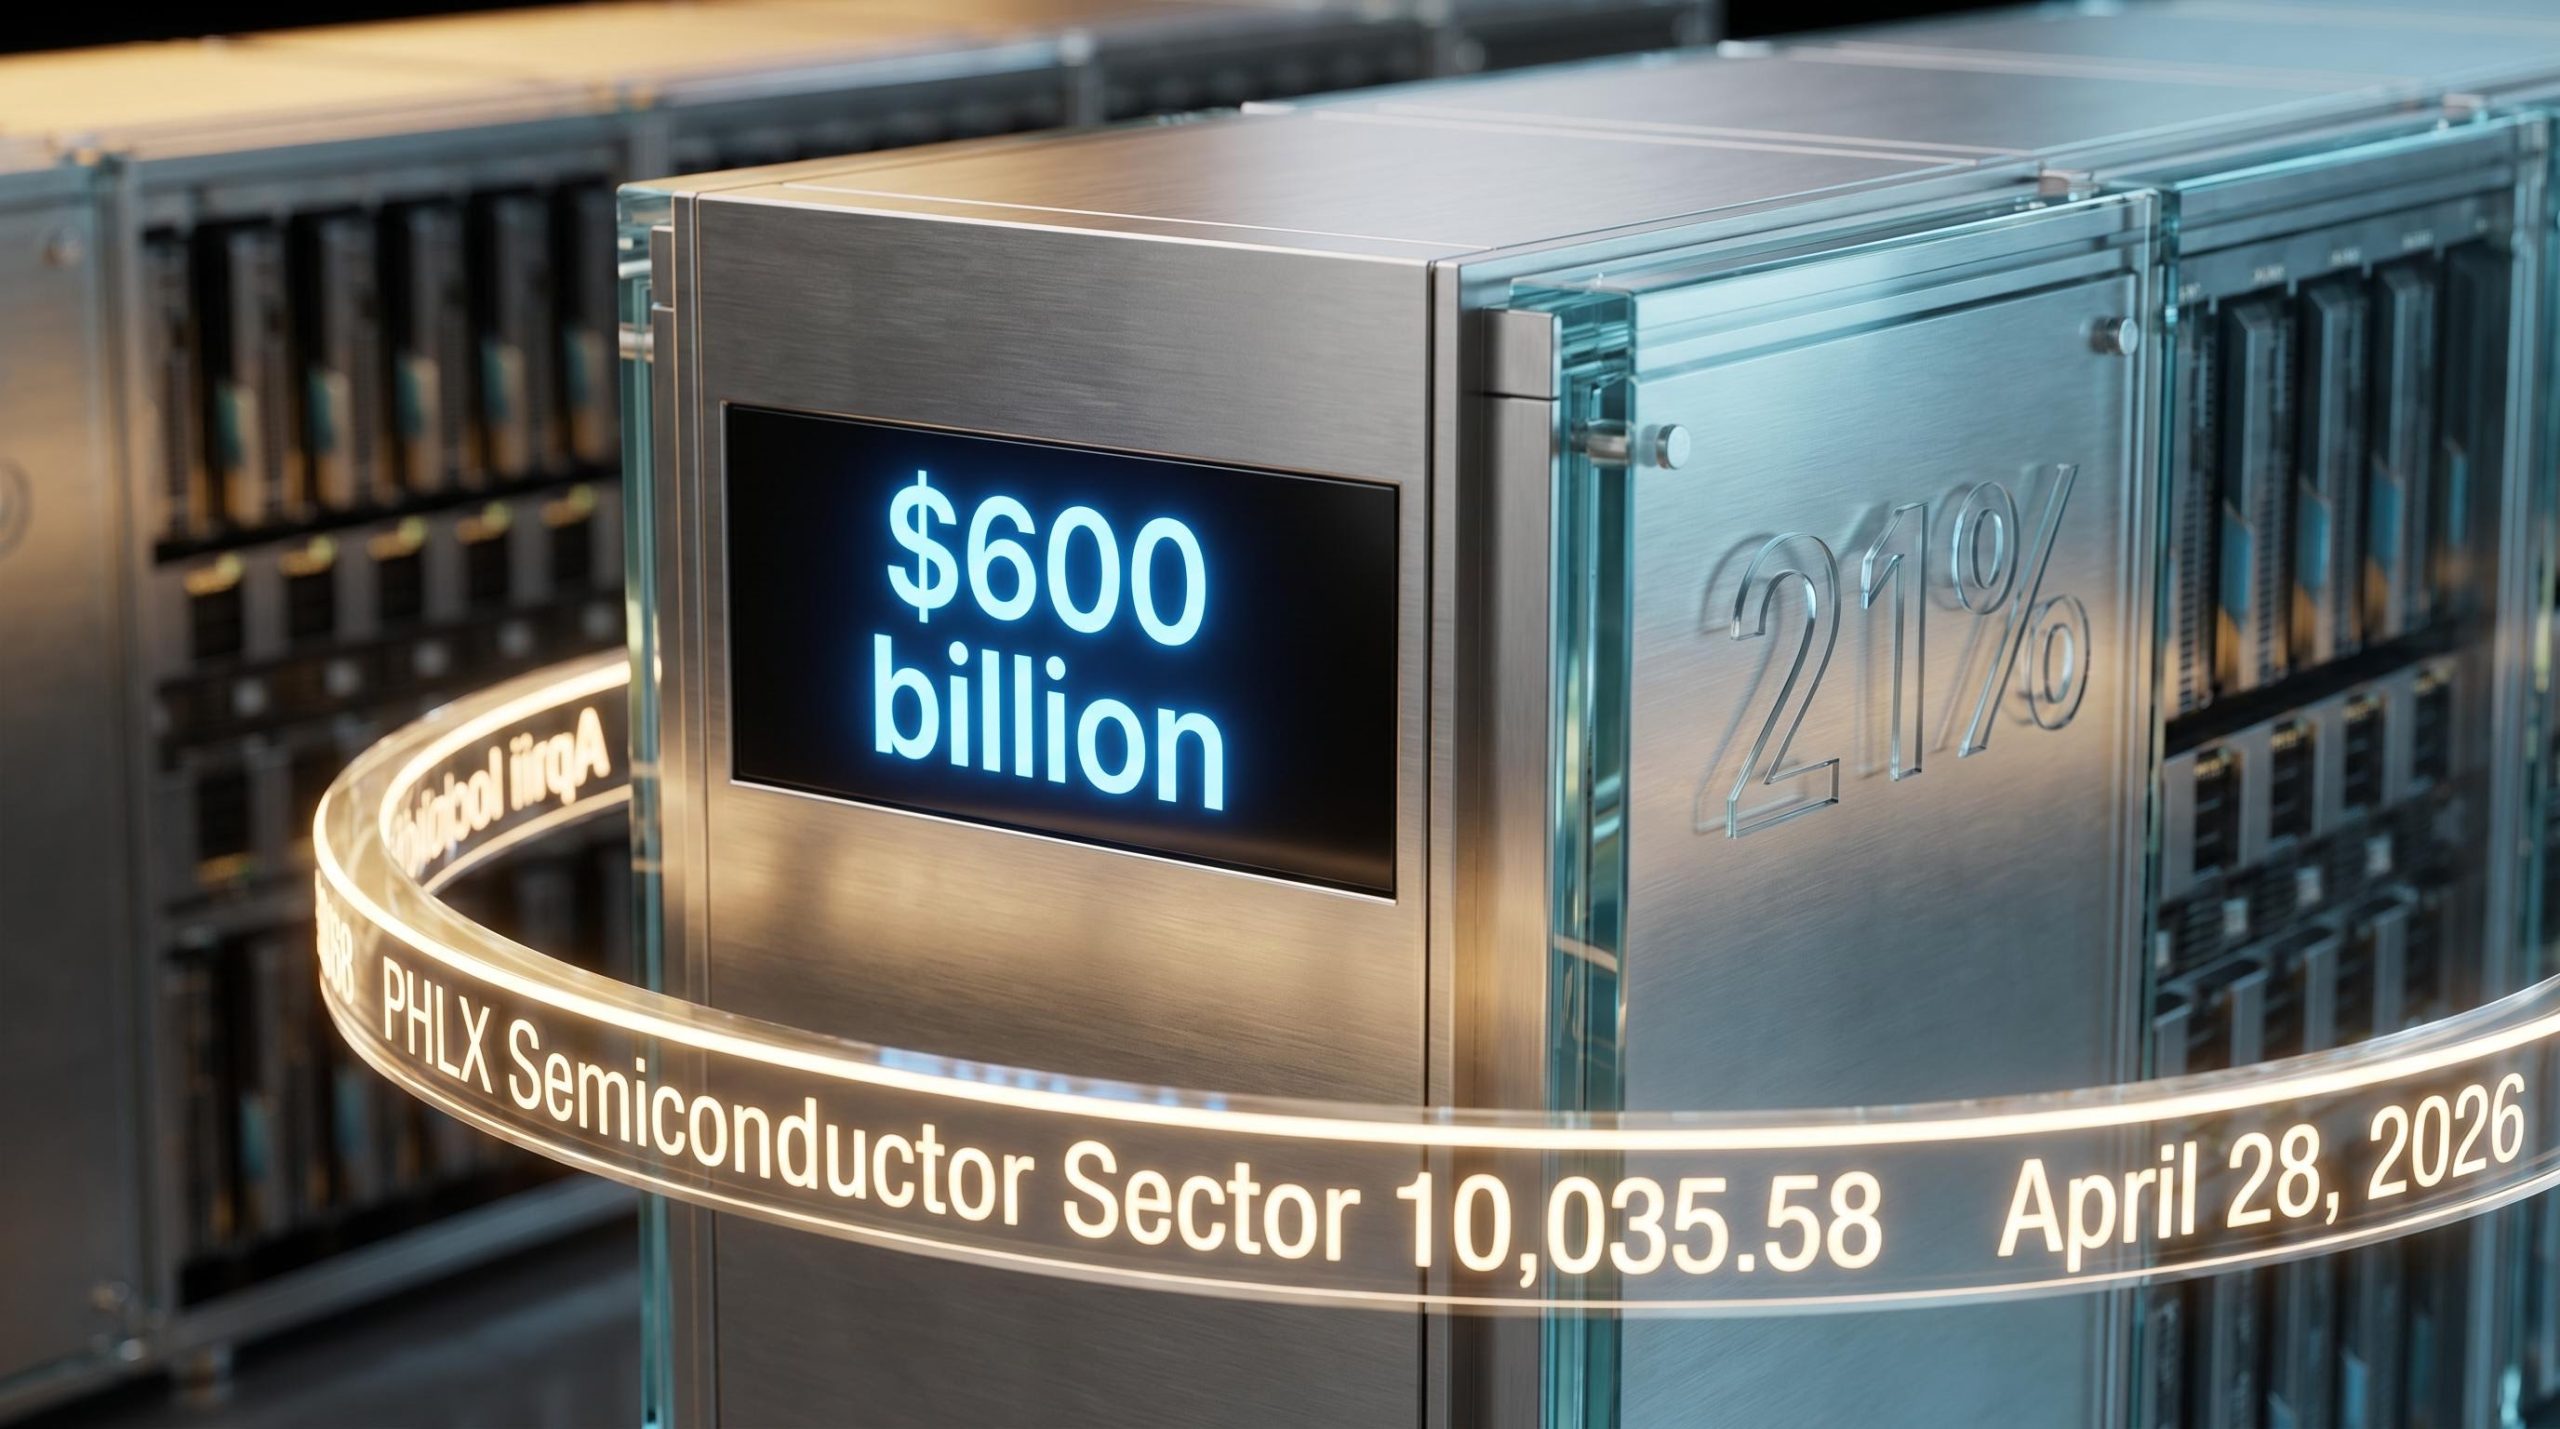
Four major technology firms now control roughly 21% of the entire S&P 500 index, and their collective decision to spend upwards of $600 billion on digital facilities in 2026 is single-handedly dictating broad market trajectories. Following the Q1 2026 earnings disclosures in late April 2026, Wall Street analysts received staggering upward capital expenditure revisions from hyperscalers including Amazon, Alphabet, Microsoft, and Meta.
This AI infrastructure investment as a strategic corporate outlay now eclipses traditional macroeconomic indicators in its ability to move equities. The gap between the scale of this capital allocation and the market’s broader understanding of its supply chain mechanics reveals a critical vulnerability for passive investors.
This analysis unpacks the mechanics behind these unprecedented capital commitments and evaluates how this spending flows directly into semiconductor equities. It also provides investors with a framework to assess the sustainability of this cycle, mapping the exact catalysts required to maintain current valuation multiples.
Mapping the Historic Scale of 2026 Capital Expenditures
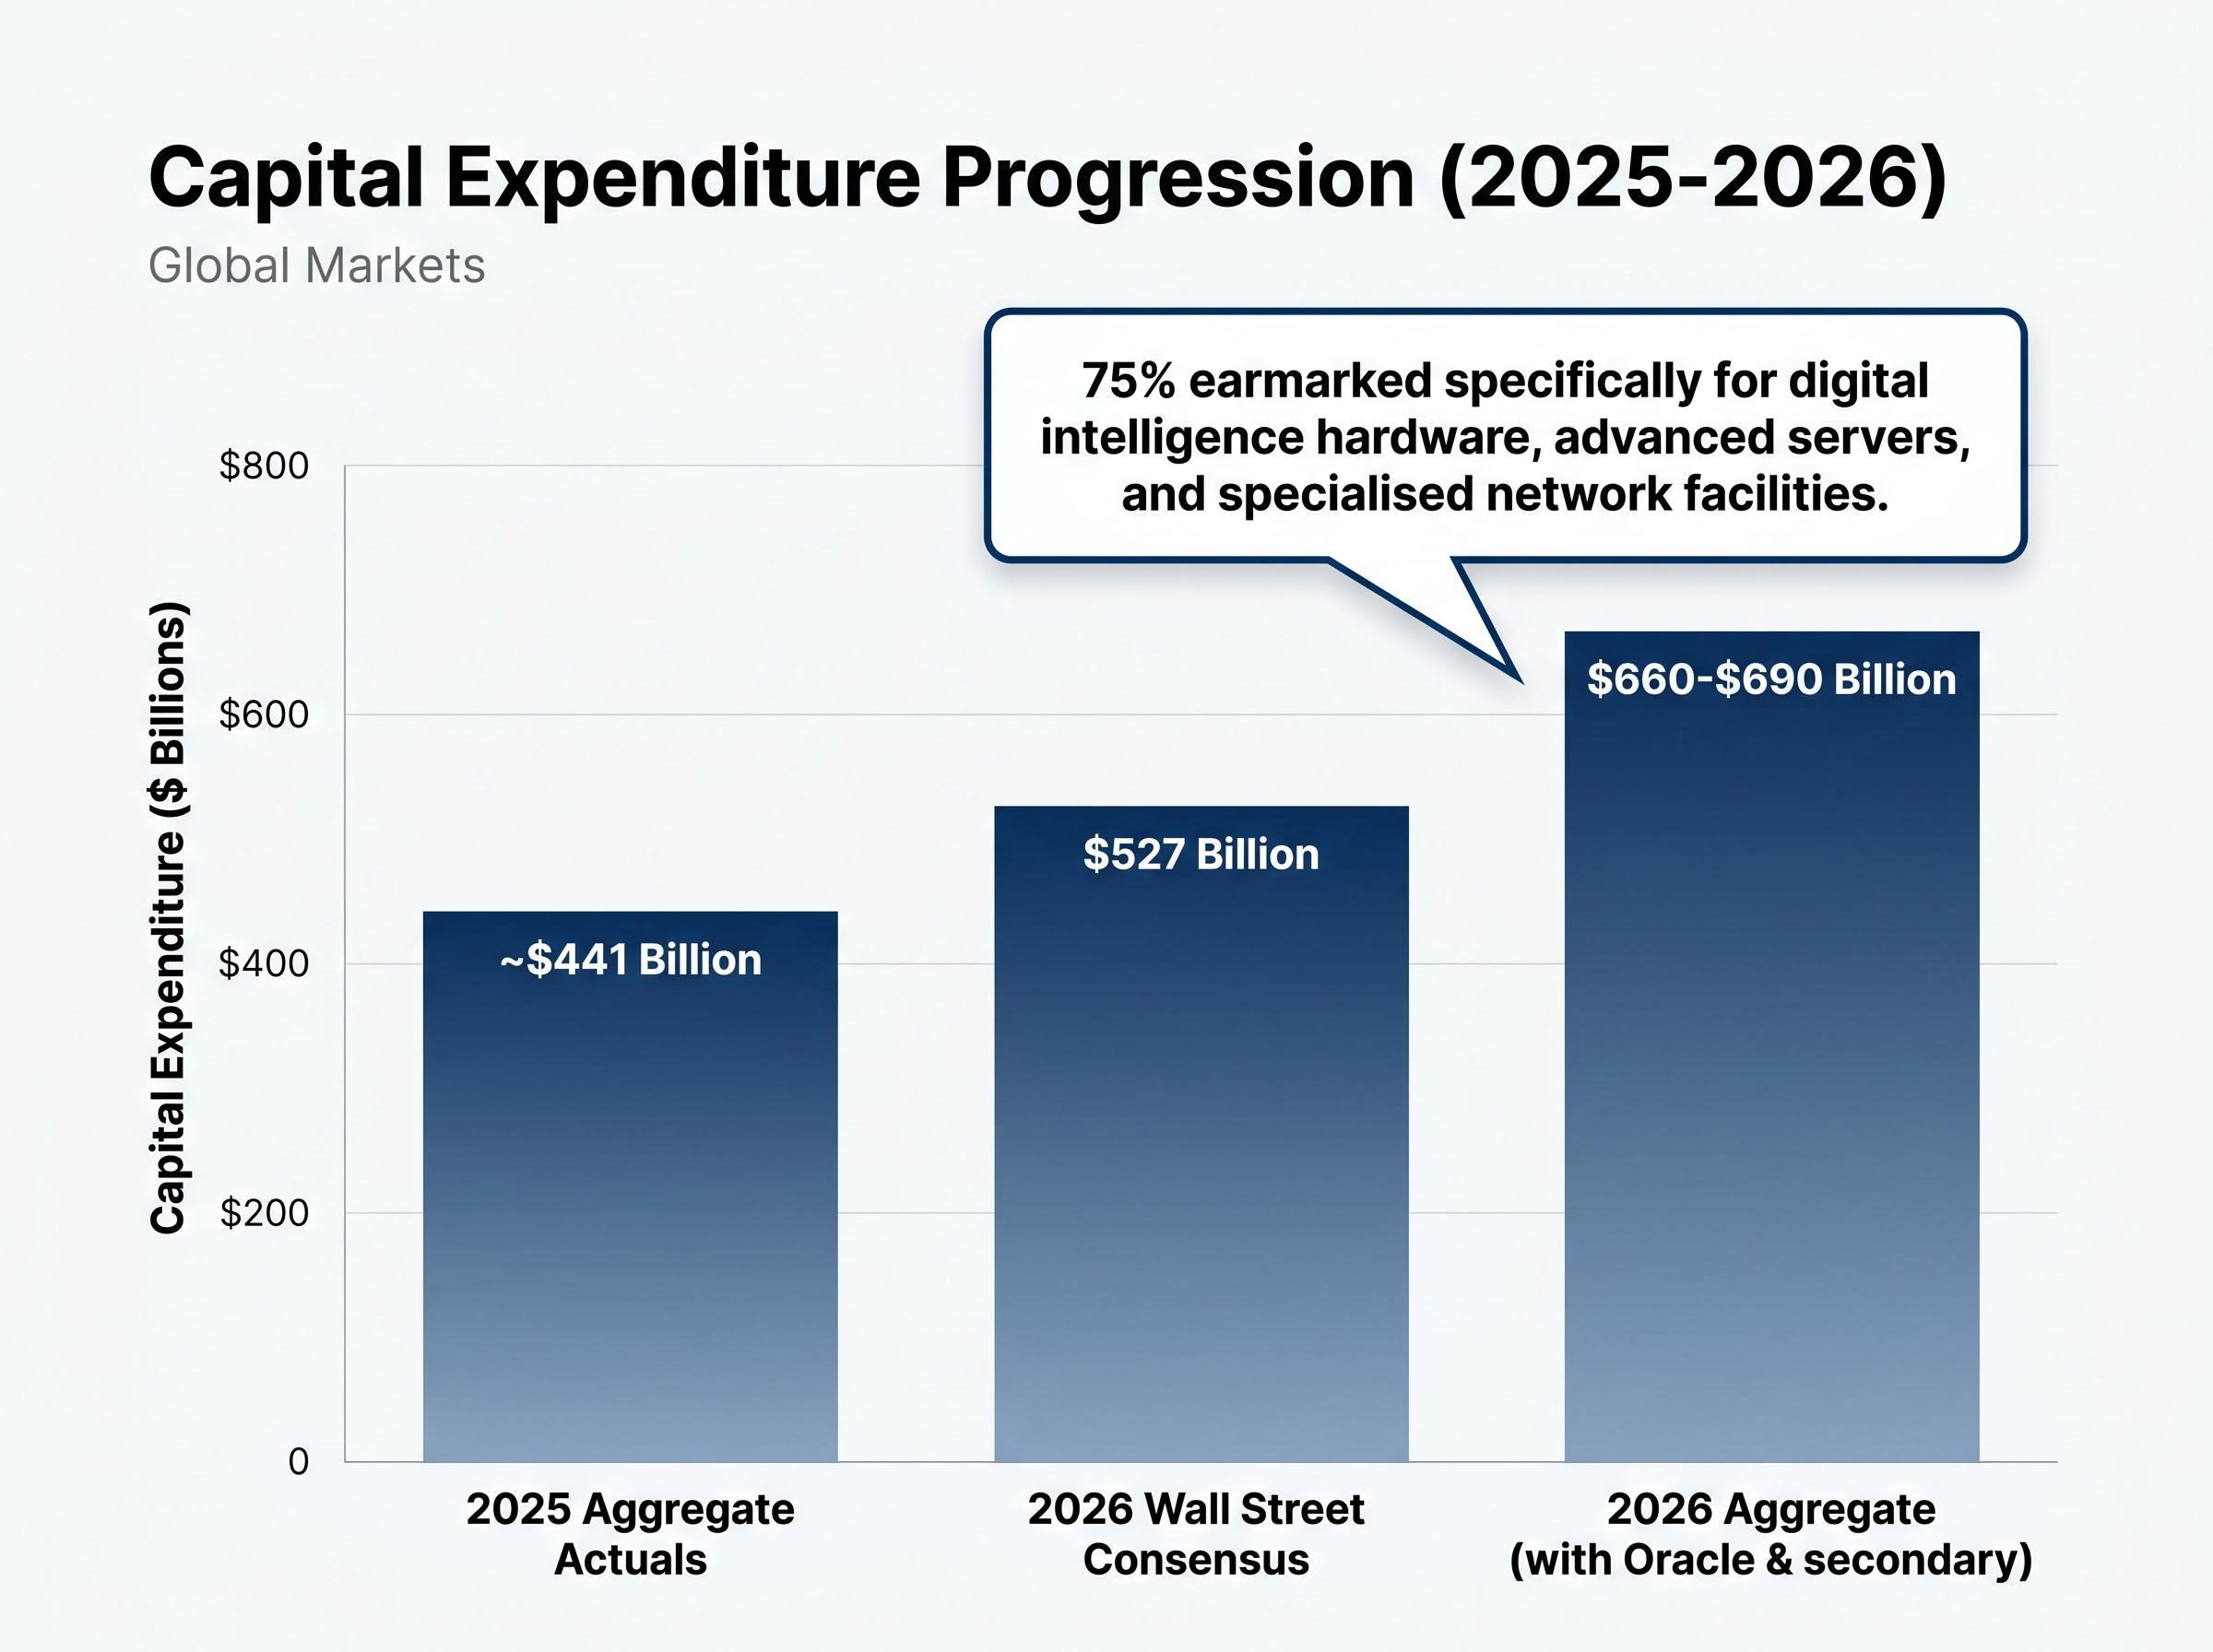
The sheer magnitude of the financial commitments reveals a rapid acceleration curve that requires historical context to fully comprehend. Wall Street consensus for hyperscaler capital expenditures jumped to $527 billion recently, marking a sharp upward revision from the $465 billion projected prior to the Q3 2025 reporting period. When incorporating broader supply chain data and commitments from secondary providers like Oracle, aggregate planned outlays reach $660-$690 billion for 2026.
The Goldman Sachs data centre expenditure projections illustrate how this aggressive acceleration in infrastructure spending outpaces previous technology cycles by an order of magnitude.
These projections sit in stark contrast to the baseline 2025 aggregate actuals of approximately $441 billion. Industry analysis indicates that roughly 75% of this newly expanded aggregate spend is earmarked specifically for digital intelligence hardware, advanced servers, and specialised network facilities. The capital is not distributed evenly across general business operations.
| Hyperscaler | 2025 Estimated Capex | 2026 Projected Capex | Primary Spending Focus |
|---|---|---|---|
| Amazon | Unavailable | $200 billion | Data centres and compute clusters |
| Alphabet | Unavailable | $175-$185 billion | Advanced servers and infrastructure |
| Meta | Unavailable | $115-$135 billion | Digital intelligence hardware |
| Microsoft | Unavailable | $120 billion+ | Network facilities and servers |
Investors must grasp the absolute scale of these outlays because this capital is the primary engine driving US market liquidity today. This concentrated spending dictates corporate earnings expectations across the technology sector for the next 24 months.
When big ASX news breaks, our subscribers know first
Demystifying the Pipeline: How Infrastructure Spending Moves the Market
A foundational understanding of corporate accounting is required to track how these massive figures move from corporate guidance into the actual economy. Operating expenses cover day-to-day business costs, while capital expenditures represent long-term investments in physical assets and infrastructure. According to industry estimates, financial forecasts show infrastructure outlays expanding from roughly half of hyperscaler operating cash flow in 2024 to approximately 90% by 2027.
This shift transforms technology giants into heavy-asset industrial spenders. The capital pipeline moves in three distinct mechanical stages that create predictable secondary investment opportunities.
Budget Allocation: Hyperscalers officially commit capital to specific infrastructure categories, triggering forward guidance updates. Supply Chain Fulfillment: Hardware manufacturers receive massive orders for specialised GPUs, advanced servers, and high-bandwidth networking gear. * Revenue Realisation: Component suppliers recognise this income on their balance sheets, driving immediate sector revaluations.
By understanding the mechanical flow of this capital, readers can identify tertiary investment opportunities across the broader supply chain. This approach provides an alternative to focusing exclusively on the mega-cap buyers. These specific expenditures have become the dominant macroeconomic indicator for the entire technology sector.
The rapid exhaustion of available data storage capacity illustrates these downstream bottlenecks; major enterprise hardware suppliers have already sold out their production through 2026, leading to acute price surges across the memory market.
Structural Vulnerabilities in Major Market Indexes
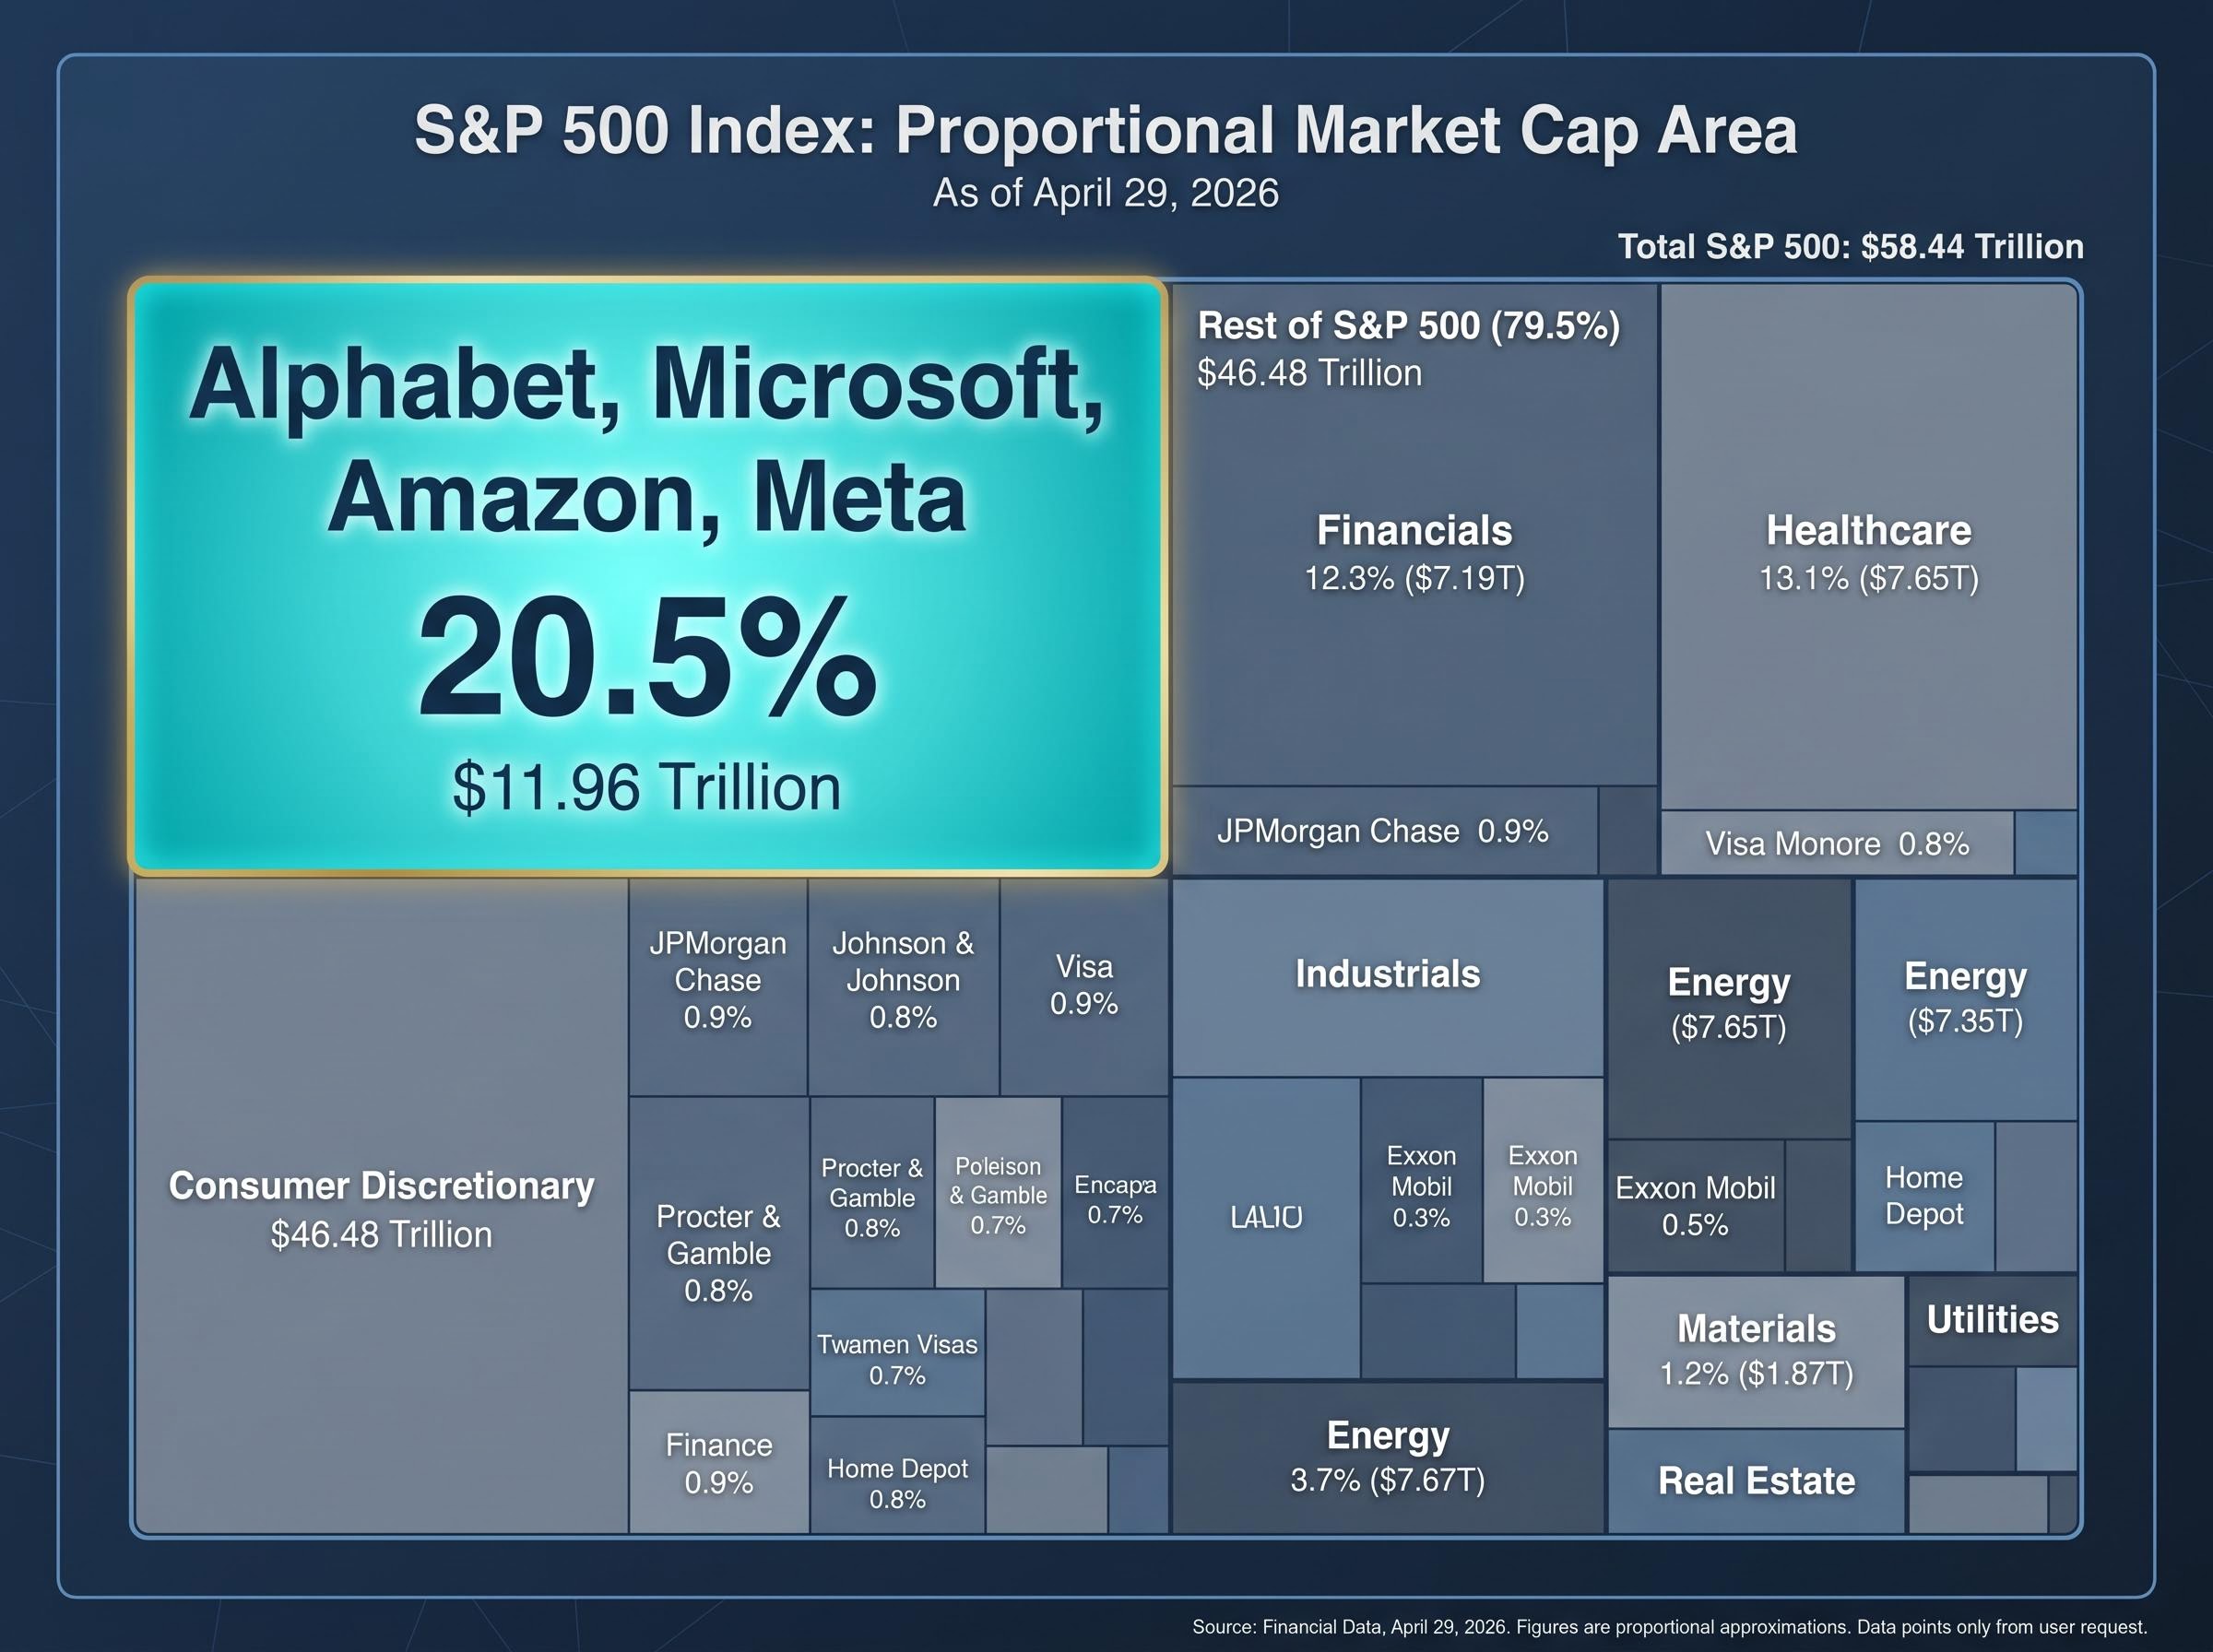
The structural vulnerabilities created when an entire national benchmark relies on the spending habits of four corporations are profound. As of April 29, 2026, the combined market capitalisation of Alphabet, Microsoft, Amazon, and Meta reached approximately $11.96 trillion. This cohort alone represents roughly 20.5% of the $58.44 trillion S&P 500 index.
Passive index investors are heavily exposed to the infrastructure cycle whether they actively trade technology equities or not. Simultaneous financial disclosures from these specific companies create acute, concentrated volatility that ripples through the broader market. The derivatives market pricing actively reflects this concentrated risk profile.
Market Strategist Commentary “The concentration of capital expenditure among four entities transforms standard earnings seasons into systemic risk events. When 20% of an index moves on the exact same infrastructure thesis, diversification strategies fail.”
Assessing Options Market Pricing Expectations
Options traders are utilising specific volatility strategies around these highly concentrated earnings dates. According to market data, anticipated options market equity movements currently sit at 4% for Amazon and 7.1% for Meta.
These current derivatives pricing metrics reflect a slightly muted expectation compared to historical volatility averages. According to market data, over the previous 12 quarters, post-disclosure movement averages reached 6% for Amazon and 8.4% for Meta. This pricing divergence signals potential market complacency regarding the underlying execution risks.
For readers evaluating the broader macroeconomic backdrop, our comprehensive walkthrough of S&P 500 recession risks examines how global supply chain disruptions and elevated energy prices are creating historical warning signals despite record index highs.
The Revenue Reality Check: Searching for Return on Capital
The prevailing market optimism requires a critical examination of the gap between explosive top-line cloud growth and the elusive definitive proof of return on investment. Hyperscalers are demonstrating early revenue traction that justifies their massive budgets, contrasting sharply with historical technology bubbles. The Q1 2026 cloud growth rates highlight this demand, with Google Cloud surging 48%, Azure expanding 40%, and AWS growing 24%.
The official SEC financial disclosures detailing AWS operating income provide a critical baseline for evaluating whether the segment’s margin profile can absorb these massive incoming depreciation expenses.
Despite these impressive top-line figures, concrete and isolated profitability metrics for new digital intelligence products remain largely unverified. The market places immense pressure on hyperscalers to prove this spending will not severely degrade long-term operating margins. Analysts project an eventual capital expenditure growth slowdown to 25% year-on-year by the end of 2026.
Verified commercial adoption rates from enterprise software customers Isolated operating margins for newly deployed intelligence infrastructure Forward guidance on physical facility energy constraints Evidence of supply chain bottleneck resolution
The Cost of Disappointment
Investors must monitor these revenue validation metrics closely because commercial adoption lagging behind infrastructure supply will trigger severe repricing. The recent Amazon market reaction demonstrated this risk perfectly. A $200 billion capital expenditure revelation triggered a 9% stock decline as investors balked at the implied margin degradation.
Software developers missing commercial targets face immediate market punishment, but hardware manufacturers carry the systemic risk. If software monetisation fails, hardware suppliers face an immediate cessation of the multi-year order backlogs that currently support their valuations.
Tracking Capital Flow into Physical Component Suppliers
The direct financial impact on the supply side is unprecedented, with hyperscaler budget commitments triggering historic valuation surges in specialised hardware sectors. The PHLX Semiconductor Sector index closed at 10,035.58 on April 28, 2026. This represents an extraordinary year-to-date gain of approximately 41.7% from its December 31, 2025 close.
These gains are driven by a direct mathematical connection between the $600 billion spending projections and the multi-year order backlogs at major chip designers. According to market data, a dedicated sector-themed portfolio appreciated 27.2% between late March and late April 2026 alone. The entire fabrication supply chain is currently priced for flawless execution of hyperscaler facility expansion plans.
Emerging hardware developers are aggressively capitalising on this demand, with independent component designers raising substantial capital to fast-track novel in-memory compute architectures and specialised discrete chips.
This dynamic validates why semiconductor equities have dominated portfolio returns recently. However, it also highlights the systemic risk posed to these hardware suppliers if hyperscalers suddenly restrict their budgets. Any delay in facility construction translates directly into deferred revenue for the semiconductor sector.
A Commercial Framework for Evaluating Capital Sustainability
Active portfolio management requires a structured methodology for evaluating whether this infrastructure build-out is maintaining a healthy pace. Market analysts note an anticipated $200 billion in further supply chain upside potential if current demand holds steady. To capture this value, investors need specific leading indicators to signal cyclical continuation or pending contraction.
The physical limitations of current hardware also provide a crucial indicator; the industry is rapidly approaching a critical thermal ceiling, driving urgent capital allocation toward advanced graphene semiconductor materials capable of managing the immense heat generated by digital intelligence processing.
- Monitor Cloud Top-Line Run Rates: Verify that quarterly revenue growth for AWS, Azure, and Google Cloud remains above 20%.
- Track Free Cash Flow Margins: Ensure hyperscalers maintain sufficient unencumbered cash generation to fund their physical expansions organically.
- Assess Hardware Order Backlogs: Watch for any cancellation notices or delivery deferments from primary semiconductor suppliers.
- Evaluate Energy Infrastructure: Monitor the permitting and power procurement announcements that dictate physical data centre viability.
This framework establishes baseline expectations for how long this elevated spending environment can rationally persist. The absolute necessity of hyperscaler cash flows remaining strong cannot be overstated, as debt-funded infrastructure scaling would radically alter the risk profile.
Navigating the Next Phase of the Technology Spending Cycle
The current market cycle requires a delicate balance between necessary infrastructure modernisation and the risk of massive capital misallocation. Semiconductor suppliers currently hold the clearest path to profit through confirmed order backlogs, while hyperscalers shoulder the ultimate execution and monetisation risk. Passive index investors must recognise that they are participating in this cycle by default through heavy S&P 500 concentration.
Market attention now turns toward the Q2 and Q3 2026 earnings seasons for definitive proof of sustainable commercial demand. The gap between hardware deployment and software revenue realisation will ultimately dictate the duration of this supercycle.
This article is for informational purposes only and should not be considered financial advice. Investors should conduct their own research and consult with financial professionals before making investment decisions. Past performance does not guarantee future results. Financial projections are subject to market conditions and various risk factors.