
What Domino’s Q1 Results Reveal About the Consumer Spending Slowdown
15 hrs ago

U.S. consumer sentiment just recorded 49.8 on the University of Michigan index in April 2026, its lowest reading in years. The S&P 500 closed at 7,152.72 on the same day. Both numbers are current, both are verified, and they describe the same country at the same moment.
The gap between record equity valuations and deteriorating real-economy indicators is widening in ways that historically have not gone unnoticed. The NFIB Small Business Optimism Index fell to 95.8 in March 2026, dropping below its 52-year historical average of 98.0 for the first time since April 2025. Wage growth, tracked by the Atlanta Fed, has cooled from 4.1% in September 2025 to 3.9% in March 2026. Yet corporate profit margins sit at 15-year highs and analysts project approximately 17.4% earnings growth for calendar year 2026.
Stock market divergence from underlying economic conditions is the analytical puzzle confronting retail investors right now. What follows explains why the gap exists, whether it is structurally sustainable or historically alarming, and what it means for portfolio positioning.
The Michigan sentiment reading deserves to sit on its own for a moment.
University of Michigan Consumer Sentiment: 49.8 (April 2026 final), down from 53.3 in March 2026 and 53.6 in October 2025. A continued, accelerating decline from already depressed levels.
That figure shares a calendar with an S&P 500 close of 7,152.72. It shares a quarter with a blended net profit margin of 13.2% for Q4 2025, the highest FactSet has recorded in more than 15 years.
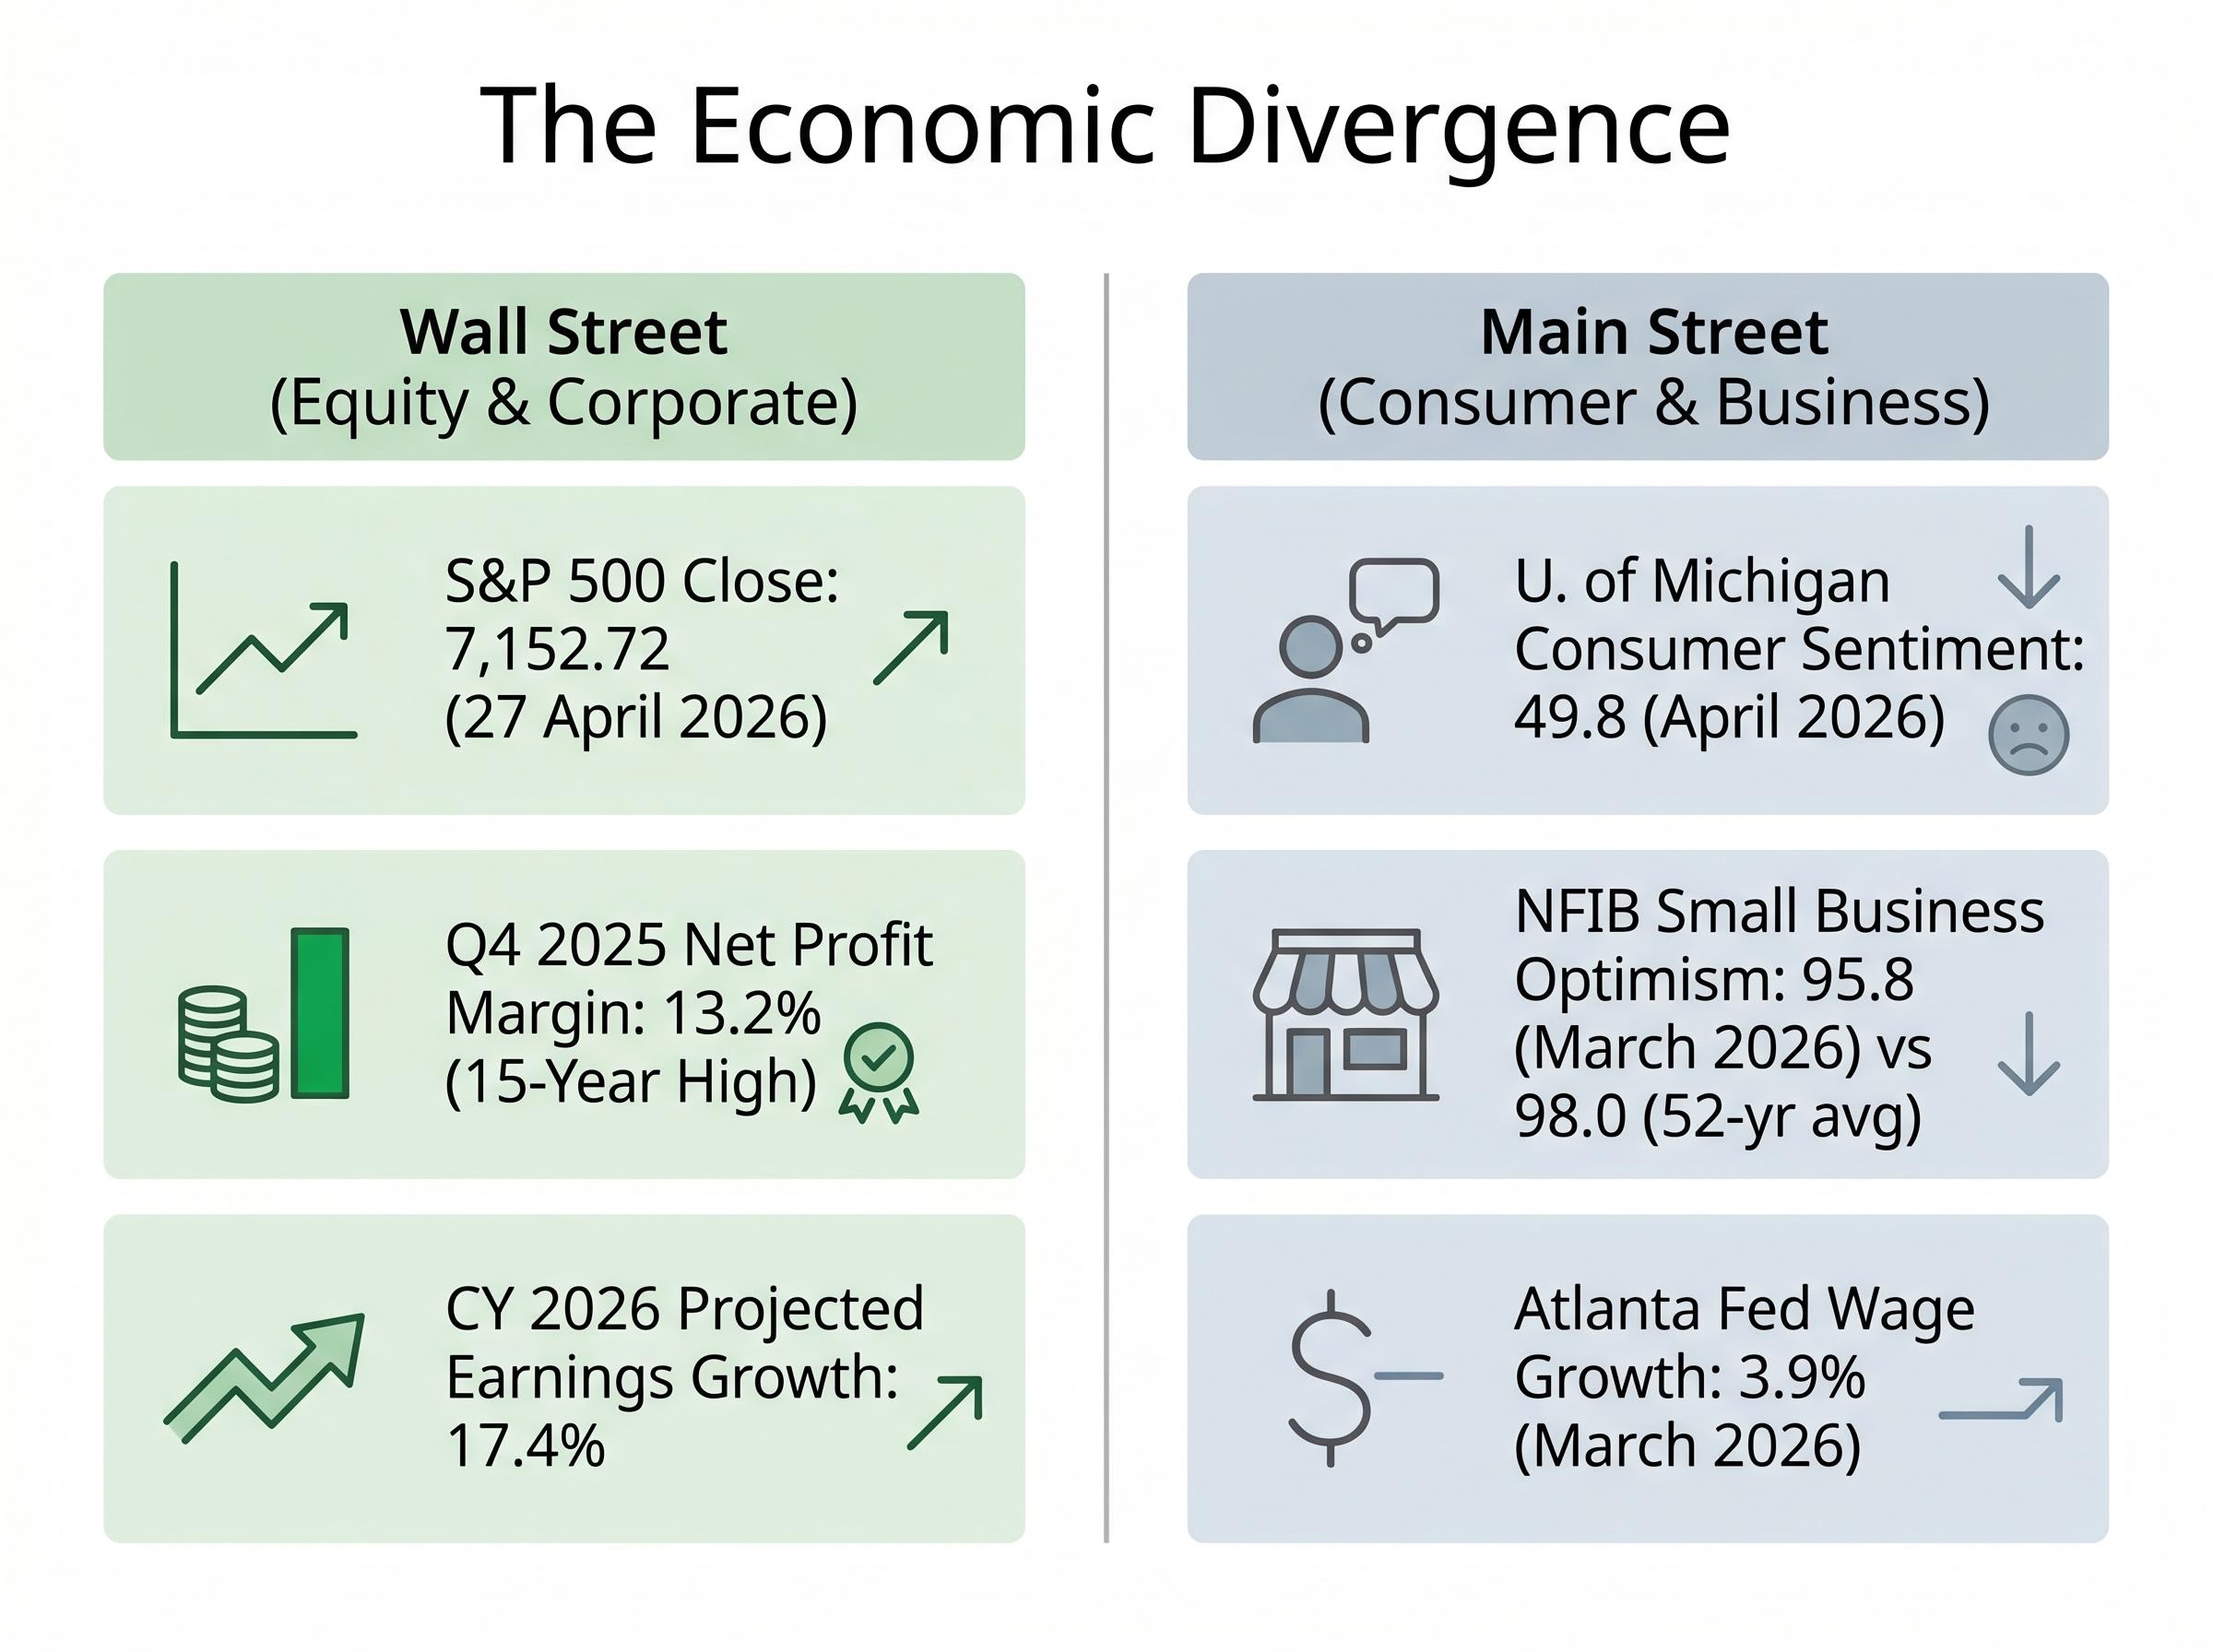
Small business confidence tells the same story from a different angle. The NFIB headline reading of 95.8 in March 2026 sits below the index’s 52-year average of 98.0, a threshold it had not breached since April 2025. The Atlanta Fed Wage Growth Tracker, meanwhile, printed 3.9% in March 2026, continuing a decline from 4.1% in September 2025. Main Street conditions are softening, not recovering.
FRED’s historical University of Michigan Consumer Sentiment dataset shows that sub-50 readings have appeared in only a small number of periods since the index’s inception, making the April 2026 print of 49.8 statistically rare and historically significant rather than a routine soft-data fluctuation.
| Metric | Reading | Period | Trend Direction | What It Reflects |
|---|---|---|---|---|
| U. of Michigan Consumer Sentiment | 49.8 | April 2026 (final) | Declining | Consumer expectations and buying conditions |
| NFIB Small Business Optimism | 95.8 | March 2026 | Declining (below 52-year avg) | Small business hiring, capex, and sales plans |
| Atlanta Fed Wage Growth Tracker | 3.9% | March 2026 | Cooling | Median year-over-year wage growth |
| S&P 500 Close | 7,152.72 | 27 April 2026 | Near record highs | Large-cap equity valuations |
| S&P 500 Net Profit Margin (Q4 2025) | 13.2% | Q4 2025 (blended) | Expanding | Corporate profitability at index level |
Investors who rely solely on index-level performance to gauge economic health are working with an incomplete picture. The divergence between these data sets is not noise. It is the central analytical question of this market.
The University of Michigan Consumer Sentiment Index surveys households monthly on their expectations about personal finances, business conditions, and buying conditions. It is not measuring what consumers are doing right now. It is measuring what they expect to happen next.
The NFIB Small Business Optimism Index operates on a similar principle across a different population: approximately 300,000 small business members. Its headline number aggregates ten components, several of which function as forward proxies for economic activity. The most investor-relevant among them:
These are not measures of current distress alone. They are measures of intention and expectation, and that distinction matters.
The NFIB’s March 2026 Small Business Optimism survey release documents not only the headline drop to 95.8 but also the component-level weakening in hiring plans and capital expenditure intentions, the two sub-indices most directly relevant to forward GDP and employment projections.
Indicators fall into three broad categories. Leading indicators predict future economic activity. Coincident indicators move with current conditions. Lagging indicators confirm what has already occurred.
Consumer sentiment and small business capex intentions sit firmly in the leading category. The unemployment rate, by contrast, is a lagging indicator; it confirms a downturn after it has begun, not before. Fed officials, institutional strategists, and corporate CFOs track these sentiment measures precisely because they provide a forward signal. When Michigan sentiment declines for consecutive months and NFIB capex intentions weaken, those readings suggest spending and investment changes that have not yet appeared in hard data like retail sales or GDP.
The value to investors is specifically in this forward signal. Treating sentiment as “soft” and therefore dismissible means ignoring the same data that informs monetary policy decisions and corporate budget planning.
The gap between equity markets and underlying economic indicators is not unprecedented. Three historical episodes are most instructive for evaluating the current situation:
Each episode resolved differently. In 2020, the economy eventually caught up to markets, validating the forward-pricing. In other periods, corrections brought equity prices back toward economic reality. History contextualises the divergence; it does not predetermine its outcome.
Two additional valuation lenses broaden this picture further: the Buffett Indicator and yield curve signals, where the former currently sits at 228%, exceeding both the dot-com peak and the pre-2008 reading, while the latter remains non-inverted at a positive 0.52% spread, removing the most historically reliable recession predictor from the bear case.
Structural gap in focus: S&P 500 earnings per share have risen approximately 356% since 2000, while U.S. nominal GDP has grown approximately 206% over the same period, according to J.P. Morgan Private Bank analysis. The index has structurally outgrown the economy it is often assumed to represent.
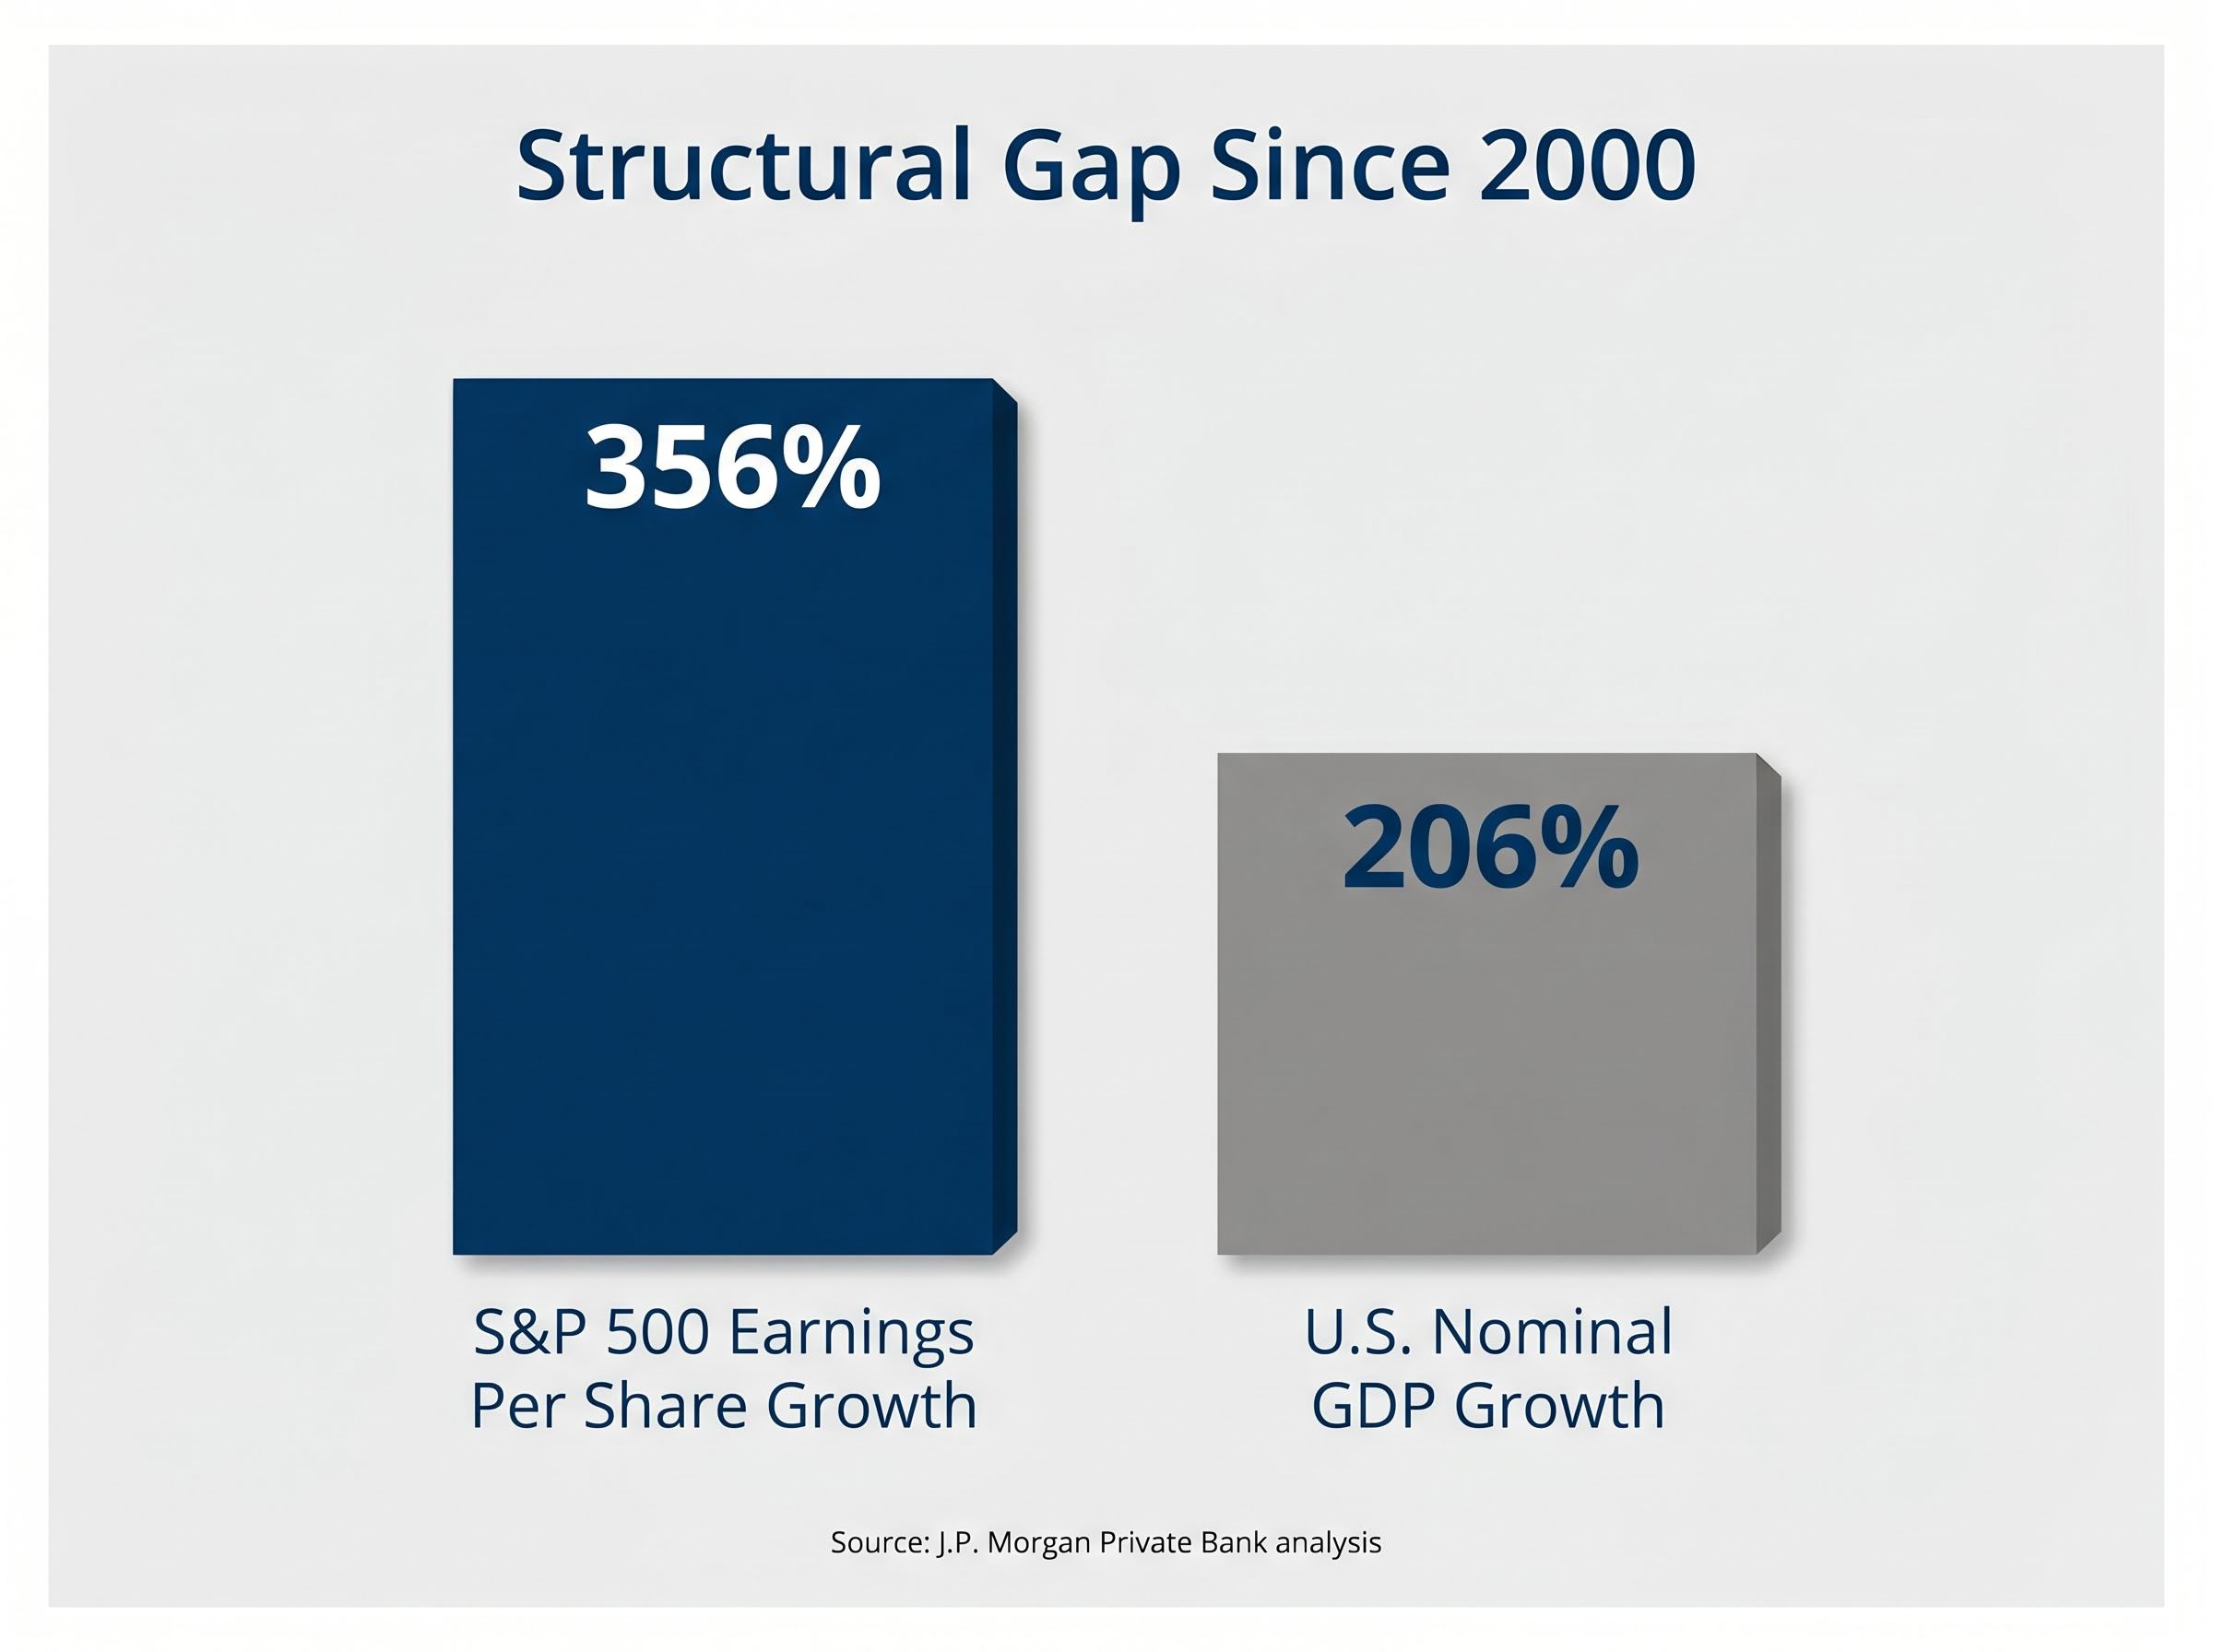
That structural gap is not a recent development. It has been widening for more than two decades, driven by the index’s evolving composition and the mechanisms explored in the following section.
The S&P 500 is not a mirror of the U.S. economy. It is a curated index of 500 large-cap companies, weighted heavily toward globally operating, services-intensive, and technology-oriented firms. The actual U.S. economy includes millions of small businesses, local service providers, and wage-dependent households that have no representation in the index.
Four structural mechanisms explain why the gap between index performance and domestic economic conditions can persist:
According to J.P. Morgan Private Bank analysis, AI-driven capital expenditure is lifting corporate profits without a proportional surge in hiring. Productivity and margin gains accrue to shareholders rather than workers.
This dynamic is structurally different from prior capital expenditure cycles. Factory equipment and logistics infrastructure investments had stronger multiplier effects on employment and wages. AI investment, by contrast, tends to replace or augment labour rather than create it at comparable scale. The result is visible in the data: S&P 500 Q4 2025 blended net profit margins reached 13.2%, with calendar year 2026 earnings growth estimated at approximately 17.4% year-over-year, according to FactSet, even as wage growth cools and small business confidence deteriorates.
AI capital expenditure ROI sustainability is the unresolved variable sitting beneath the current profit margin expansion story: consensus hyperscaler spending for 2026 has reached $527 billion, yet no major provider has announced a credible path to proportionate returns, which means the productivity and margin gains currently accruing to shareholders rest on a capital allocation thesis that has not yet been validated.
Households and small businesses experience this as stagnation. Index-level earnings metrics reflect the productivity gains. The Michigan sentiment reading of 49.8 and the NFIB reading of 95.8 are, in part, measuring the lived experience of an economy where corporate profitability and household prosperity have structurally decoupled.
Headline index levels tell one story. The internal composition of the market tells another.
Institutional investors have been rotating from high-growth, Nasdaq-heavy names toward defensive and value-oriented sectors, including financials, industrials, and consumer staples. This rotation reflects a recalibration of risk in response to the slowdown signals embedded in sentiment and wage data, even while the S&P 500 holds near record levels.
Index highs and defensive rotation can and do coexist. The market can reach new highs while its internal composition quietly shifts toward caution.
That coexistence is not contradictory; it is the index masking a distributional shift underneath the headline number. The S&P 500 at 7,152.72 does not tell investors whether the gains are broad-based or concentrated in a narrowing set of sectors.
Retail investors who track only the index level miss this distributional story. Three observable signals can help surface what institutional positioning looks like beneath the headline:
Speculative retail positioning in the current market has intensified alongside the sentiment deterioration: options trading now accounts for 40-50% of total market volume, with call options representing more than 60% of that total, a configuration that amplifies both upside momentum and the speed of any reversal.
These are imperfect instruments, but they are more sensitive than the headline index number for reading institutional sentiment.
The core challenge for investors is distinguishing between two fundamentally different scenarios. Getting that distinction right matters more than predicting which one materialises.
Scenario one: economic data catches up to market optimism. Consumer sentiment recovers, small business capex plans stabilise, wage growth re-accelerates, and the current earnings growth projections of approximately 17.4% for CY 2026 are validated by actual results. In this scenario, current valuations are forward-pricing correctly.
Scenario two: market pricing corrects toward the weakening economic signals. Earnings growth fails to materialise at the projected rate, sentiment continues to deteriorate, and the structural tailwinds prove insufficient to offset a genuine consumer-led slowdown. In this scenario, the index has overshot.
Both remain live possibilities. The current Q1 2026 earnings season, now underway, is the near-term test of which scenario has more traction. The Michigan sentiment reading of 49.8, a historic low, provides the counterweight; previous episodes of sub-50 readings have preceded both recoveries and further deterioration, depending on the broader policy and earnings environment.
Investors wanting a detailed view of how the earnings season will test the AI capex thesis will find our full breakdown of what Big Tech’s Q1 2026 results will reveal, covering Alphabet, Microsoft, Amazon, Meta, and Apple reporting in a 48-hour window starting 29 April 2026, projected earnings growth of 22-25% year-on-year, and the specific revenue metrics that would either validate or undermine the $649-700 billion AI infrastructure bet.
Three portfolio-relevant questions emerge from this analysis:
These questions do not produce a single correct answer. They produce a more precise understanding of what the portfolio is betting on, which is more durable than any specific trade recommendation.
This article is for informational purposes only and should not be considered financial advice. Investors should conduct their own research and consult with financial professionals before making investment decisions. Past performance does not guarantee future results. Financial projections are subject to market conditions and various risk factors.
With Q1 2026 earnings season underway and the next Michigan sentiment update pending, the next four to six weeks will provide material new data on whether the earnings growth thesis is holding and whether sentiment is stabilising or deteriorating further. The Conference Board Consumer Confidence Index, updated monthly, and the NFIB monthly release offer additional reference points for investors building their own tracking frameworks. Those releases represent the near-term signal set for anyone seeking to assess which resolution path this divergence is taking.
Stock market divergence refers to a situation where equity index levels, such as the S&P 500, move in a different direction from underlying economic indicators like consumer sentiment, wage growth, or small business confidence. It reflects the fact that the S&P 500 is a curated index of large-cap, globally diversified companies and is not a direct mirror of the broader domestic economy.
The University of Michigan Consumer Sentiment Index fell to 49.8 in April 2026, a statistically rare sub-50 reading, while the S&P 500 closed at 7,152.72 on the same day. Structural factors including AI-driven profit margin expansion, share buybacks, and the S&P 500's large global revenue base allow corporate earnings to grow even as domestic household and small business conditions soften.
Investors should assess their exposure to sectors sensitive to domestic consumer spending versus large-cap, globally diversified, and AI-adjacent names that are driving index-level gains. Monitoring sector ETF flows, relative performance of defensive versus growth sectors, and earnings revision trends can reveal how institutional investors are repositioning beneath the headline index number.
The NFIB Small Business Optimism Index aggregates survey responses from approximately 300,000 small business members and includes forward-looking components such as hiring plans and capital expenditure intentions. Its March 2026 reading of 95.8 fell below its 52-year historical average of 98.0, signalling a weakening in both hiring and investment intentions that can precede broader economic slowdown.
Yes, notable historical episodes include the 2020 COVID-era recovery, where markets priced in a rebound long before hard economic data confirmed it, and the post-2008 recovery, where rising equity prices coexisted with a labour market that took years to heal. These episodes resolved differently: sometimes the economy caught up to market optimism, and in other cases equity prices corrected toward economic reality.


