
What Domino’s Q1 Results Reveal About the Consumer Spending Slowdown
15 hrs ago

The University of Michigan Consumer Sentiment Index hit 49.8 in April 2026, a record low. The S&P 500 sits above 7,100. That gap is not a glitch; it is the defining financial story of this moment.
U.S. equity markets have continued to post strong gains driven by technology earnings and AI-related capital expenditure, even as consumer confidence collapses, GDP growth slows to 0.5% annualised, and job cut announcements in 2025 surged 58% year-over-year. For investors trying to read the macroeconomic picture, the two signals are nearly irreconcilable on the surface.
This analysis explains why markets and the economy can diverge for extended periods, what structural forces are sustaining the split right now, which indicators deserve genuine concern versus which are being overstated, and under what conditions the gap eventually closes. The goal is not to pick a side in the bull-versus-bear debate. It is to provide a framework for reading the data as it actually stands.
The numbers tell two stories at once.
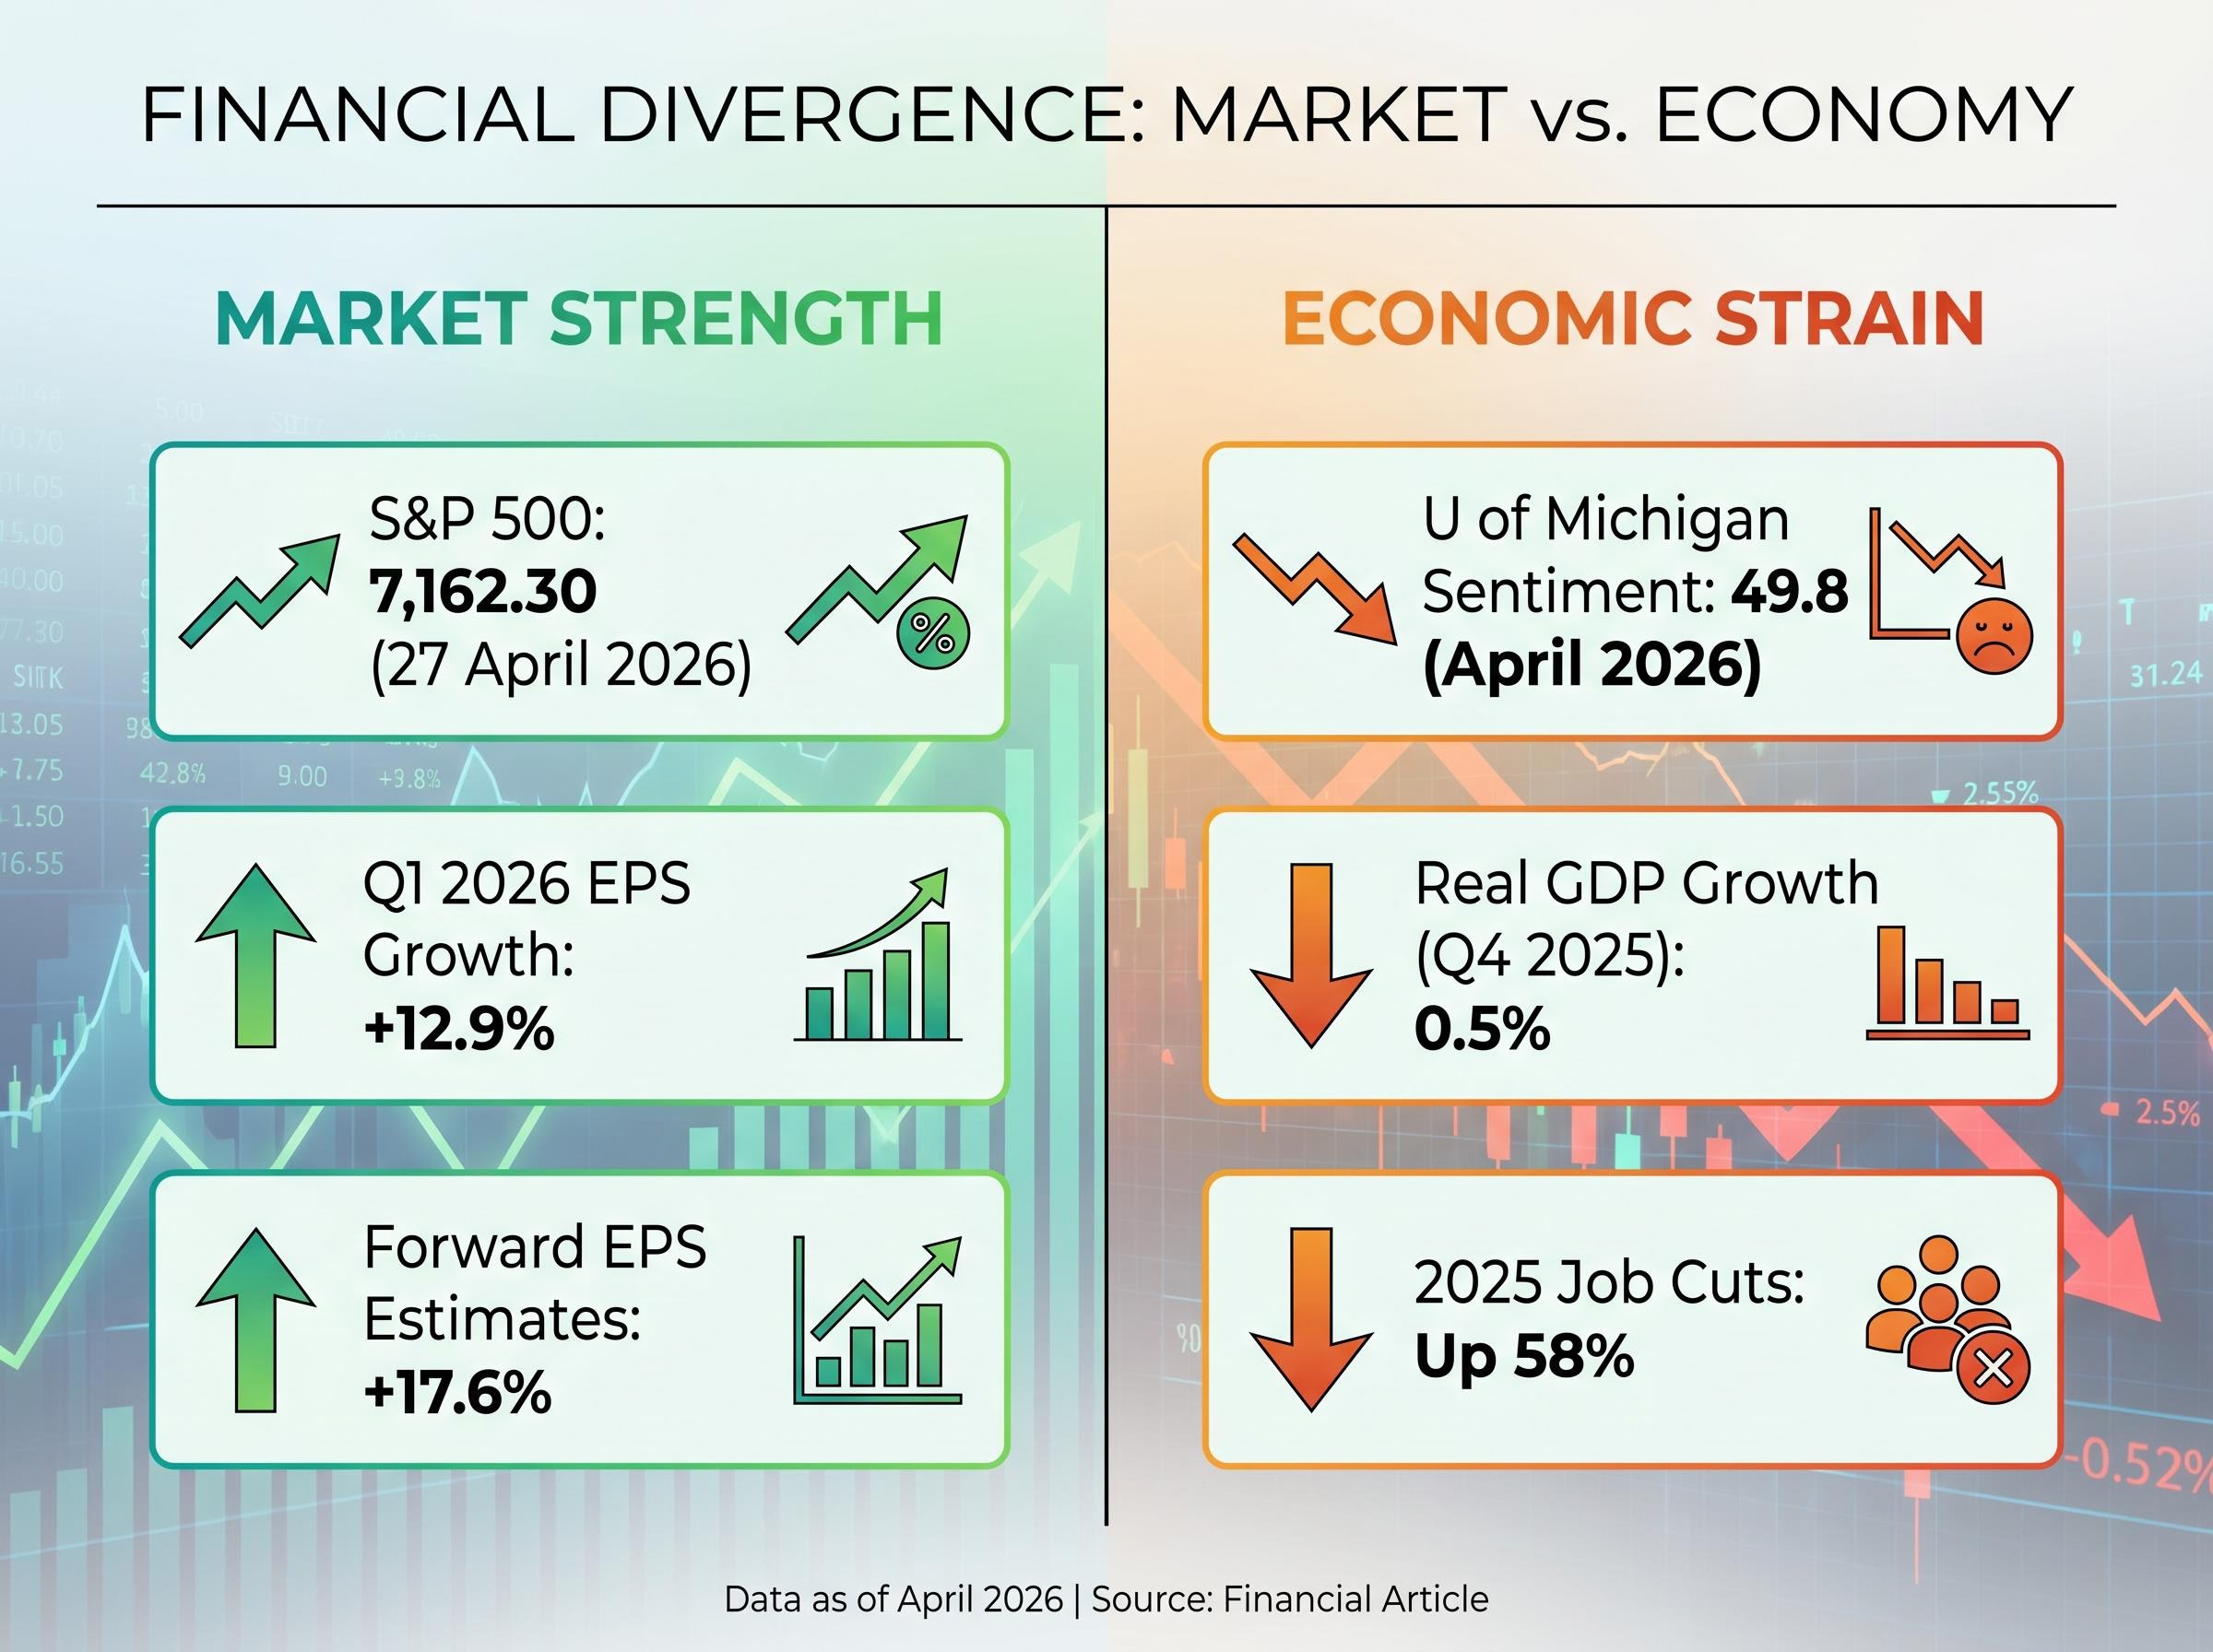
University of Michigan Consumer Sentiment: 49.8 (April 2026) A record low, down 6.6% from March, and far below the long-term average of approximately 85.
On one side, the S&P 500 closed at 7,162.30 on 27 April 2026, with Q1 2026 earnings per share growing 12.9% year-over-year and forward estimates revised upward to 17.6%. On the other, U.S. real GDP grew at just 0.5% annualised in Q4 2025, according to the Bureau of Economic Analysis.
The sentiment picture itself is not uniform. The Conference Board Consumer Confidence Index read 91.8 in March 2026, below its long-term average of 95-100 but well above historical crisis lows that have ranged from approximately 25 to 40. The Michigan index supports a severe pessimism narrative. The Conference Board does not, at least not at the same magnitude.
The University of Michigan Surveys of Consumers methodology and current readings place the April 2026 figure in a long-run context stretching back decades, making clear that a sub-50 print sits not merely below average but in territory the index has never previously reached.
The NFIB Small Business Optimism Index came in at 95.8 in March 2026, below its 52-year average of 98. Small businesses are cautious. They are not yet in retreat.
| Indicator | Current Reading | Context |
|---|---|---|
| S&P 500 | 7,162.30 (27 April 2026) | Elevated; below 2026 highs |
| U of Michigan Sentiment | 49.8 (24 April 2026) | Record low; -6.6% from March |
| Conference Board Confidence | 91.8 (March 2026) | Below average; not at crisis lows |
| Real GDP Growth (Q4 2025) | 0.5% annualised | Subdued expansion |
| NFIB Optimism Index | 95.8 (March 2026) | Below 52-year average of 98 |
Neither a simplified “markets are wrong” nor a “sentiment is overblown” framing captures what these numbers collectively describe. The divergence is real. Understanding its precise shape is the starting point.
The S&P 500 is not a mirror of the U.S. economy. It is a market-cap-weighted portfolio of corporate cash flows, and its composition explains much of the current split.
The index’s largest constituents, Nvidia, Broadcom, Micron, and Microsoft, derive revenue primarily from enterprise AI spending and hyperscaler capital expenditure, not from consumer discretionary activity. When sentiment surveys capture household-level pessimism about fuel costs, grocery prices, and insurance premiums, those pressures register only indirectly in the earnings of companies selling semiconductor architectures to data centres.
Forward earnings revisions tell the same story. The upward revision to 17.6% growth reflects analyst confidence in tech-sector momentum specifically. It is not a statement about broad-economy health.
The index concentration argument becomes more precise when you examine the forward PE compression driven by AI earnings revisions: the forward multiple has actually contracted from above 23x in late 2025 to approximately 22x even as prices reached all-time highs, a pattern unprecedented in data going back to 1985, because earnings forecasts have been rising faster than prices.
The structural reasons for the divergence come down to a short list:
The Federal Funds Rate sits at 3.5%-3.75% as of April 2026, on hold after cuts in late 2025. Those cuts provided a buffer. Equity valuations benefit from lower discount rates, and the pause, while limiting further stimulus, has not reversed the benefit already embedded in current prices.
JPMorgan’s 2026 market outlook estimates a 35% recession probability. That figure captures the tension: elevated risk, but not a base case.
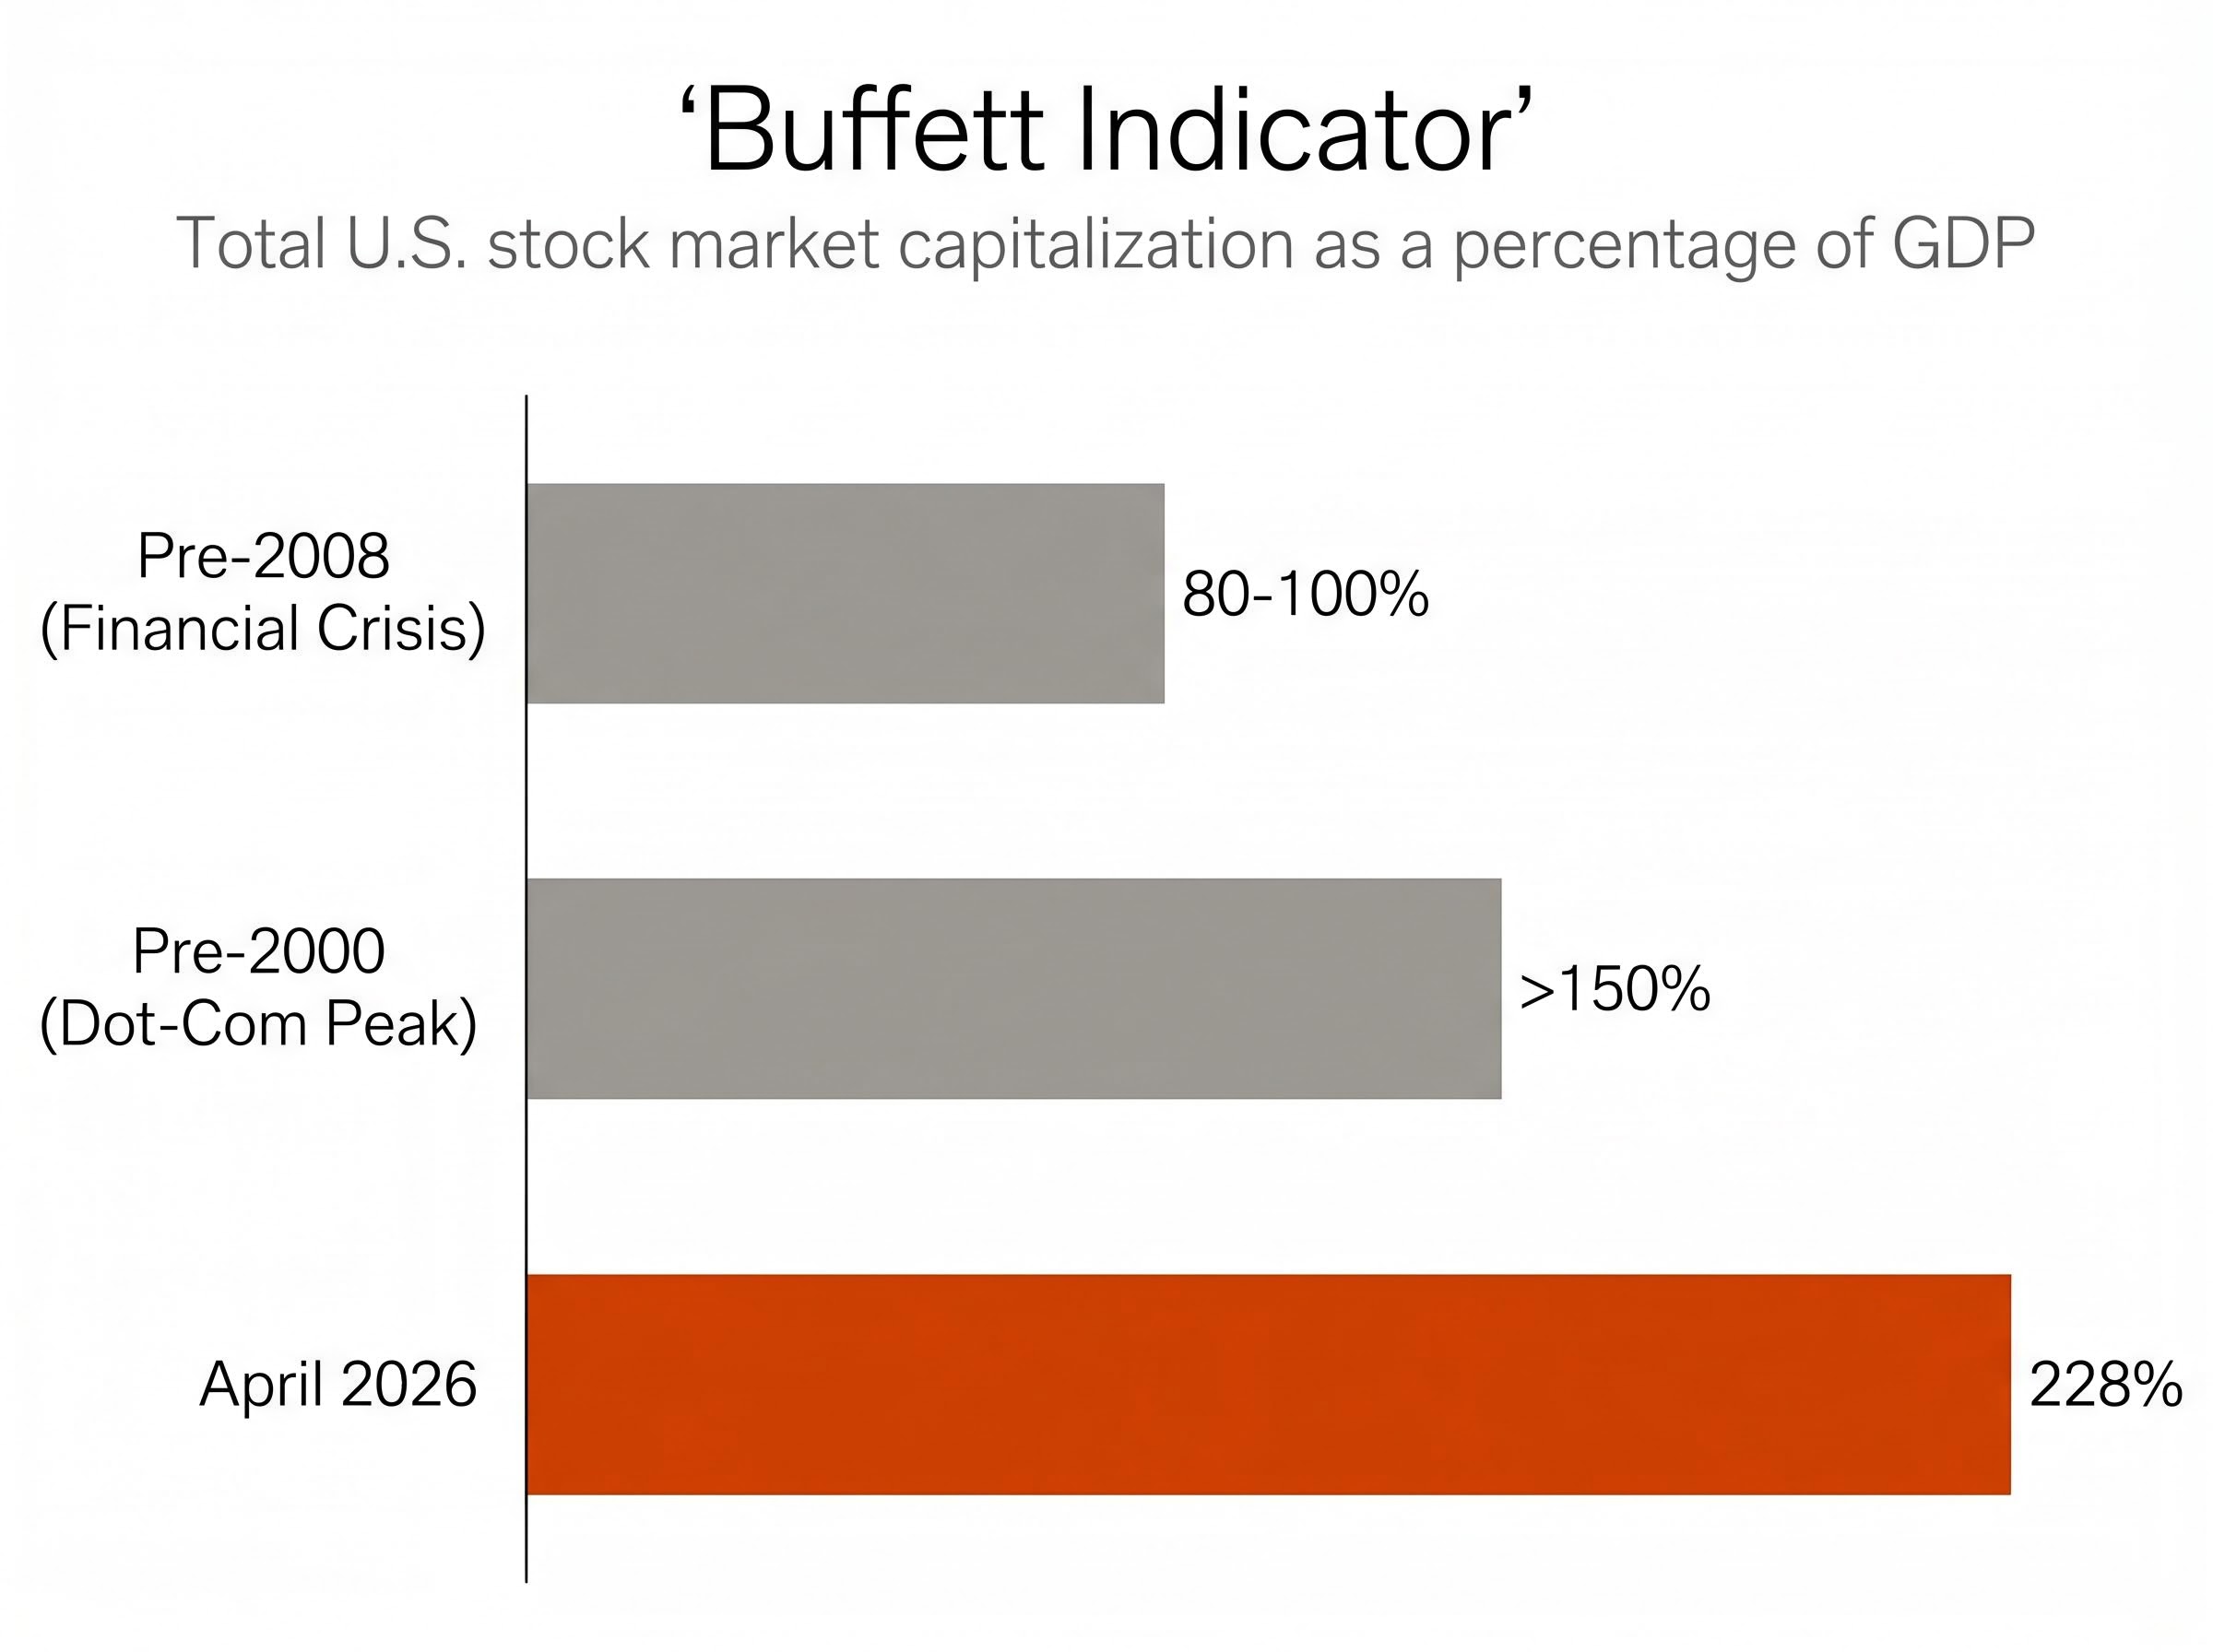
The Buffett Indicator measures total U.S. stock market capitalisation as a percentage of gross domestic product. It serves as a broad gauge of whether equity prices are stretched relative to the economy’s output.
Buffett Indicator: 228% (April 2026) During the 2000 dot-com bubble, levels above 150% were considered extreme. Before the 2008 financial crisis, the reading sat at approximately 80-100%.
The current 228% reading exceeds both of those historical peaks by a wide margin. Three reference points put the progression in perspective:
Gold prices offer a secondary signal. At approximately $4,714 per ounce as of 27 April 2026, gold has appreciated dramatically from levels near $2,000 in prior years, reflecting sustained macro hedging behaviour. The short-term daily movement, however, was -0.55%, meaning gold is not in an active surge right now. The long-term trend and the short-term action tell different stories.
Valuation indicators identify risk level, not timing. The Buffett Indicator exceeded 150% during the dot-com era and sustained those elevated readings for years before the correction arrived. Knowing that valuations are stretched defines the margin of safety available if earnings disappoint; it does not predict when disappointment will arrive.
Two fundamental stress indicators add context. U.S. household debt exceeds $18.5 trillion, and 2025 job cuts totalled 1,206,374, up 58% from 2024, according to Challenger, Gray & Christmas. These are early-stage signals of economic strain. They are not, on their own, sufficient to trigger a timeline for market repricing.
The most important distinction between the current environment and the crash precedents that bears frequently cite is the yield curve.
The 10-year minus 2-year Treasury spread stands at +0.52% as of 27 April 2026. The curve is not inverted. This matters because yield curve inversions preceded both the 2000 and 2008 downturns, making the inverted curve one of the most reliable historical leading indicators of recession. That signal is absent today, and its absence materially weakens comparisons to those episodes.
The New York Fed yield curve recession probability model uses the spread between the 10-year and 3-month Treasury rates as its primary input, and its long empirical record of preceding downturns is the foundation for treating yield curve inversions as the most reliable leading indicator available to macroeconomic forecasters.
The Michigan Sentiment reading of 49.8 is a genuine and severe signal. It is a record low. It should not be dismissed. At the same time, the Conference Board’s 91.8 reading prevents a “Great Depression conditions” characterisation from being accurate. One index supports that framing; the other does not.
Tariff policy has contributed real but indirect economic pressure. U.S. tariffs generated $214.7 billion in revenue in 2025, according to the Yale Budget Lab, while simultaneously increasing costs for consumers and small businesses.
| Signal | Strength of Concern | Key Caveat |
|---|---|---|
| Michigan Sentiment (49.8) | High | Conference Board at 91.8 diverges |
| Buffett Indicator (228%) | High | No timing signal; elevated for years before prior corrections |
| Yield Curve (+0.52%) | Ambiguous | Not inverted; removes most reliable recession predictor from bear case |
| 2025 Job Cuts (1.2M) | Medium | Highest post-2020 but below 2020 levels (~2.1M) |
| GDP Growth (0.5%) | Medium | Subdued expansion, not contraction |
Bears and bulls are both presenting incomplete pictures. The intellectually honest position acknowledges which signals carry strong empirical grounding, which are being overloaded with historical analogies they do not fully support, and which remain ambiguous.
The bear-case mechanism for gap closure follows a sequential chain:
Current data connects to the early stages of this sequence. Household debt exceeds $18.5 trillion. Consumer savings buffers have thinned. The NFIB Optimism Index reflects declining small business confidence. These are early-stage signals, not terminal ones.
JPMorgan estimates a 35% probability of U.S. recession in 2026.
Institutional recession probability estimates for 2026 vary widely depending on the assumptions behind them: Morgan Stanley places the probability at 15%, while Moody’s Analytics puts it at 48.6%, with the divergence reflecting fundamentally different assumptions about the trajectory of oil prices and the degree of Federal Reserve flexibility available in a stagflationary environment.
The 1929, 2000, and 2008 precedents are frequently cited, but one structural difference separates them from the current period: in each of those episodes, the yield curve had inverted before the downturn materialised. The current spread of +0.52% is positive. Historically, a non-inverted curve has been associated with lower near-term recession probability.
The bull-case counterargument has its own logic. If AI-driven enterprise spending sustains tech earnings growth through 2026, and the Fed retains capacity to resume cuts from 3.5%-3.75% should conditions deteriorate, the transmission mechanism described above may stall before reaching the credit event stage. That is not a certainty. It is a plausible scenario with institutional support behind it.
The practical value of understanding this sequence is specificity. Rather than reacting to headline index moves or sentiment readings in isolation, investors can monitor the leading indicators that mark progression along the chain: consumer spending data, earnings revision direction, and credit spreads.
The stock market and the economy are measuring different things. The S&P 500 reflects the weighted cash flows of its largest constituents, currently dominated by technology companies whose earnings drivers sit outside the consumer economy. Sentiment indices and GDP growth reflect household-level conditions that have deteriorated meaningfully.
Neither picture invalidates the other. The Buffett Indicator at 228% and Michigan Sentiment at a record low are not trivial warnings. The non-inverted yield curve and 12.9% earnings growth mean the bull case rests on genuine empirical support, not momentum alone.
The long-run expected return implications of current S&P 500 valuations sit underneath the near-term bull-versus-bear debate: at 20.8 times forward earnings, JPMorgan research projects annualised returns of 5% or less over the next decade, a figure that changes the calculus for long-horizon investors even if the near-term earnings growth story continues to hold.
The indicators worth tracking from here are specific: consumer spending trends, S&P 500 earnings revision direction, credit spreads, and any renewed yield curve inversion signal. In periods of divergence, portfolio positioning benefits from acknowledging both the structural supports and the stretched valuations, rather than acting on either extreme in isolation.
This article is for informational purposes only and should not be considered financial advice. Investors should conduct their own research and consult with financial professionals before making investment decisions. Past performance does not guarantee future results. Financial projections are subject to market conditions and various risk factors.
The S&P 500 is heavily concentrated in technology and semiconductor companies like Nvidia and Microsoft, whose revenues come from enterprise AI spending rather than consumer activity, so household-level pessimism does not directly translate into weaker earnings for the index's largest constituents.
The Buffett Indicator measures total U.S. stock market capitalisation as a percentage of GDP; at 228% in April 2026, it sits well above the dot-com peak of 150% and the pre-2008 reading of 80-100%, signalling historically stretched valuations even though it does not predict the timing of any correction.
The University of Michigan Consumer Sentiment Index hit 49.8 in April 2026, a record low and well below its long-term average of approximately 85, though the Conference Board Consumer Confidence Index read a less alarming 91.8 in March 2026.
No; the 10-year minus 2-year Treasury spread stood at a positive 0.52% as of 27 April 2026, meaning the curve is not inverted, which removes one of the most historically reliable recession warning signals from the bear case.
Investors are best served by tracking specific leading indicators including consumer spending trends, S&P 500 earnings revision direction, credit spreads, and any renewed yield curve inversion, rather than reacting to headline sentiment readings or index moves in isolation.


