
How Hormuz Closure at $104 Oil Is Reshaping Every Asset Class
9 hrs ago

AI stocks now account for approximately 45% of S&P 500 market capitalisation, and one of Wall Street’s most prominent long-term bears just compared the entire rally to a Ponzi scheme. On 26 April 2026, John Hussman, president of Hussman Investment Trust, published a market commentary titled “Causes and Conditions,” warning that AI-driven valuations have reached historically unprecedented levels. The warning lands as U.S. corporate earnings continue expanding and major AI names report blockbuster revenue figures, creating a sharp tension between strong near-term fundamentals and Hussman’s structural concerns about what happens when the growth narrative meets mathematical reality.
What follows breaks down exactly what Hussman is warning about, why his valuation framework generates such stark conclusions, how current conditions compare to 1929 and 2000, and what the credible counterarguments look like for investors weighing both sides.
Hussman did not hedge the language. In his 26 April 2026 commentary, he characterised the AI-driven market rally in terms that evoke a Ponzi-like dynamic: current investors are being “paid” not by the underlying cash flows of the businesses they own, but by the willingness of future investors to bid prices higher still.
Hussman’s core warning: The returns investors expect from AI stocks depend not on the cash these companies will generate at the scale priced in, but on a continuing stream of new buyers willing to pay even more. When that stream slows, the structure collapses.
The mechanism behind the analogy is specific. Hussman argues that the market has priced in AI-generated cash flows at levels that may never materialise at the scale required to justify current valuations. After-tax corporate profits expanded more than 10% year-over-year through late 2025, per U.S. Commerce Department figures, a headline that most investors read as reassuring. Hussman reads it differently: he treats elevated profit margins as structurally fragile, sustained partly by conditions (fiscal deficits, cheap capital) that are unlikely to persist indefinitely.
His firm has declined to specify a precise collapse timeline, acknowledging that valuation-correction triggers have not functioned as historically expected in this environment. The warning is structural, not calendrical.
Hussman’s preferred metric is the MarketCap/GVA ratio, which compares total stock market capitalisation to the gross value added by corporate and financial sectors. He considers it more diagnostic than cyclically-adjusted price-to-earnings (P/E) ratios because P/E ratios can be distorted by temporarily elevated profit margins. The MarketCap/GVA ratio, by contrast, measures price relative to the broadest available measure of corporate output, making it harder for margin inflation to mask overvaluation.
The split valuation signals facing the S&P 500 in April 2026 reflect a genuine analytical divide: the Shiller P/E sits at the second-highest reading in 155 years of data, while the forward P/E has compressed toward its five-year average, leaving investors with two internally consistent but contradictory pictures of where the market stands.
As of April 2026, Hussman’s MarketCap/GVA ratio is registering at historically unprecedented levels.
The individual stock valuations tell their own version of the story. Both Nvidia and Microsoft, the two largest AI beneficiaries by market capitalisation, carry elevated trailing P/E ratios, though both have compressed from their recent peaks.
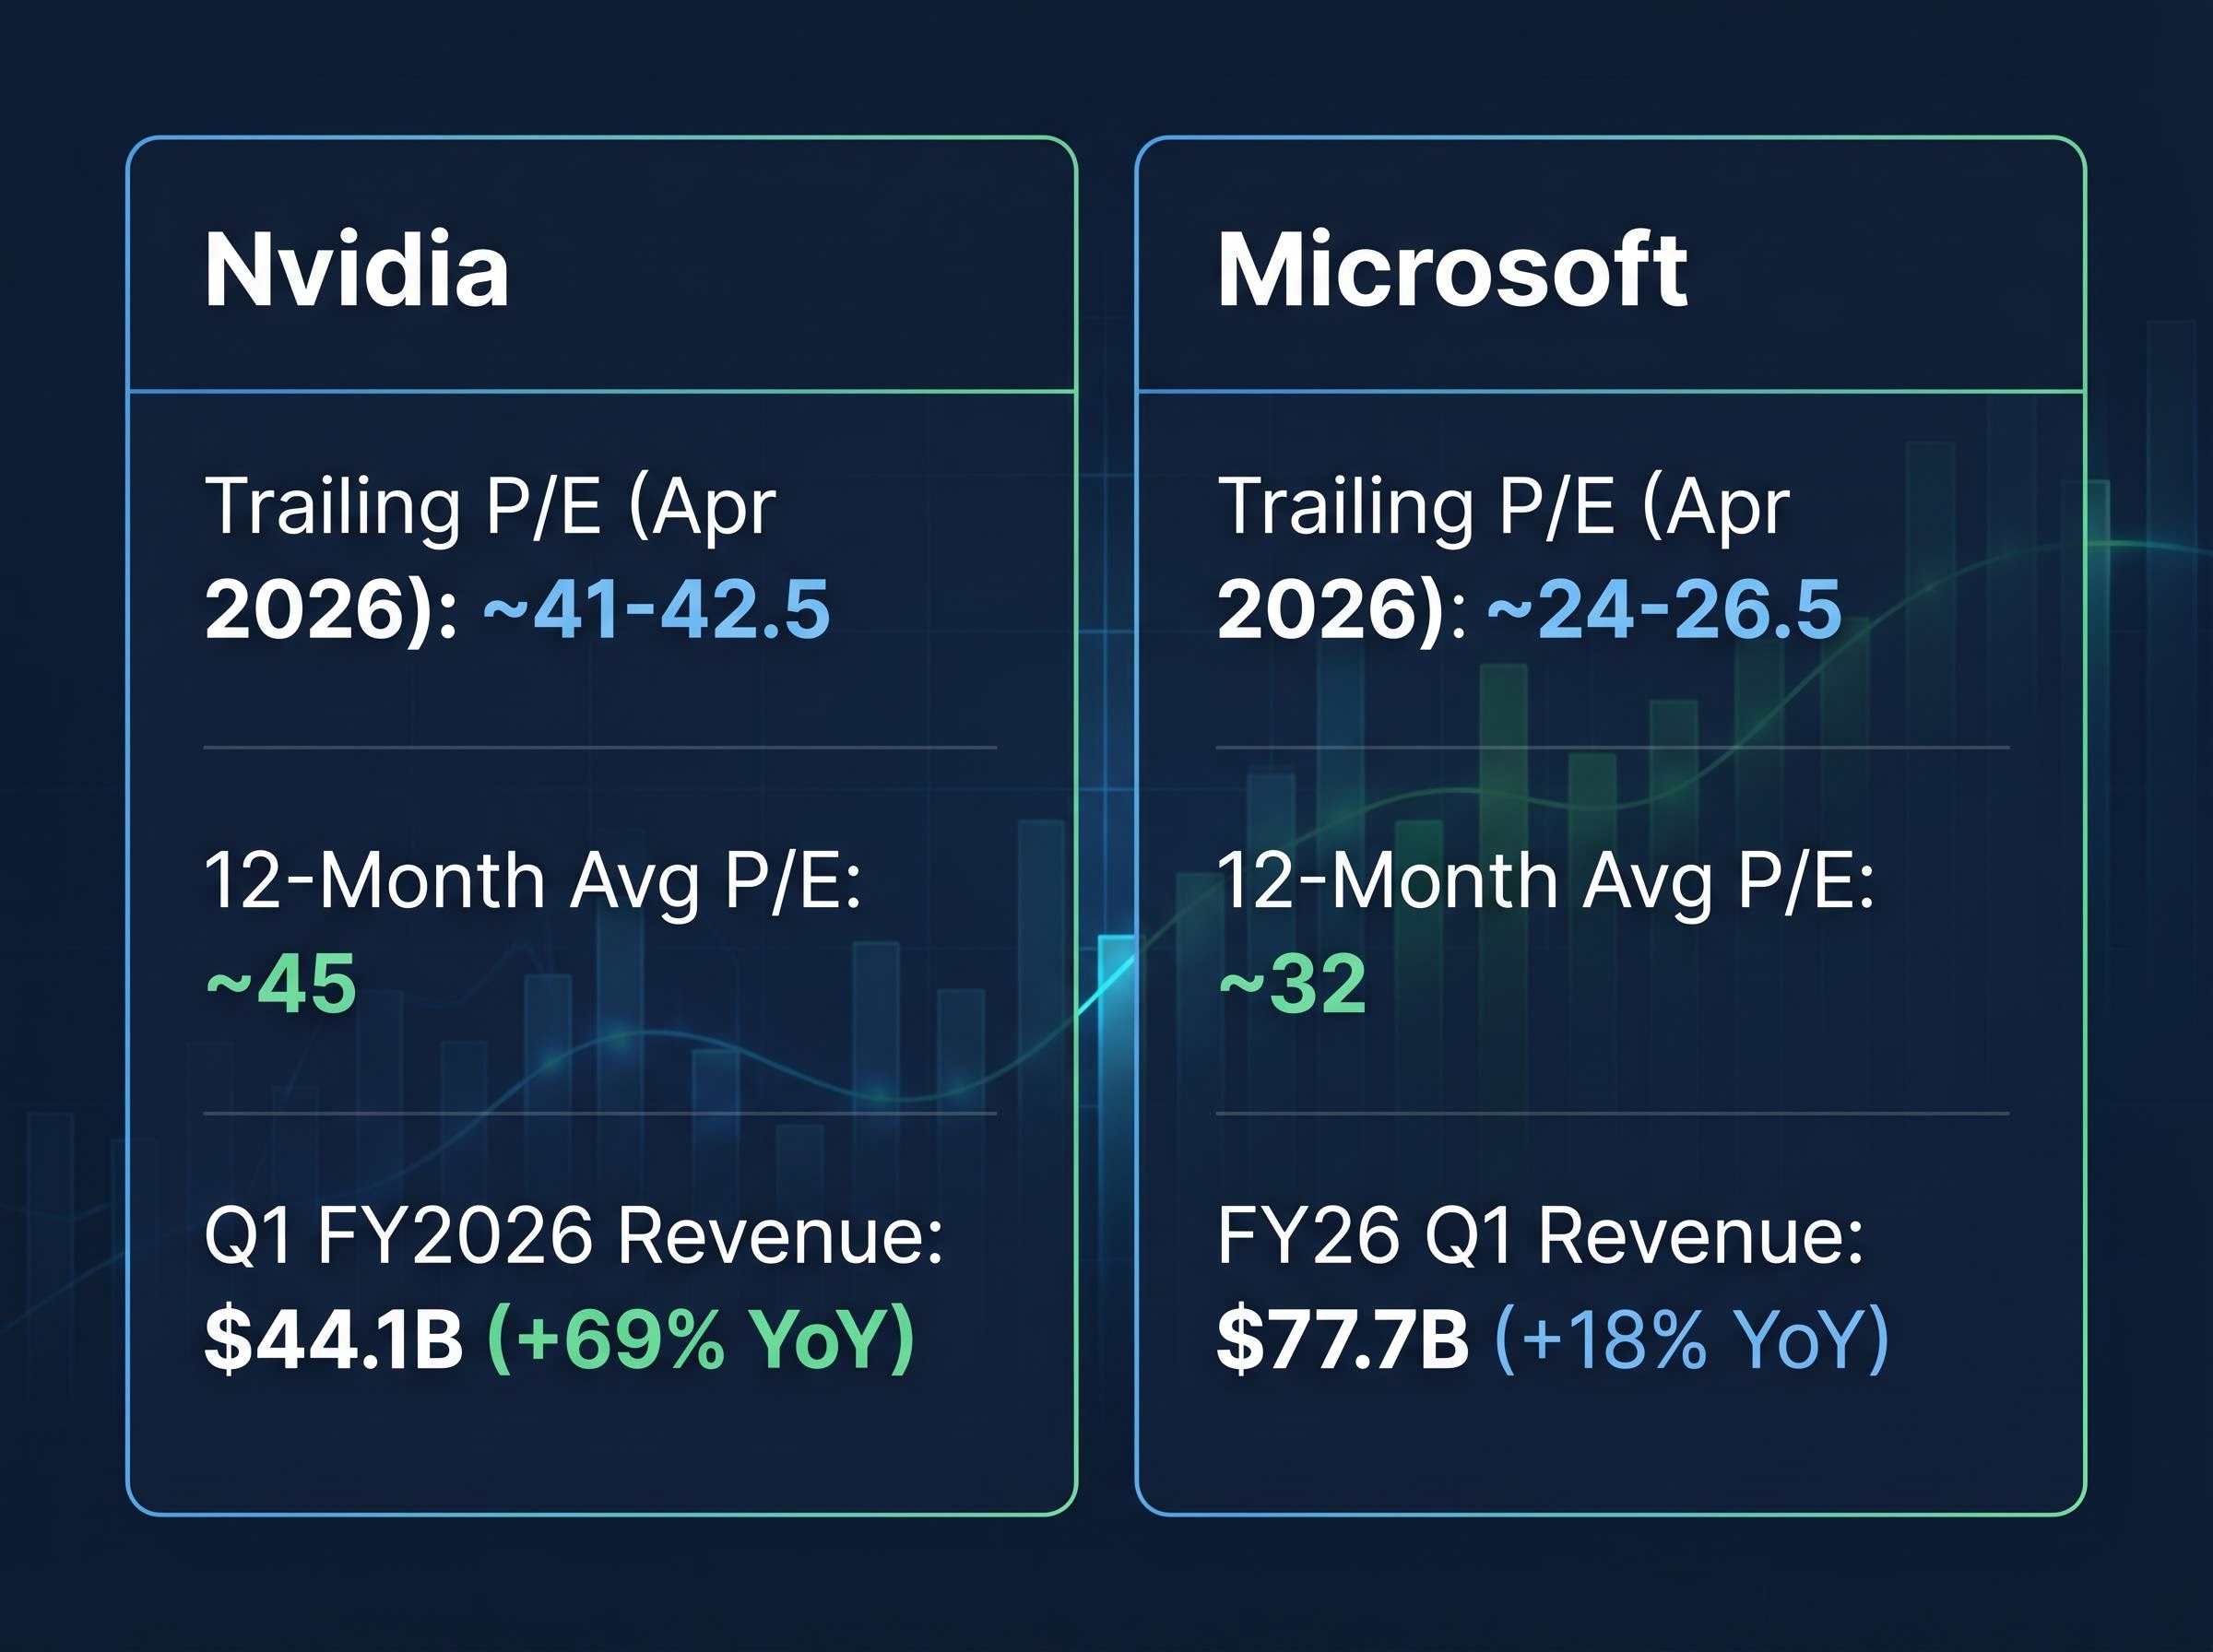
| Company | Trailing P/E (Apr 2026) | 12-Month Average P/E | Recent Revenue Growth |
|---|---|---|---|
| Nvidia | ~41-42.5 | ~45 | $44.1B Q1 FY2026 (+69% YoY) |
| Microsoft | ~24-26.5 | ~32 | $77.7B FY26 Q1 (+18% YoY) |
Information technology sector earnings-per-share growth hit approximately 44% in Q1 2026. That figure is genuinely impressive. Hussman’s framework, however, treats current margin levels as cyclically elevated rather than sustainable.
His argument is that elevated corporate profits partly reflect debt accumulation elsewhere in the economy, not purely genuine productivity-driven expansion. If that reading is correct, current earnings growth is not evidence against the bubble; it is a feature of the bubble’s late stage, sustained by conditions that will eventually reverse.
Hussman draws explicit structural comparisons to two prior peaks:
His 2024 commentary drew similar 1929-like comparisons, meaning the warning has been sustained across multiple market years. Sectors such as energy and materials have outperformed technology on a relative basis during 2026, a rotation pattern that could signal early-stage capital migration away from the most concentrated positions.
Morgan Stanley’s institutional research on stock market concentration risk examined 75 years of historical data and found that periods of extreme market capitalisation concentration in a handful of names have consistently preceded extended drawdowns, a pattern that lends structural support to the parallels Hussman draws between the current AI-heavy index and the dynamics present at the 1929 and 2000 peaks.
Hussman correctly identified bubble conditions preceding the 2000 dot-com crash and the 2008 financial crisis. That track record gives his structural analysis weight.
The timing criticism, however, is equally real. Hussman’s hedged funds have significantly underperformed during prolonged bull markets. Investors who followed his guidance missed substantial gains across extended rallies. Critics argue his warnings, while directionally correct at cycle peaks, arrived too early to be practically actionable. This is not a dismissal of the current warning; it is the context every reader needs to calibrate how to use it.
Hussman’s argument extends beyond equity-market mechanics into the macroeconomic plumbing underneath them. Three interlocking debt dynamics form the foundation:
The U.S. Treasury Fiscal Data tracking total federal debt outstanding reports daily figures confirming the total public debt has exceeded $38 trillion as of April 2026, the official baseline underpinning Hussman’s argument that current corporate profit margins are being partially sustained by public borrowing rather than productivity gains alone.
$38 trillion in total U.S. federal debt as of April 2026, per the U.S. Treasury Department.
The implication is direct: any serious move toward fiscal discipline, whether through spending cuts or reduced deficit spending, would compress corporate profit margins from their current elevated levels. That compression would function as a correction catalyst for stocks priced on the assumption that margins persist.
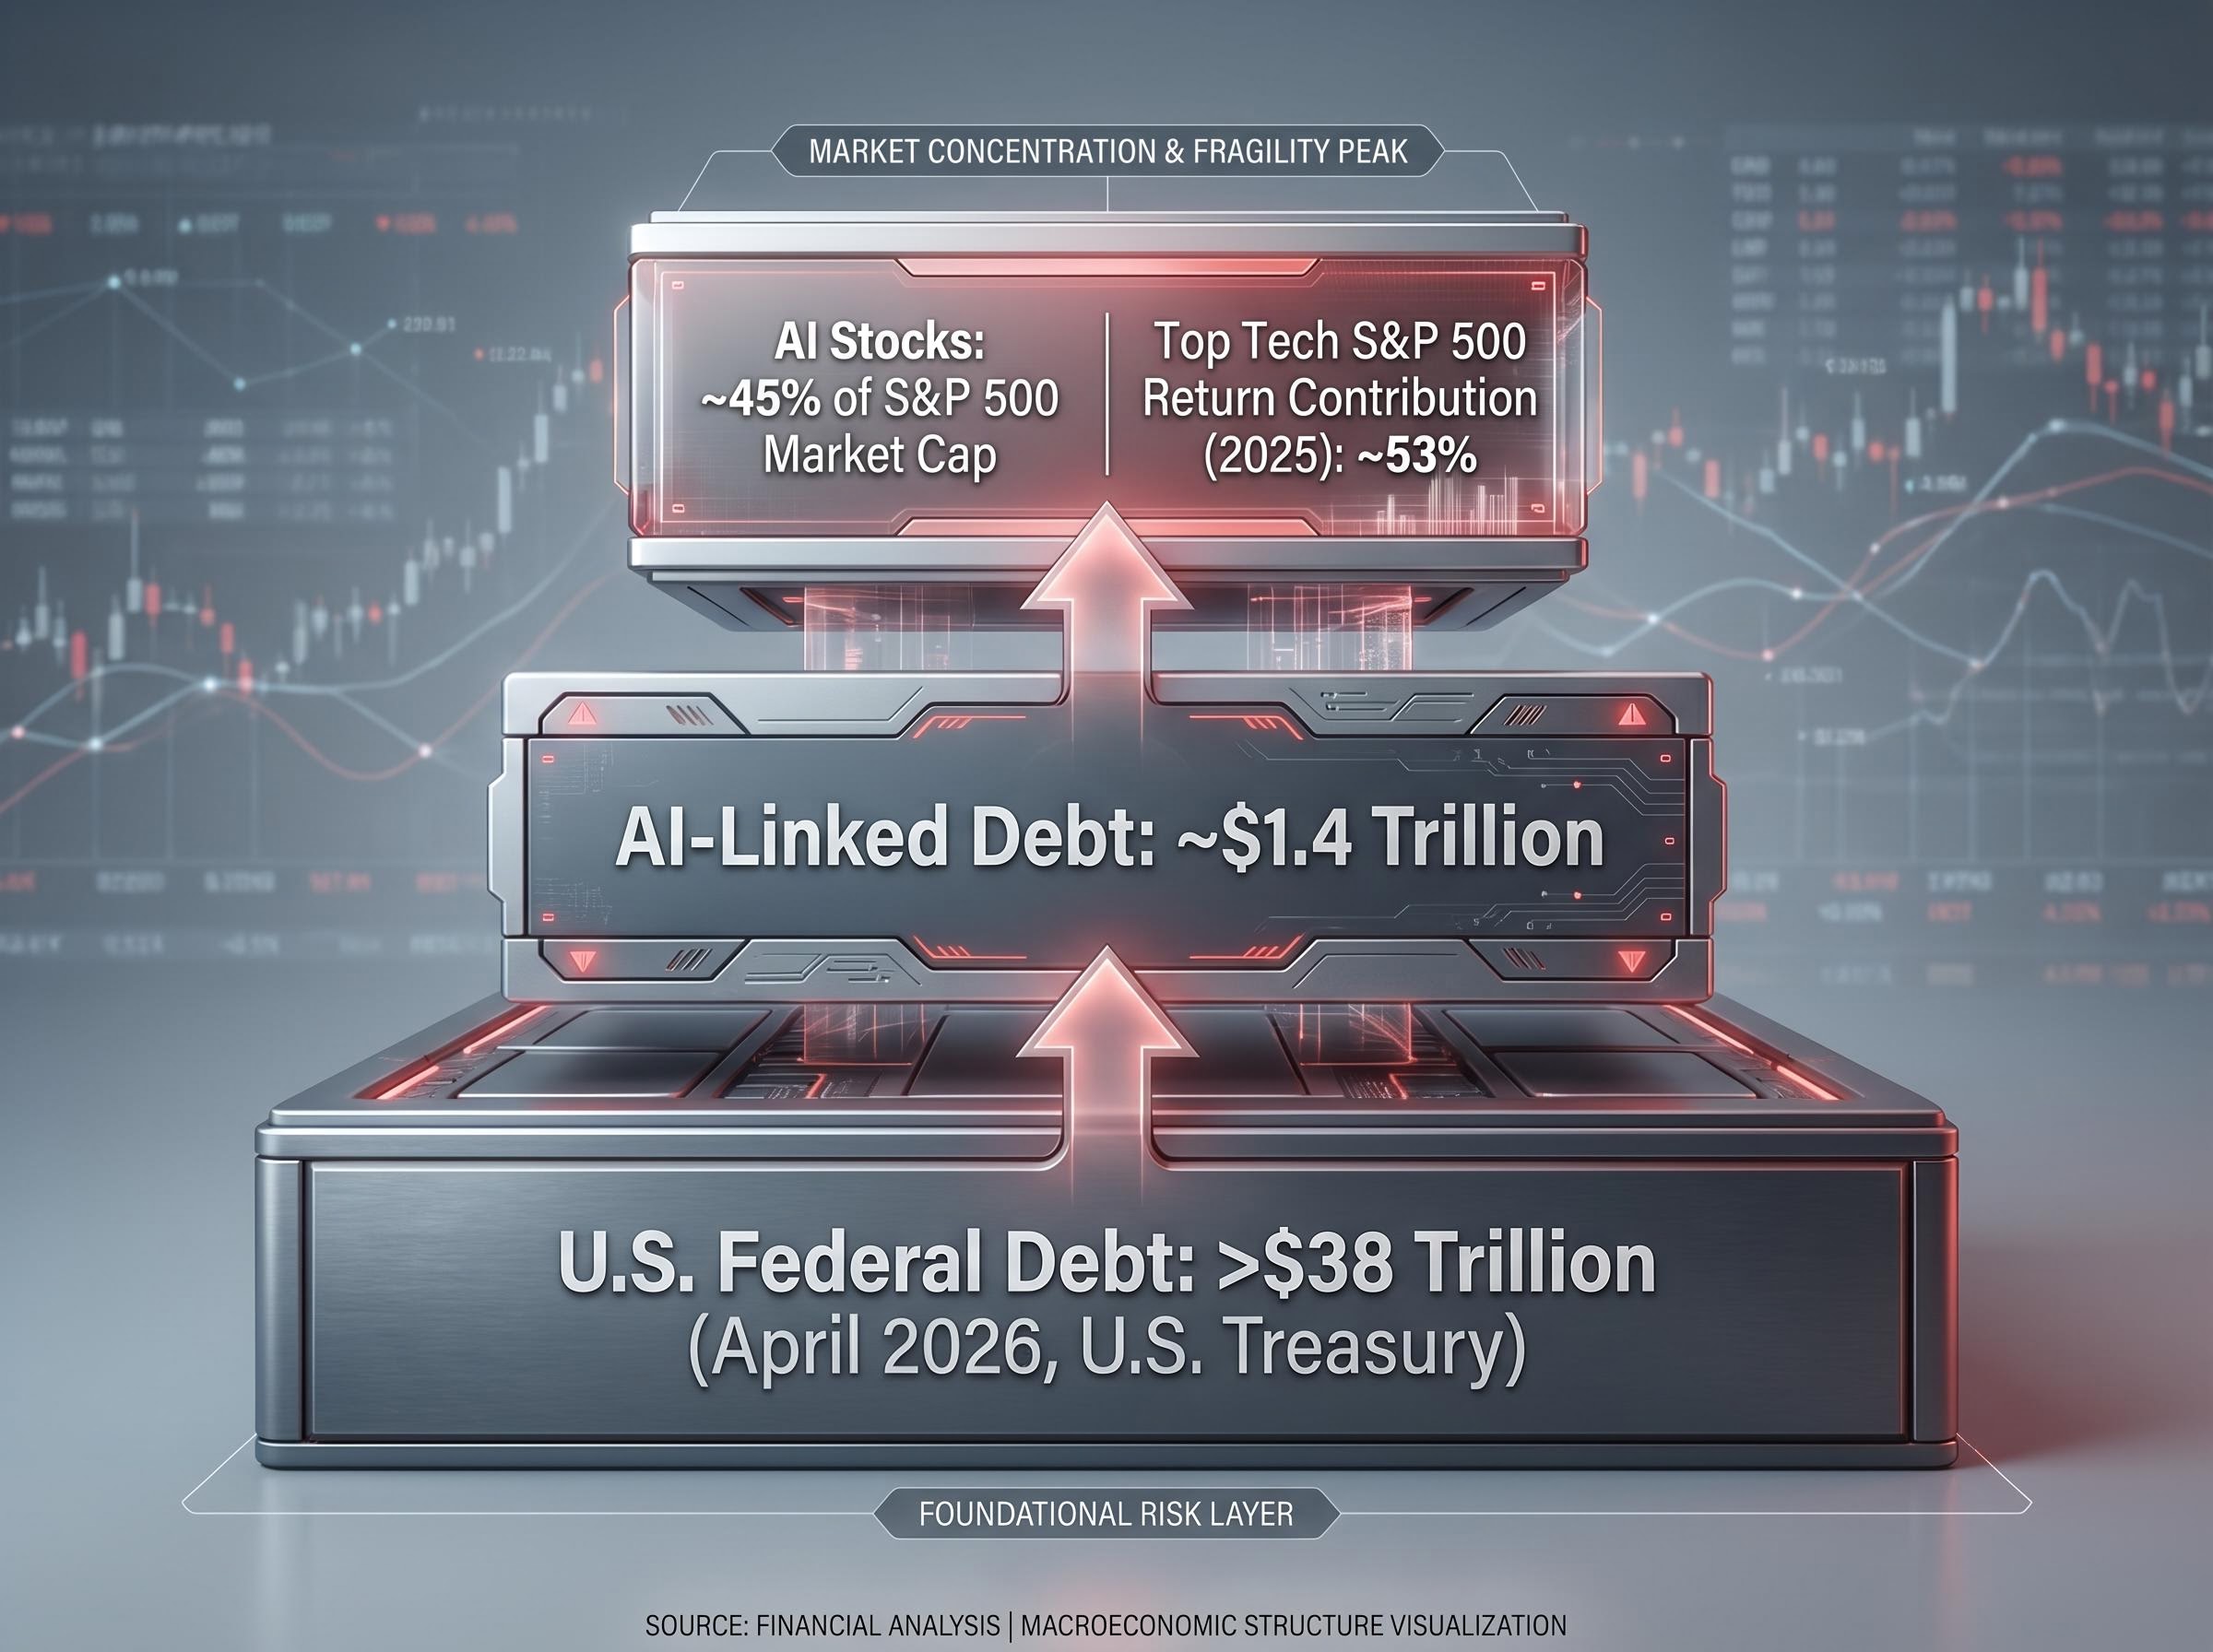
Top technology stocks drove approximately 53% of the S&P 500’s total return in 2025. If the debt foundation shifts, the most concentrated names carry the most concentrated risk.
The bearish camp extends beyond Hussman. Michael Burry, the investor behind “The Big Short,” has taken positions betting against AI stocks. Capital Economics has predicted a tech bubble burst, citing overvaluation metrics and concentration risk. These are not fringe voices.
The bullish camp, however, rests its case on specific fundamentals:
Microsoft’s forward multiple and Azure growth trajectory form the core of the bullish rebuttal to Hussman’s framework at the individual stock level: a forward P/E of approximately 22 times with a PEG ratio of 0.92, combined with Azure revenue growing 39% year-over-year and Copilot seats expanding 160% annually, suggests the earnings delivery bulls are pointing to is real, not purely narrative-driven.
The unresolved question sits between these two camps: whether AI-linked revenue growth will eventually justify current valuations, or whether the growth trajectory is already priced in at levels that make a severe correction mathematically likely. The honest answer is that the available evidence supports both readings, and the resolution will come from earnings delivery over the next several quarters, not from either camp’s conviction alone.
Hussman’s diagnosis, historically extreme valuations, a structurally fragile debt foundation, and a Ponzi-like dependence on new buyers, carries genuine analytical weight. His track record on identifying bubble conditions is strong. His track record on timing is not.
The bullish case rests on real earnings momentum, not speculation. Both positions deserve serious consideration rather than a premature verdict.
For investors monitoring the situation, three indicators are most relevant to Hussman’s thesis: the MarketCap/GVA ratio’s trajectory, any further rotation out of AI-concentrated positions into sectors like energy and materials, and whether AI revenue growth rates begin to decelerate against the expectations embedded in current prices.
For investors who find Hussman’s structural argument compelling and want to understand the portfolio response in practical terms, our comprehensive walkthrough of the investment case for international stocks at current US valuation levels covers three independent asset manager return projections, the 2026 year-to-date outperformance of MSCI EM and EAFE, and a proportionate allocation framework for reducing US concentration risk without abandoning it entirely.
This article is for informational purposes only and should not be considered financial advice. Investors should conduct their own research and consult with financial professionals before making investment decisions. Past performance does not guarantee future results. Financial projections are subject to market conditions and various risk factors.
John Hussman, president of Hussman Investment Trust, published a commentary on 26 April 2026 arguing that AI-driven valuations have reached historically unprecedented levels, with current investors relying on future buyers bidding prices higher rather than on underlying cash flows, a dynamic he compares to a Ponzi scheme.
Hussman uses the MarketCap/GVA ratio, which compares total stock market capitalisation to the gross value added by corporate and financial sectors, arguing it is more reliable than P/E ratios because it cannot be distorted by temporarily elevated profit margins.
AI stocks account for approximately 45% of S&P 500 market capitalisation as of 2026, a concentration level Hussman explicitly compares to the narrow market leadership present before the 1929 crash, while the narrative-driven valuation expansion mirrors the 2000 dot-com peak, with the added layer of $1.4 trillion in AI-linked debt.
Bulls point to real earnings delivery, including 44% EPS growth in the information technology sector in Q1 2026 and Nvidia reporting $44.1 billion in quarterly revenue, arguing this cycle differs from 2000 because the underlying growth is generating actual cash flows, not just promises.
Investors should monitor the trajectory of the MarketCap/GVA ratio, any sustained rotation out of AI-concentrated positions into sectors like energy and materials, and whether AI revenue growth rates begin to decelerate relative to the expectations already priced into current stock valuations.


