
How Dual-Class Shares Put $24 Billion in Gulf Capital at Arm’s Length
23 hrs ago

International stocks have outperformed U.S. equities since the start of 2025, and VXUS has returned 34.43% over the past year as of 25 April 2026. That is not a sentence most U.S. investors expected to write. After more than a decade of U.S. equity dominance, a confluence of elevated domestic valuations, geopolitical friction, and dollar dynamics is prompting serious portfolio rebalancing conversations. VXUS, the Vanguard Total International Stock ETF, is the most prominent single-fund answer to that question. This analysis cuts through the fund data to answer a specific question: is VXUS the right tool for international diversification, and if so, how should it fit into a U.S. investor’s portfolio?
The U.S. equity record over the past decade has been difficult to argue with. The S&P 500 delivered a cumulative total return of 305% over the ten-year period ending 23 April 2026, a stretch of dominance that made international allocations feel like a drag on portfolio performance rather than a diversification benefit.
The S&P 500’s 305% cumulative ten-year return has left the index at valuation levels exceeded only during the dot-com era, a comparison that should give pause to any investor running a purely domestic portfolio.
The valuation gap between U.S. and international equities is the structural foundation of the current rotation thesis: the S&P 500 Shiller CAPE sits near 39.75, a level matched only during the dot-com era, while the MSCI EAFE forward P/E of 14.86 and the MSCI EM forward P/E of 11.52 reflect a repricing opportunity that has historically persisted for years once it begins.
Then conditions shifted. International stocks began outperforming U.S. equities from early 2025, according to Bloomberg commentary, and international ETFs drew record inflows through the year with strong continuation into Q1 2026. The question stopped being “why diversify?” and started being “why haven’t I already?”
Several compounding factors have reduced the margin of safety in a U.S.-only portfolio:
For investors considering VXUS, this backdrop is not speculation. It is the macro context that makes the fund’s value proposition legible.
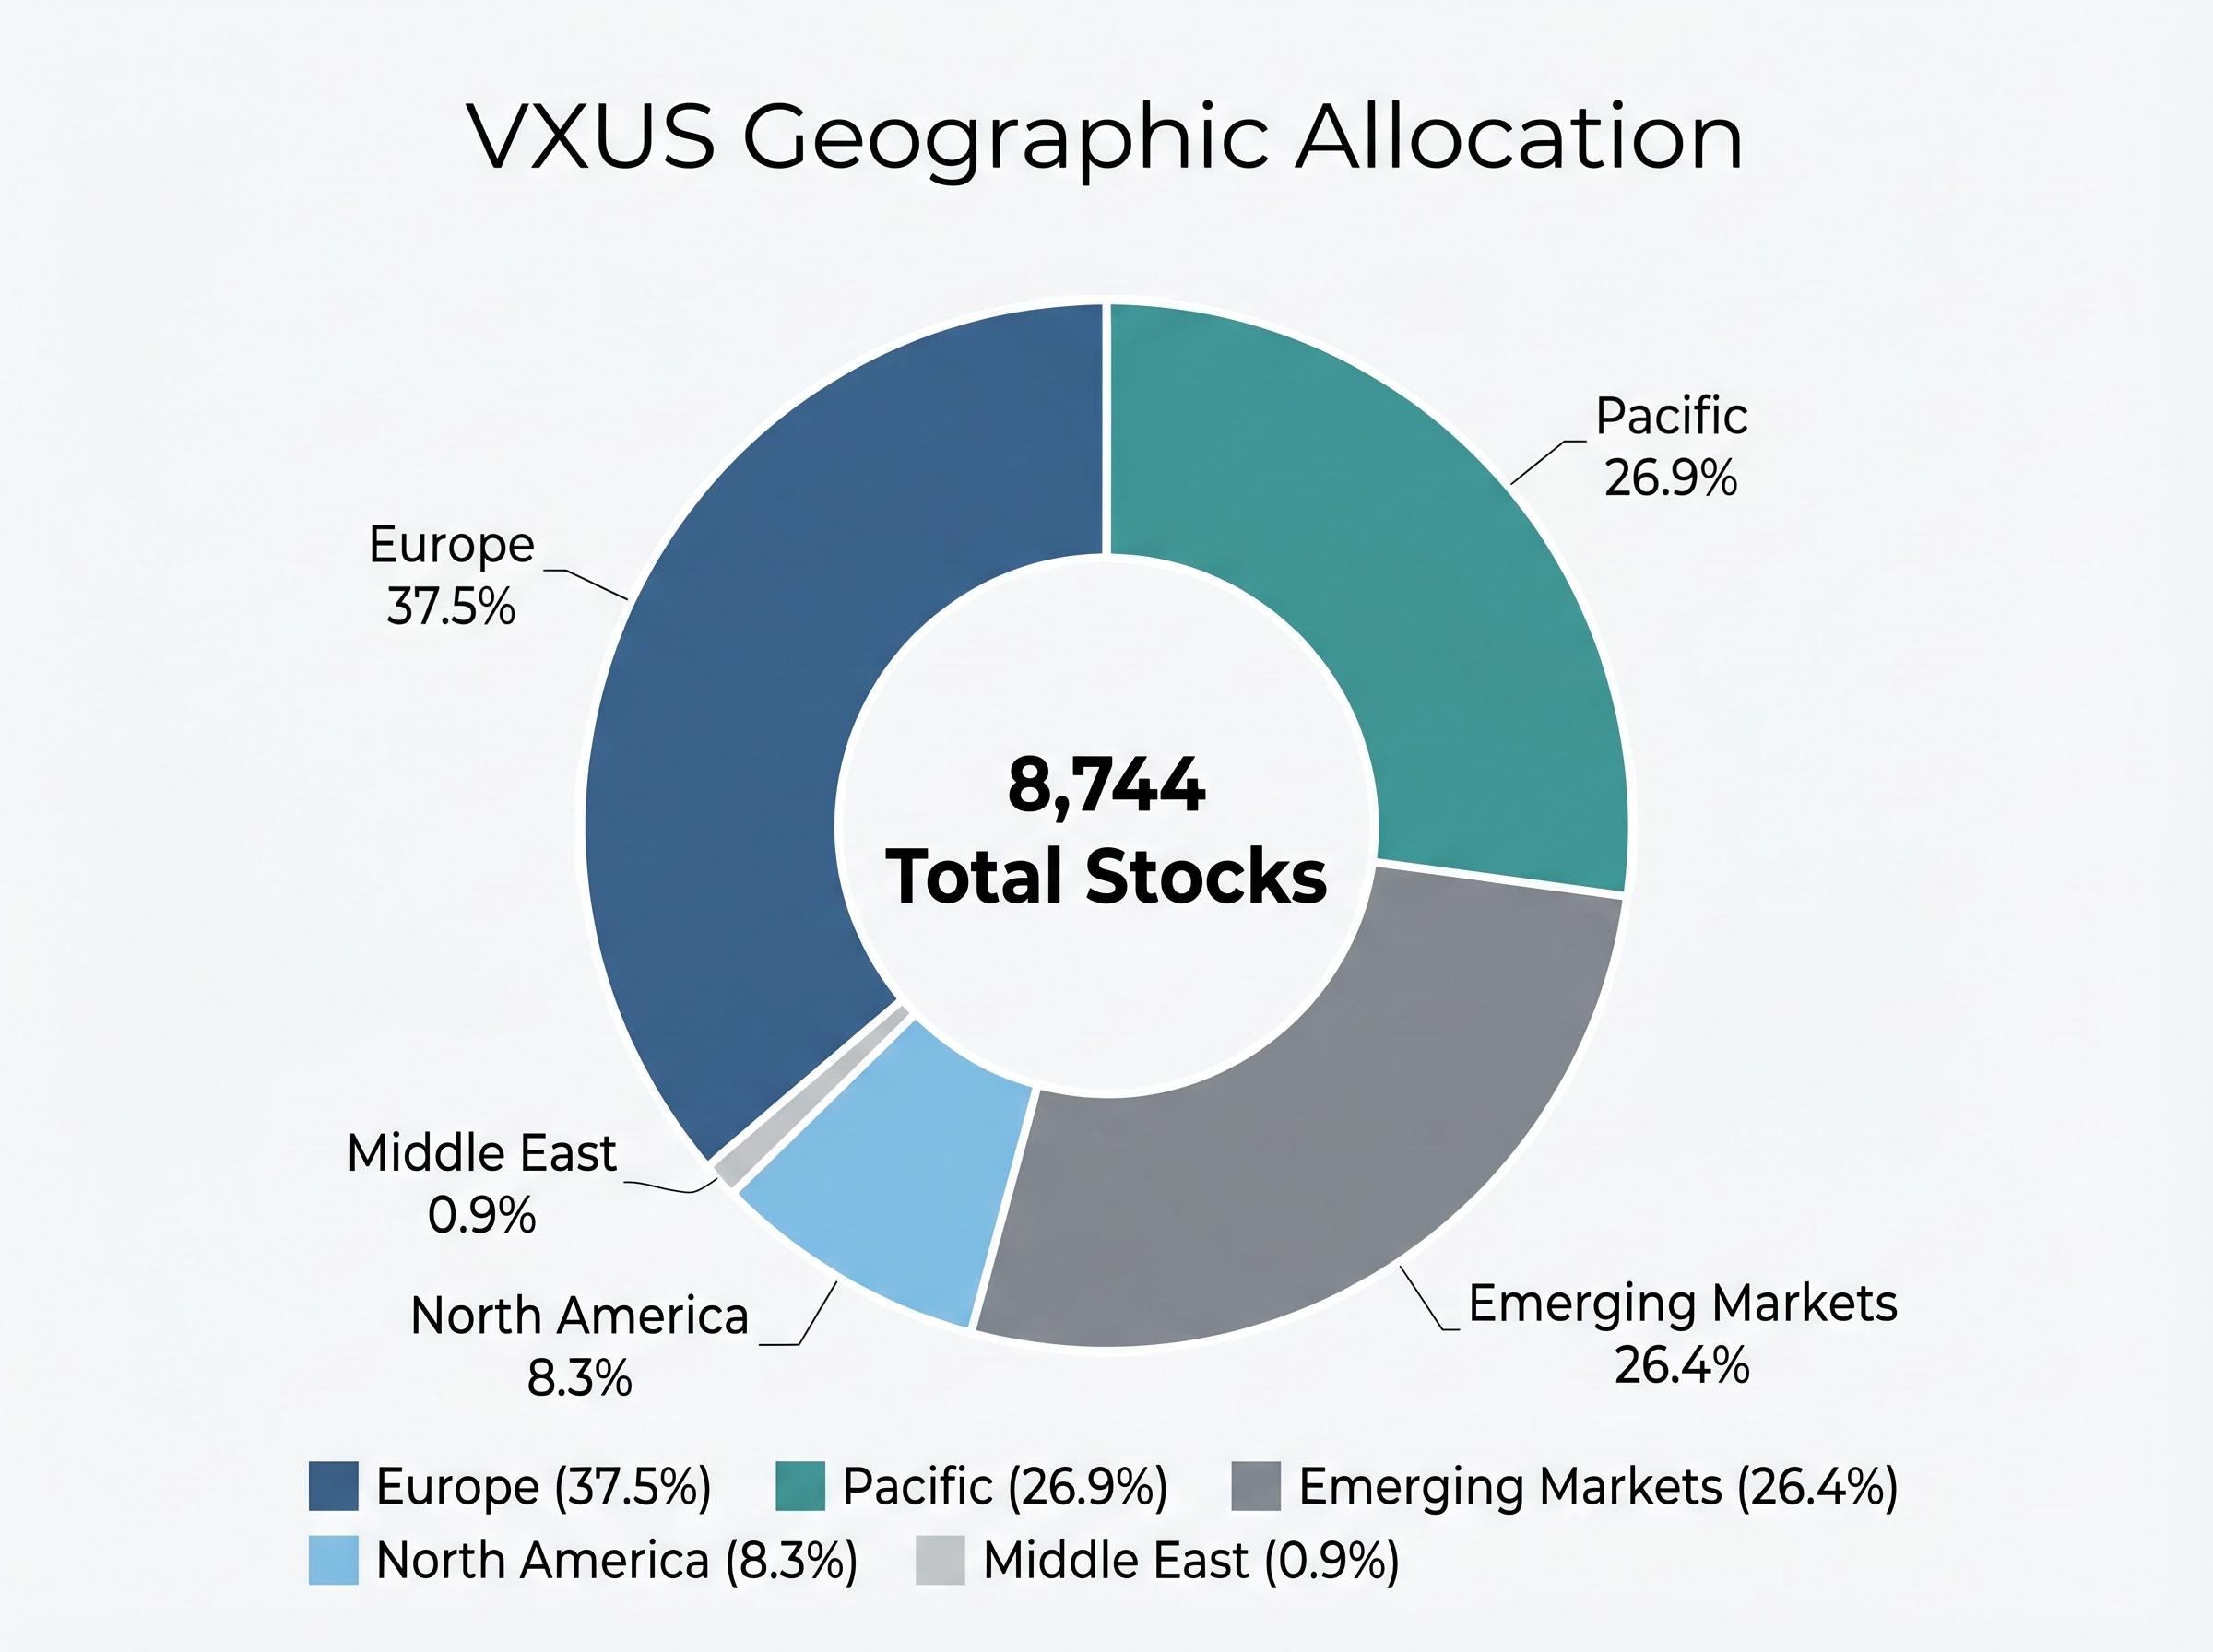
VXUS tracks total international equity markets outside the United States, covering both developed and emerging markets in a single fund. That breadth is a deliberate design choice. Where narrower international products force investors to choose between, say, a European ETF and an emerging markets ETF, VXUS holds 8,744 stocks across both categories as of 25 April 2026, with assets under management of $142.8 billion.
The fund’s expense ratio sits at 0.05%, confirmed as of 27 February 2026, making it one of the cheapest ways to access the entire ex-U.S. equity universe.
The geographic allocation reflects global market capitalisation rather than editorial country selection:
The country-level composition of VXUS across 47 markets introduces concentration dynamics that the regional allocation table does not fully capture: Japan alone accounts for 15.3% of assets, while China and Taiwan together represent roughly 15%, meaning that geopolitical developments across East Asia carry meaningful weight even inside a fund with 8,744 positions.
| Region | Allocation (%) |
|---|---|
| Europe | 37.5% |
| Pacific | 26.9% |
| Emerging Markets | 26.4% |
| North America | 8.3% |
| Middle East | 0.9% |
Morningstar assigned VXUS a Gold rating on 14 October 2025, describing the fund’s core strength as “wall-to-wall foreign stock exposure.”
The five largest positions are Taiwan Semiconductor Manufacturing Company (TSMC) at 3.45%, Samsung at 1.35%, ASML at 1.27%, Tencent at 0.96%, and SK Hynix at 0.75%. The top 10 holdings combined represent just 13.21% of total assets.
All three of the largest positions are semiconductor or semiconductor-adjacent companies, creating a sector theme worth monitoring. TSMC’s 3.45% weight also introduces geopolitical exposure tied to Taiwan, though the concentration risk is materially different in a fund holding 8,744 names than it would be in a 50-stock portfolio. The breadth is the point: it absorbs single-stock risk by design.
The performance case for VXUS builds across multiple time frames, and the acceleration is visible when the data is layered sequentially.
| Time Period | Total Return (%) |
|---|---|
| YTD (as of 25 April 2026) | +9.45% |
| 1-Year (as of 25 April 2026) | +34.43% |
| 2023 Full Year (market price) | +15.92% |
VXUS closed at $82.42 on 24 April 2026, within striking distance of its 52-week high of $84.09 reached on 25 February 2026. For context, the fund traded at $74.63 as recently as 30 March 2026, representing more than 10% appreciation in approximately four weeks.
A 34.43% one-year return is striking on its own. The valuation underpinning that return is what makes it worth examining further: a P/E of 16.9x and a P/B of 2.1x as of 31 March 2026, sitting well below current U.S. equity multiples.
The valuation metrics are the structural driver behind analyst optimism. This is not momentum chasing elevated multiples. International equities are repricing from a lower base, and the gap between ex-U.S. valuations and domestic valuations remains wide.
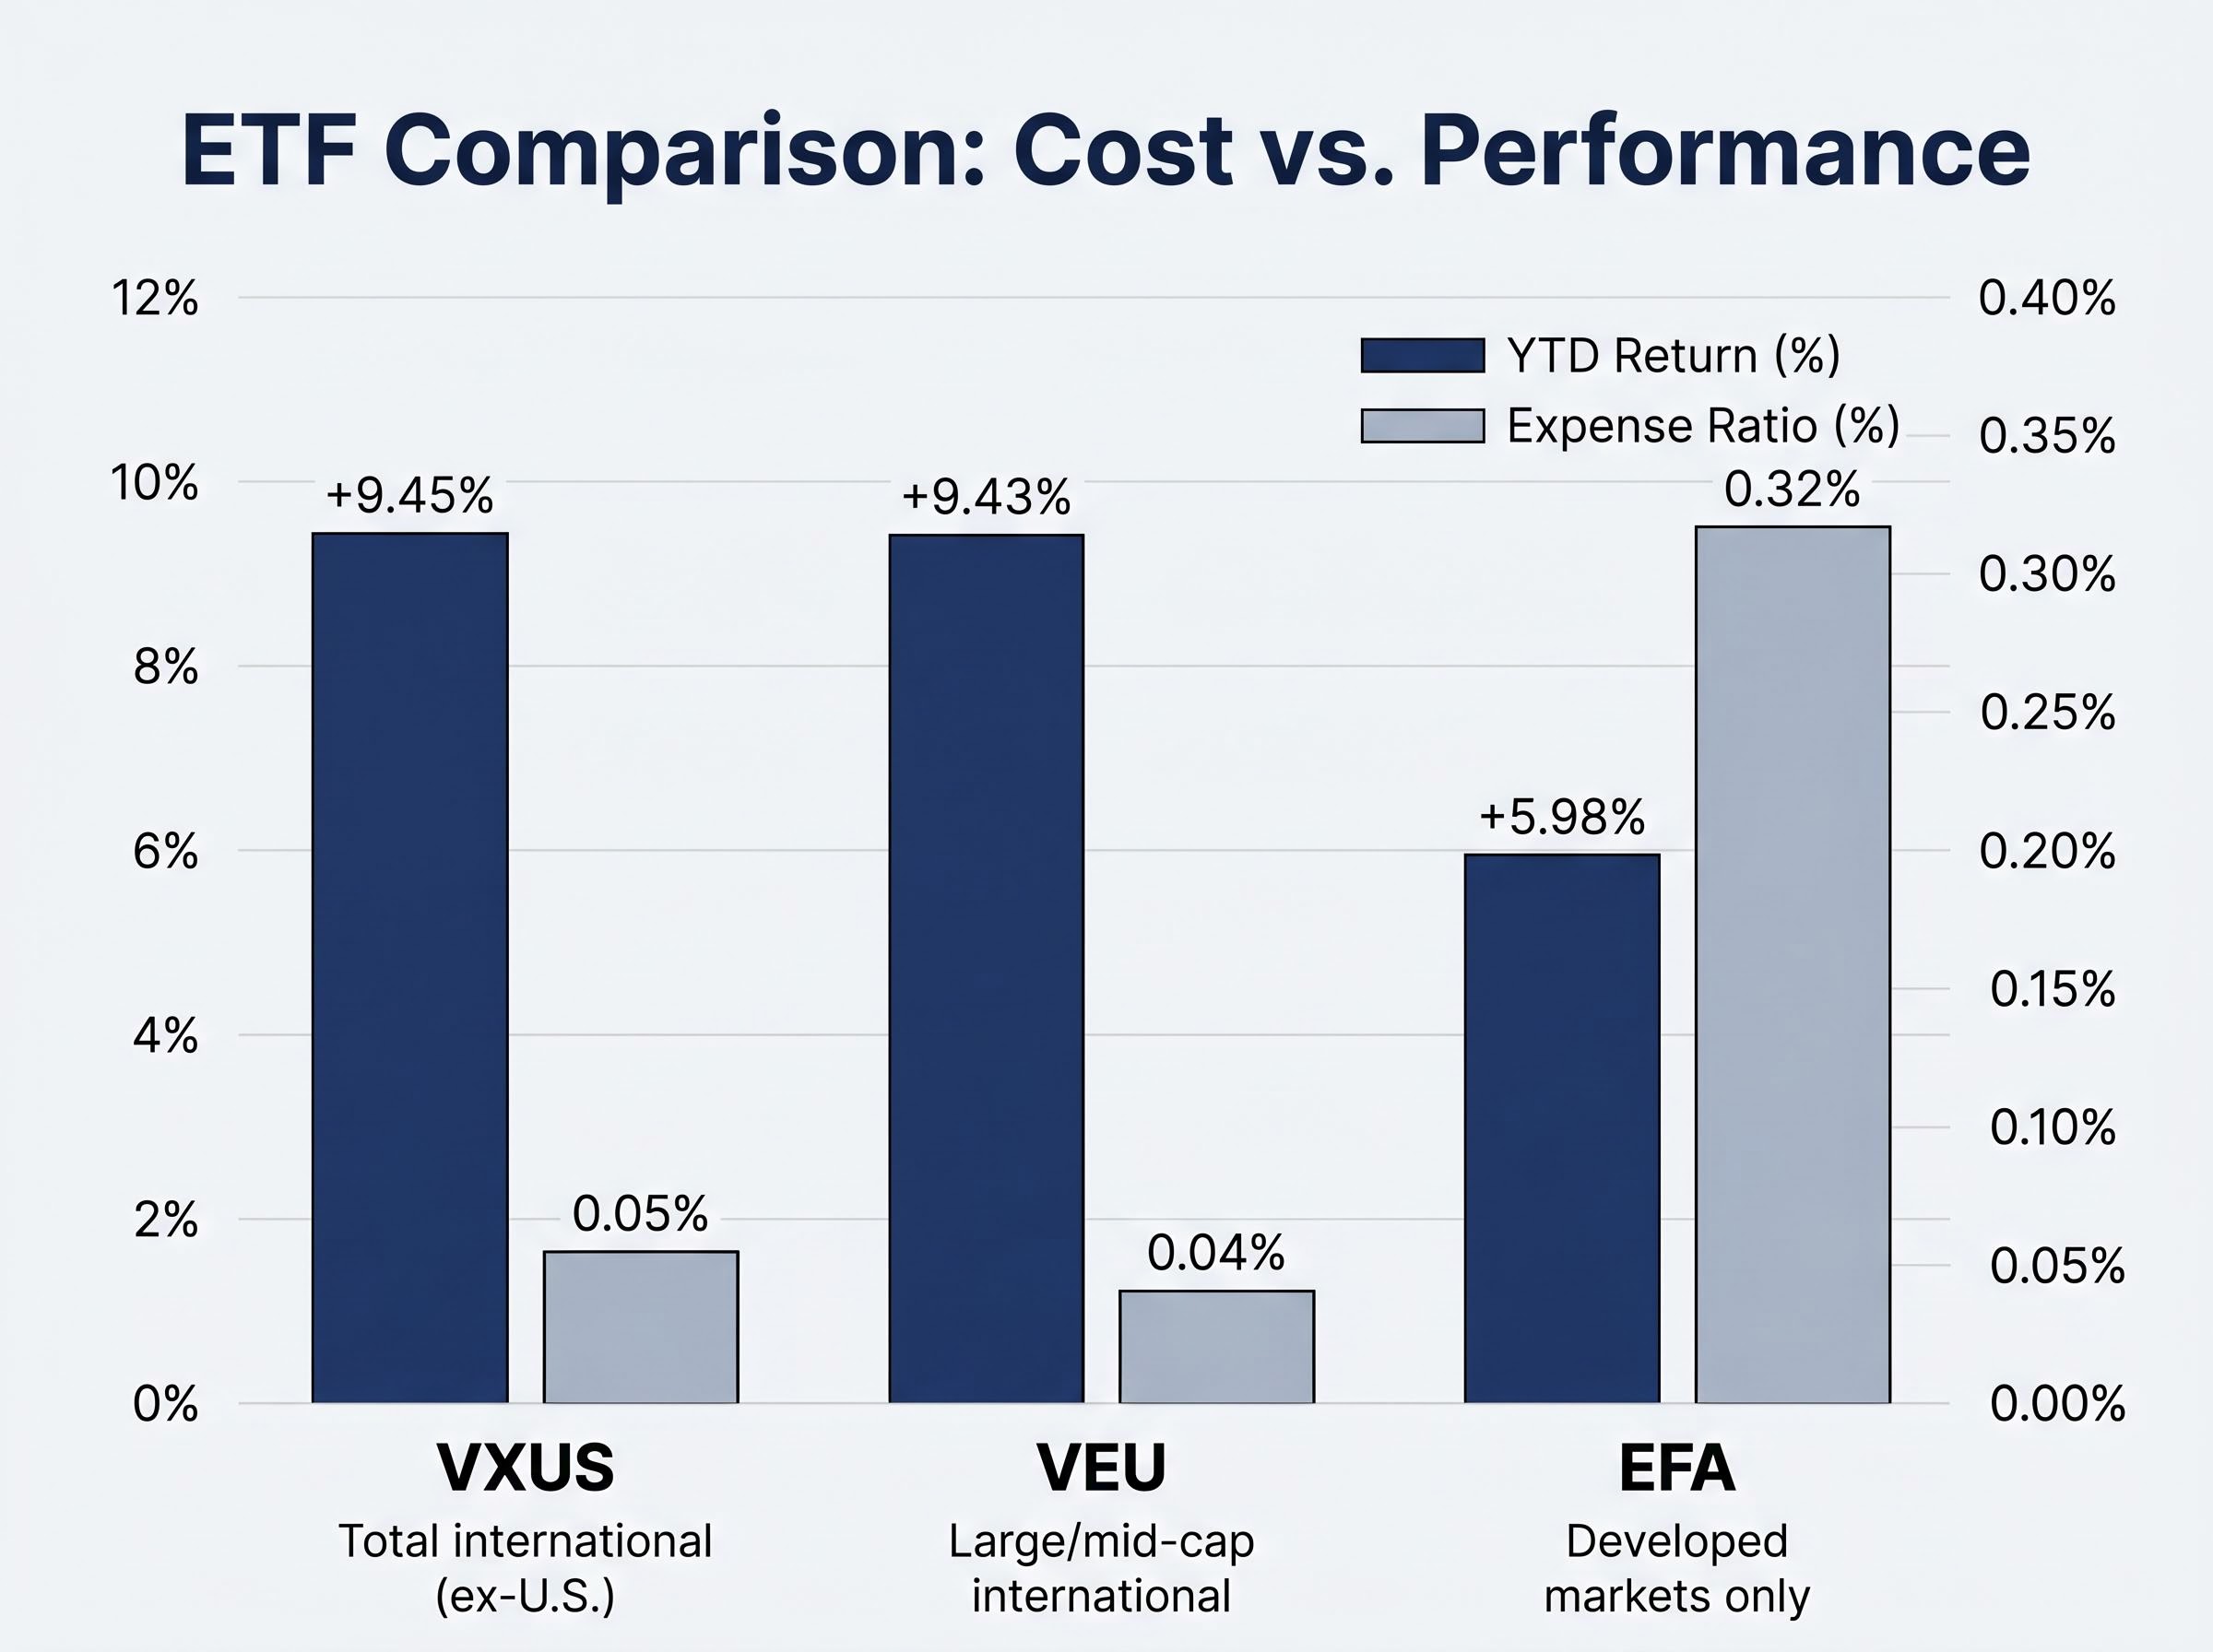
The most relevant comparison starts with Vanguard FTSE All-World ex-US ETF (VEU). At a 0.04% expense ratio and a +9.43% YTD return, VEU is virtually indistinguishable from VXUS on cost and performance. The difference is structural: VXUS tracks the FTSE Global All Cap ex US Index, capturing small-cap international names that VEU’s large- and mid-cap index excludes. For investors who want total market coverage, VXUS delivers marginally broader exposure.
iShares MSCI EAFE ETF (EFA) presents a sharper contrast. Its 0.32% expense ratio is more than six times VXUS’s cost, and its +5.98% YTD return trails by over three percentage points. EFA covers only developed markets, which means investors forgo the 26.4% emerging market allocation that has contributed meaningfully to VXUS’s recent outperformance. The cost drag and scope limitation compound over time.
| ETF | Expense Ratio | YTD Return | Scope | Key Notes |
|---|---|---|---|---|
| VXUS | 0.05% | +9.45% | Total international (ex-U.S.) | 8,744 holdings; $142.8B AUM |
| VEU | 0.04% | +9.43% | Large/mid-cap international | Closest peer on cost and performance |
| EFA | 0.32% | +5.98% | Developed markets only | Higher cost; excludes EM upside |
| IXUS | ~0.07% (unconfirmed) | Not verified | Total international (ex-U.S.) | iShares competitor; verify ER at iShares.com |
iShares Core MSCI Total International Stock ETF (IXUS) is the primary iShares competitor. Its expense ratio is approximately 0.07%, though this figure carries medium confidence and should be confirmed directly at iShares.com. Performance data was not available for direct comparison at the time of this analysis. Stock Analysis rated VXUS a Buy in early 2026 with a suggested 10-20% portfolio allocation, citing the valuation discount to U.S. equities and broad, low-cost exposure as key drivers. That recommendation is indicative rather than independently verified.
Each of the following risks is not a generic investing caveat; it connects directly to how this specific fund is built.
The fund’s 52-week range of $63.23 to $84.09 illustrates the volatility bandwidth investors are accepting, a spread of more than 24% from trough to peak within a single year.
VXUS is best suited as a complement to U.S. equity holdings, not a replacement. The appropriate allocation weight depends on existing domestic concentration, risk tolerance, and time horizon.
The practical range is well-bracketed. The Motley Fool has suggested 5% as a starting allocation to international equities, while Stock Analysis’s early 2026 recommendation points to 10-20% for investors with a higher conviction in the ex-U.S. thesis. Individual circumstances determine where within that range a portfolio falls.
Pairing VXUS with VTI in a two-fund portfolio is the most common structural approach for U.S. passive investors seeking complete global equity coverage, with the split between domestic and international weights typically calibrated against an investor’s existing concentration risk rather than derived from a fixed formula.
Several characteristics make VXUS particularly well-suited for specific investor profiles:
VXUS is not the optimal choice for every international allocation strategy:
VXUS delivers what it promises: wall-to-wall international equity exposure at minimal cost, with a Morningstar Gold rating, a 34.43% one-year return, and a P/E of 16.9x that sits well below current U.S. market multiples. In an environment where U.S. valuation risk is structurally elevated and international ETFs are drawing record inflows, this fund is not a speculative bet on overseas markets. It is a systematic, low-friction way to own the rest of the world.
Investors who have been considering an entry point for international diversification now have both a compelling macro backdrop and a fund with a demonstrated track record. The question is less “whether” and more “how much.”
This article is for informational purposes only and should not be considered financial advice. Investors should conduct their own research and consult with financial professionals before making investment decisions. Past performance does not guarantee future results, and all performance figures cited are subject to market conditions and various risk factors.
VXUS is the Vanguard Total International Stock ETF, a passively managed fund that tracks the FTSE Global All Cap ex US Index, holding 8,744 stocks across both developed and emerging markets outside the United States. With $142.8 billion in assets under management and a 0.05% expense ratio, it provides broad, low-cost exposure to the entire ex-U.S. equity universe in a single fund.
As of 25 April 2026, VXUS returned 34.43% over the prior one-year period and gained 9.45% year-to-date, closing at $82.42 on 24 April 2026, near its 52-week high of $84.09. The fund's valuation metrics, a P/E of 16.9x and P/B of 2.1x as of 31 March 2026, remain well below current U.S. equity multiples, suggesting the repricing has been driven by fundamentals rather than multiple expansion.
The practical allocation range cited by analysts runs from 5% as a starting position (per Motley Fool guidance) up to 10-20% for investors with higher conviction in the ex-U.S. thesis (per Stock Analysis's early 2026 recommendation). The right weight depends on your existing U.S. equity concentration, risk tolerance, and investment time horizon.
VEU is the closest peer, with a virtually identical YTD return of 9.43% and a marginally cheaper expense ratio of 0.04%, but it excludes small-cap international stocks that VXUS captures. EFA costs 0.32%, more than six times VXUS's fee, returned only 5.98% YTD, and covers developed markets only, excluding the 26.4% emerging market allocation that has contributed to VXUS's recent outperformance.
The three key risks are currency risk (a strengthening U.S. dollar reduces returns when converting foreign-denominated assets back to USD), geopolitical concentration (TSMC represents 3.45% of the fund and is exposed to Taiwan's geopolitical situation), and emerging market volatility (the 26.4% EM allocation introduces governance risks and higher volatility relative to a developed-markets-only ETF). The fund's 52-week range of $63.23 to $84.09 illustrates the volatility bandwidth investors are accepting.


