
How Hormuz Closure at $104 Oil Is Reshaping Every Asset Class
9 hrs ago

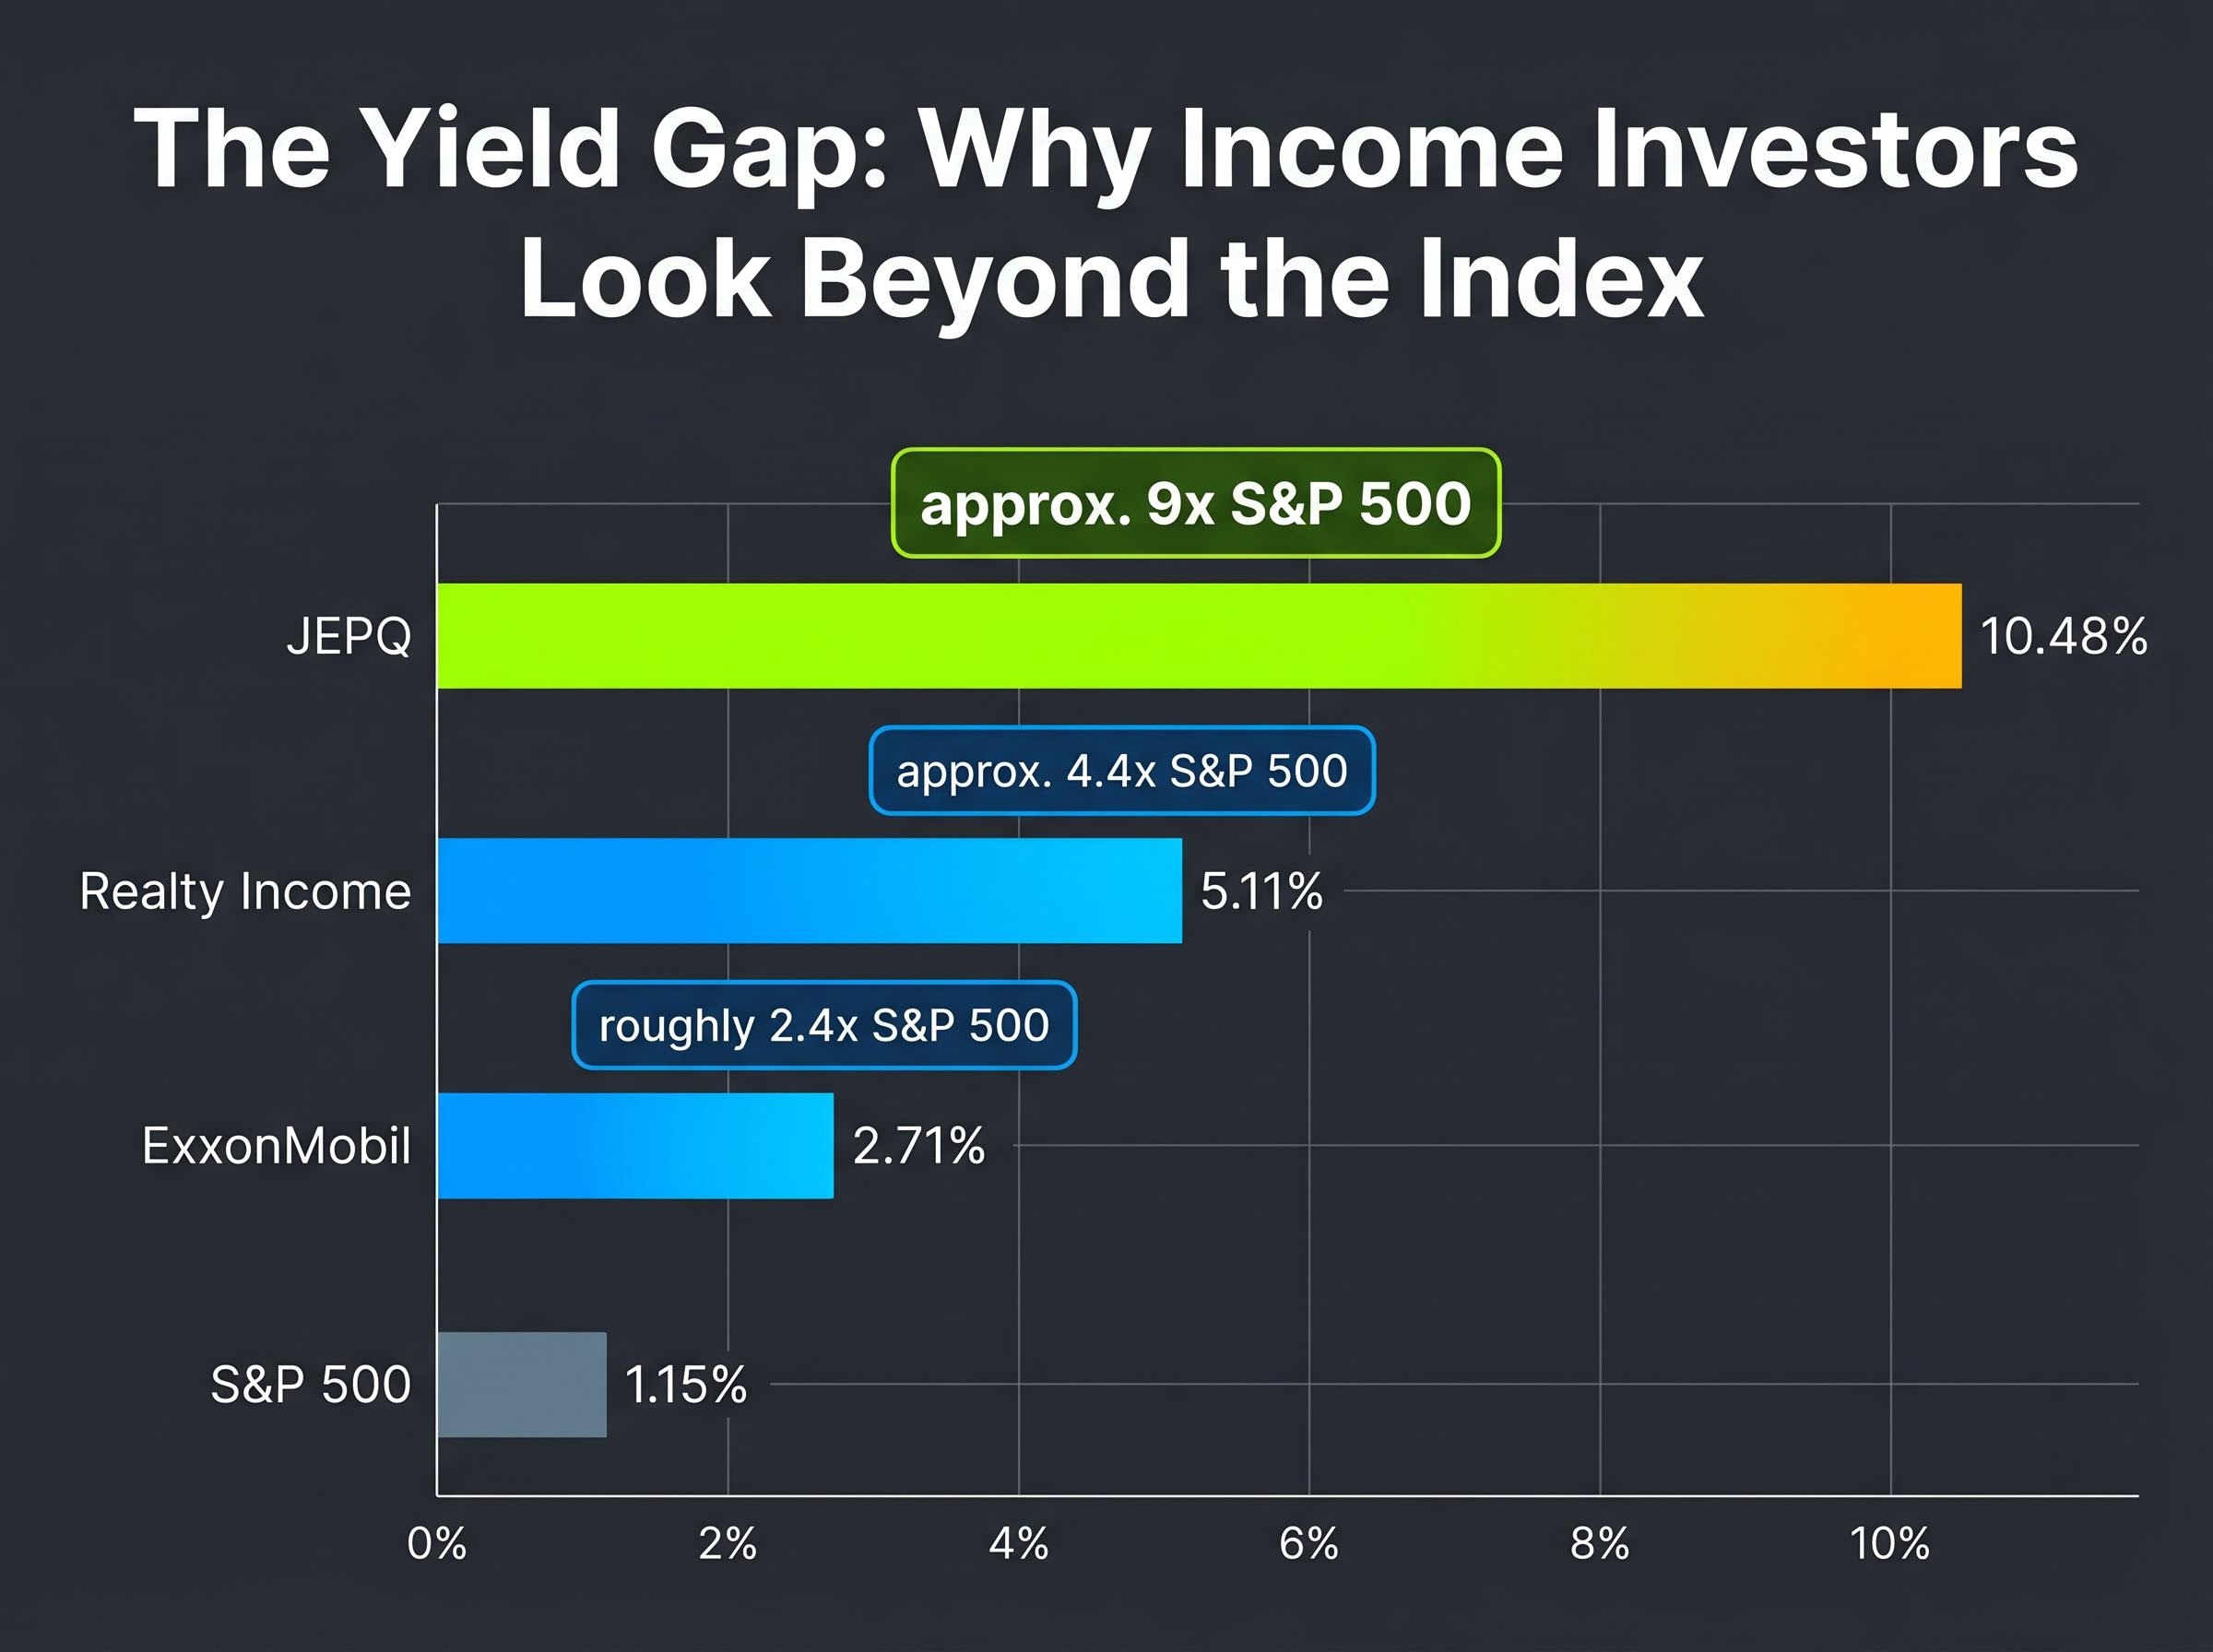
The S&P 500 yields approximately 1.15%. Realty Income yields 5.11%, ExxonMobil yields 2.71%, and JEPQ yields 10.48%. These three securities represent fundamentally different answers to the same question facing dividend income investing in 2026: how does an investor build meaningful cash flow from U.S. equities when the broad market pays so little?
With the Federal Reserve holding rates steady as of April 2026 and potential cuts pushed to late 2026 or beyond, income investors face an environment where higher-for-longer policy simultaneously pressures rate-sensitive vehicles like REITs and elevates the options premiums that power covered call ETFs. The headline yield on each of these three securities tells an incomplete story. What follows is an analysis of exactly how Realty Income, ExxonMobil, and JEPQ generate their income, what each vehicle costs the investor in terms of upside, tax drag, or rate exposure, and which income profile suits which investor type in the current macro environment.
The arithmetic is stark. Realty Income’s 5.11% yield is approximately 4.4 times the S&P 500’s current payout. ExxonMobil’s 2.71% is roughly 2.4 times. JEPQ sits at the far end of the spectrum.
JEPQ’s 10.48% distribution yield is approximately 9 times the S&P 500’s current yield of 1.15%.
The gap has drawn renewed attention in a year where the Fed’s higher-for-longer stance has sharpened the trade-off between current income and uncertain capital appreciation. With rate cuts pushed to late 2026 at the earliest, the argument for locking in tangible yield rather than waiting for growth to compound has gained traction among investors who might otherwise default to broad index exposure.
The Federal Reserve’s March 2026 FOMC statement holding rates at 3.50% to 3.75% cited elevated inflation as the primary constraint on easing, establishing the policy baseline that simultaneously pressures REIT valuations through cap rate dynamics and inflates the options premiums powering JEPQ’s distributions.
These three vehicles represent three distinct income philosophies, not just three tickers:
Understanding which philosophy is doing the work behind each yield figure is the first step in deciding whether to act on the gap.
ExxonMobil’s dividend is the most familiar structure of the three. The company generated $52 billion in operating cash flow and $28.8 billion in net earnings in fiscal 2025. That operational engine has funded 43 consecutive years of dividend increases, earning Dividend Aristocrat status. The yield is lower than the other two vehicles, but the cash generation underpinning it is straightforward: sell hydrocarbons, generate free cash flow, return a growing portion to shareholders.
Realty Income’s structure requires a different analytical lens. As a real estate investment trust (a REIT, a corporate structure whose governing rules mandate that at least 90% of taxable income must be paid out to shareholders), Realty Income’s earnings-based payout ratio of approximately 276% appears alarming at first glance. It is not. REITs carry large non-cash depreciation charges that depress reported earnings without affecting the cash available for dividends. The correct sustainability metric is the Adjusted Funds From Operations (AFFO) payout ratio, which stands at 75.53%, indicating healthy coverage. Realty Income has made 670 consecutive monthly payments and delivered 134 dividend increases since its NYSE listing in 1994.
JEPQ operates through a mechanism less familiar to most equity investors. The ETF’s income generation follows a three-step loop:
Options Industry Council documentation on covered call mechanics and premium income confirms that the option seller collects the premium at inception regardless of subsequent price movement, with the corresponding obligation to deliver shares at the strike price representing the precise upside cap that defines JEPQ’s return profile in strongly rising markets.
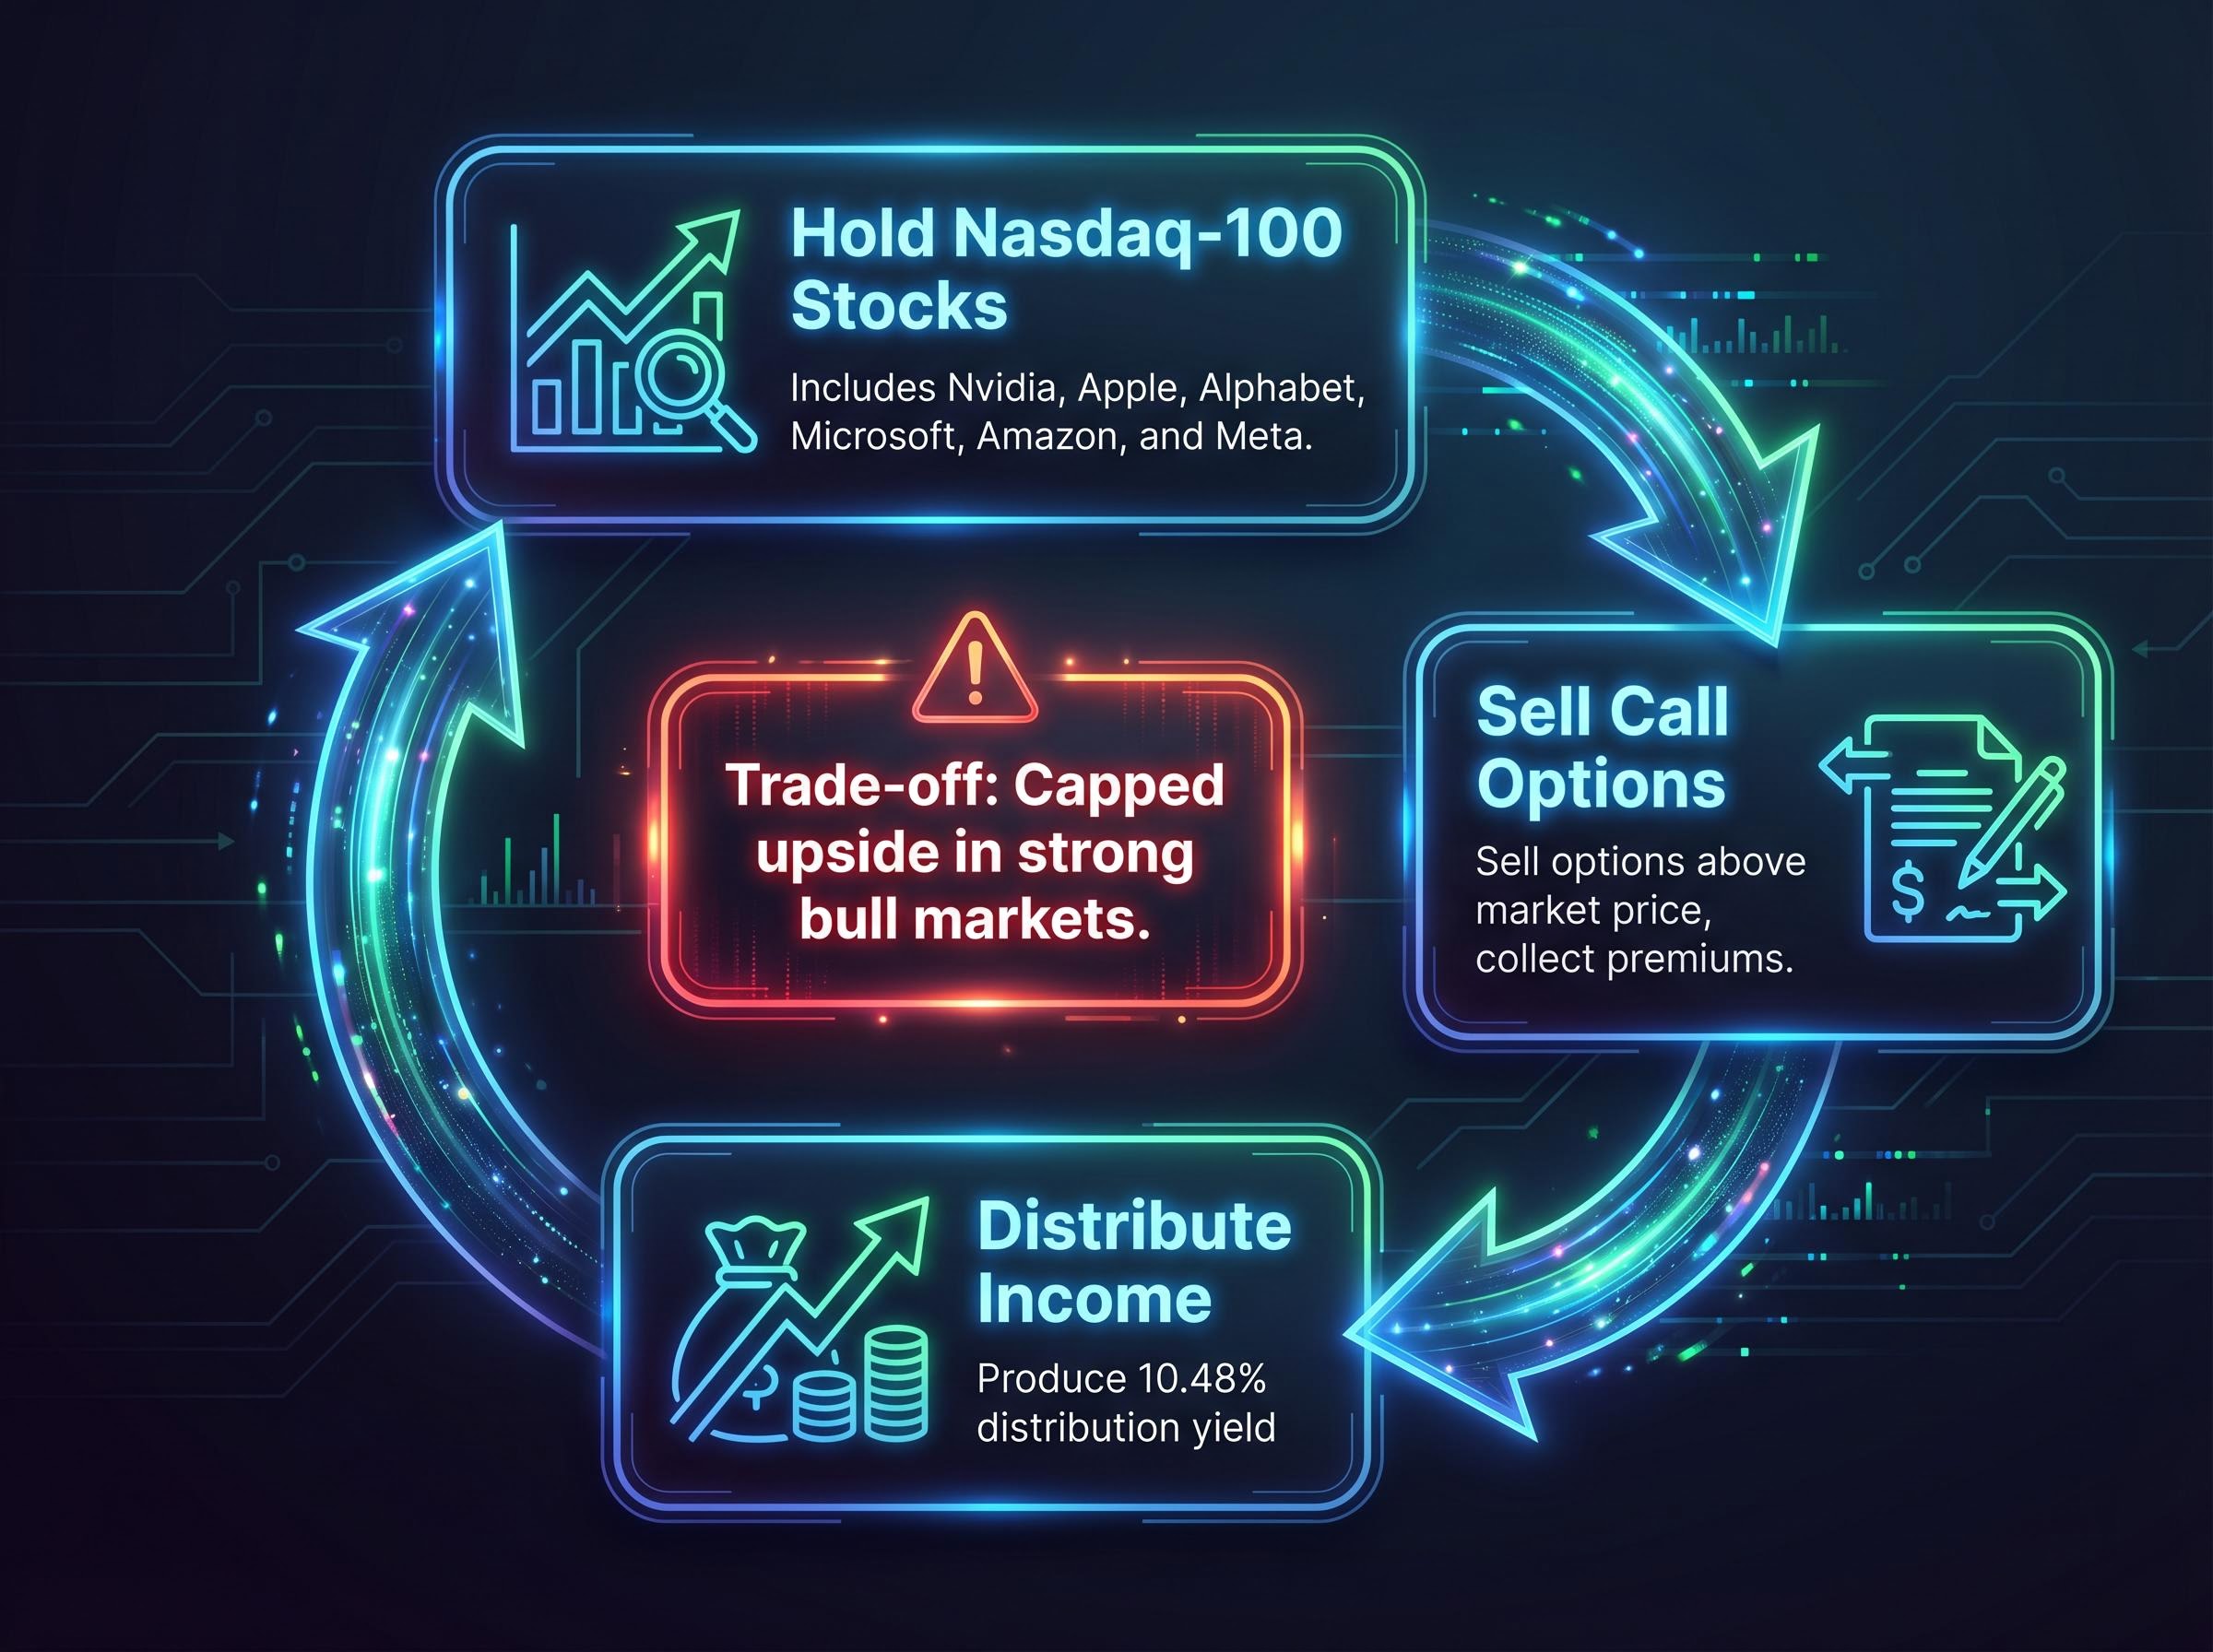
The trade-off is built into the mechanics. If the underlying stocks rise above the strike price, JEPQ’s participation in that upside is capped, because the gains above the strike belong to the option buyer. The income is real, but it comes at the cost of full capital appreciation in strongly rising markets.
Every yield carries a cost structure. The table below maps the three vehicles against their primary trade-off and the market environment where each performs best.
| Security | Yield | Primary Trade-off | Best Market Environment |
|---|---|---|---|
| Realty Income (O) | 5.11% | Interest rate sensitivity on valuation and borrowing costs | Falling or stable rate environments; sideways equity markets |
| ExxonMobil (XOM) | 2.71% | Lowest current yield of the three; income advantage over S&P 500 is narrower | Energy demand growth; longer time horizons where dividend compounding rewards patience |
| JEPQ | 10.48% | Capped upside in strong bull markets | High volatility, sideways, or declining markets |
The specific cost of each trade-off:
The broader strategic question underneath this comparison is dividend yield versus total return: whether to optimise for immediate cash flow or for compounding growth, a decision that Schwab research found resolves differently across time horizons, with dividend growers outperforming the market by 3.1% annually over 20 years while dividend cutters underperformed by 12.5% annually.
The headline yield comparison changes materially once tax treatment enters the calculation.
For a top-bracket investor holding JEPQ in a taxable account, the 10.48% distribution yield may net out closer to approximately 6.6% after federal tax. The same investor holding JEPQ in a tax-advantaged account (IRA or 401(k)) retains the full distribution yield, sheltered from ordinary income taxation.
This distinction makes account location a first-order decision, not a secondary detail. JEPQ generates its most efficient after-tax yield when held in a tax-advantaged account. ExxonMobil’s qualified dividends, by contrast, are already tax-advantaged in taxable accounts, making it less sensitive to account placement.
The right income vehicle depends on the investor holding it. Three profiles emerge from the analysis:
The three vehicles are complementary rather than competing. Realty Income provides monthly income stability and real estate diversification. ExxonMobil delivers dividend growth reliability and energy sector exposure with capital appreciation potential. JEPQ, held in a tax-advantaged account, harvests high current income from elevated volatility.
Combining all three reduces single-vehicle concentration risk while blending growth, stability, and income maximisation across different market environments and rate scenarios.
These three vehicles represent structurally different income philosophies. The headline figures of 5.11%, 2.71%, and 10.48% are starting points for analysis, not conclusions.
The AFFO payout ratio, not the earnings-based figure, is the correct lens for evaluating Realty Income’s dividend safety. ExxonMobil’s 43-year increase streak reflects operational discipline over decades; it is the lowest-yield but highest-growth-reliability option of the three. JEPQ’s yield is real, but its after-tax value in a taxable account is materially lower than the headline suggests, making account location a decision that belongs alongside security selection.
The 2026 higher-for-longer rate environment creates specific headwinds for Realty Income and specific tailwinds for JEPQ via elevated premiums. These dynamics are not reflected in trailing yield figures alone. As the Fed’s policy trajectory evolves through late 2026, the relative positioning of all three vehicles will shift, making this framework worth revisiting as rate expectations change.
Investors wanting a structured walkthrough of how these three income vehicles sit within a broader portfolio construction framework will find our dedicated guide to dividend strategies beating the S&P 500’s yield, which covers the yield gap mechanics, AFFO-based safety analysis, and the specific tax treatment distinctions across REIT, qualified dividend, and covered call distributions.
This article is for informational purposes only and should not be considered financial advice. Investors should conduct their own research and consult with financial professionals before making investment decisions. Past performance does not guarantee future results. Financial projections are subject to market conditions and various risk factors.
—
Dividend income investing is a strategy where investors buy securities that regularly distribute cash to shareholders, such as REITs, dividend-growth stocks, or covered call ETFs, to generate recurring income from their portfolio rather than relying solely on capital appreciation.
JEPQ holds Nasdaq-100 stocks and sells call options against those positions, collecting premiums from option buyers regardless of whether the options are exercised; those premiums are then distributed to shareholders, producing a distribution yield of approximately 10.48%.
Realty Income's earnings-based payout ratio of around 276% looks alarming but is misleading because REITs carry large non-cash depreciation charges; the correct metric is the AFFO payout ratio, which stands at 75.53%, indicating healthy dividend coverage.
JEPQ distributions derived from covered call premiums are taxed as ordinary income at rates up to 37%, while ExxonMobil's qualified dividends are eligible for preferential rates of 0%, 15%, or 20%, making ExxonMobil more tax-efficient for investors in taxable accounts.
Realty Income is particularly well-suited to income-dependent investors because it pays monthly dividends, has made 670 consecutive monthly payments, and has delivered 134 dividend increases since its NYSE listing in 1994, providing predictable budgeting regularity.


