
SEC Moves to End Mandatory Quarterly Reporting After 50 Years
7 hrs ago

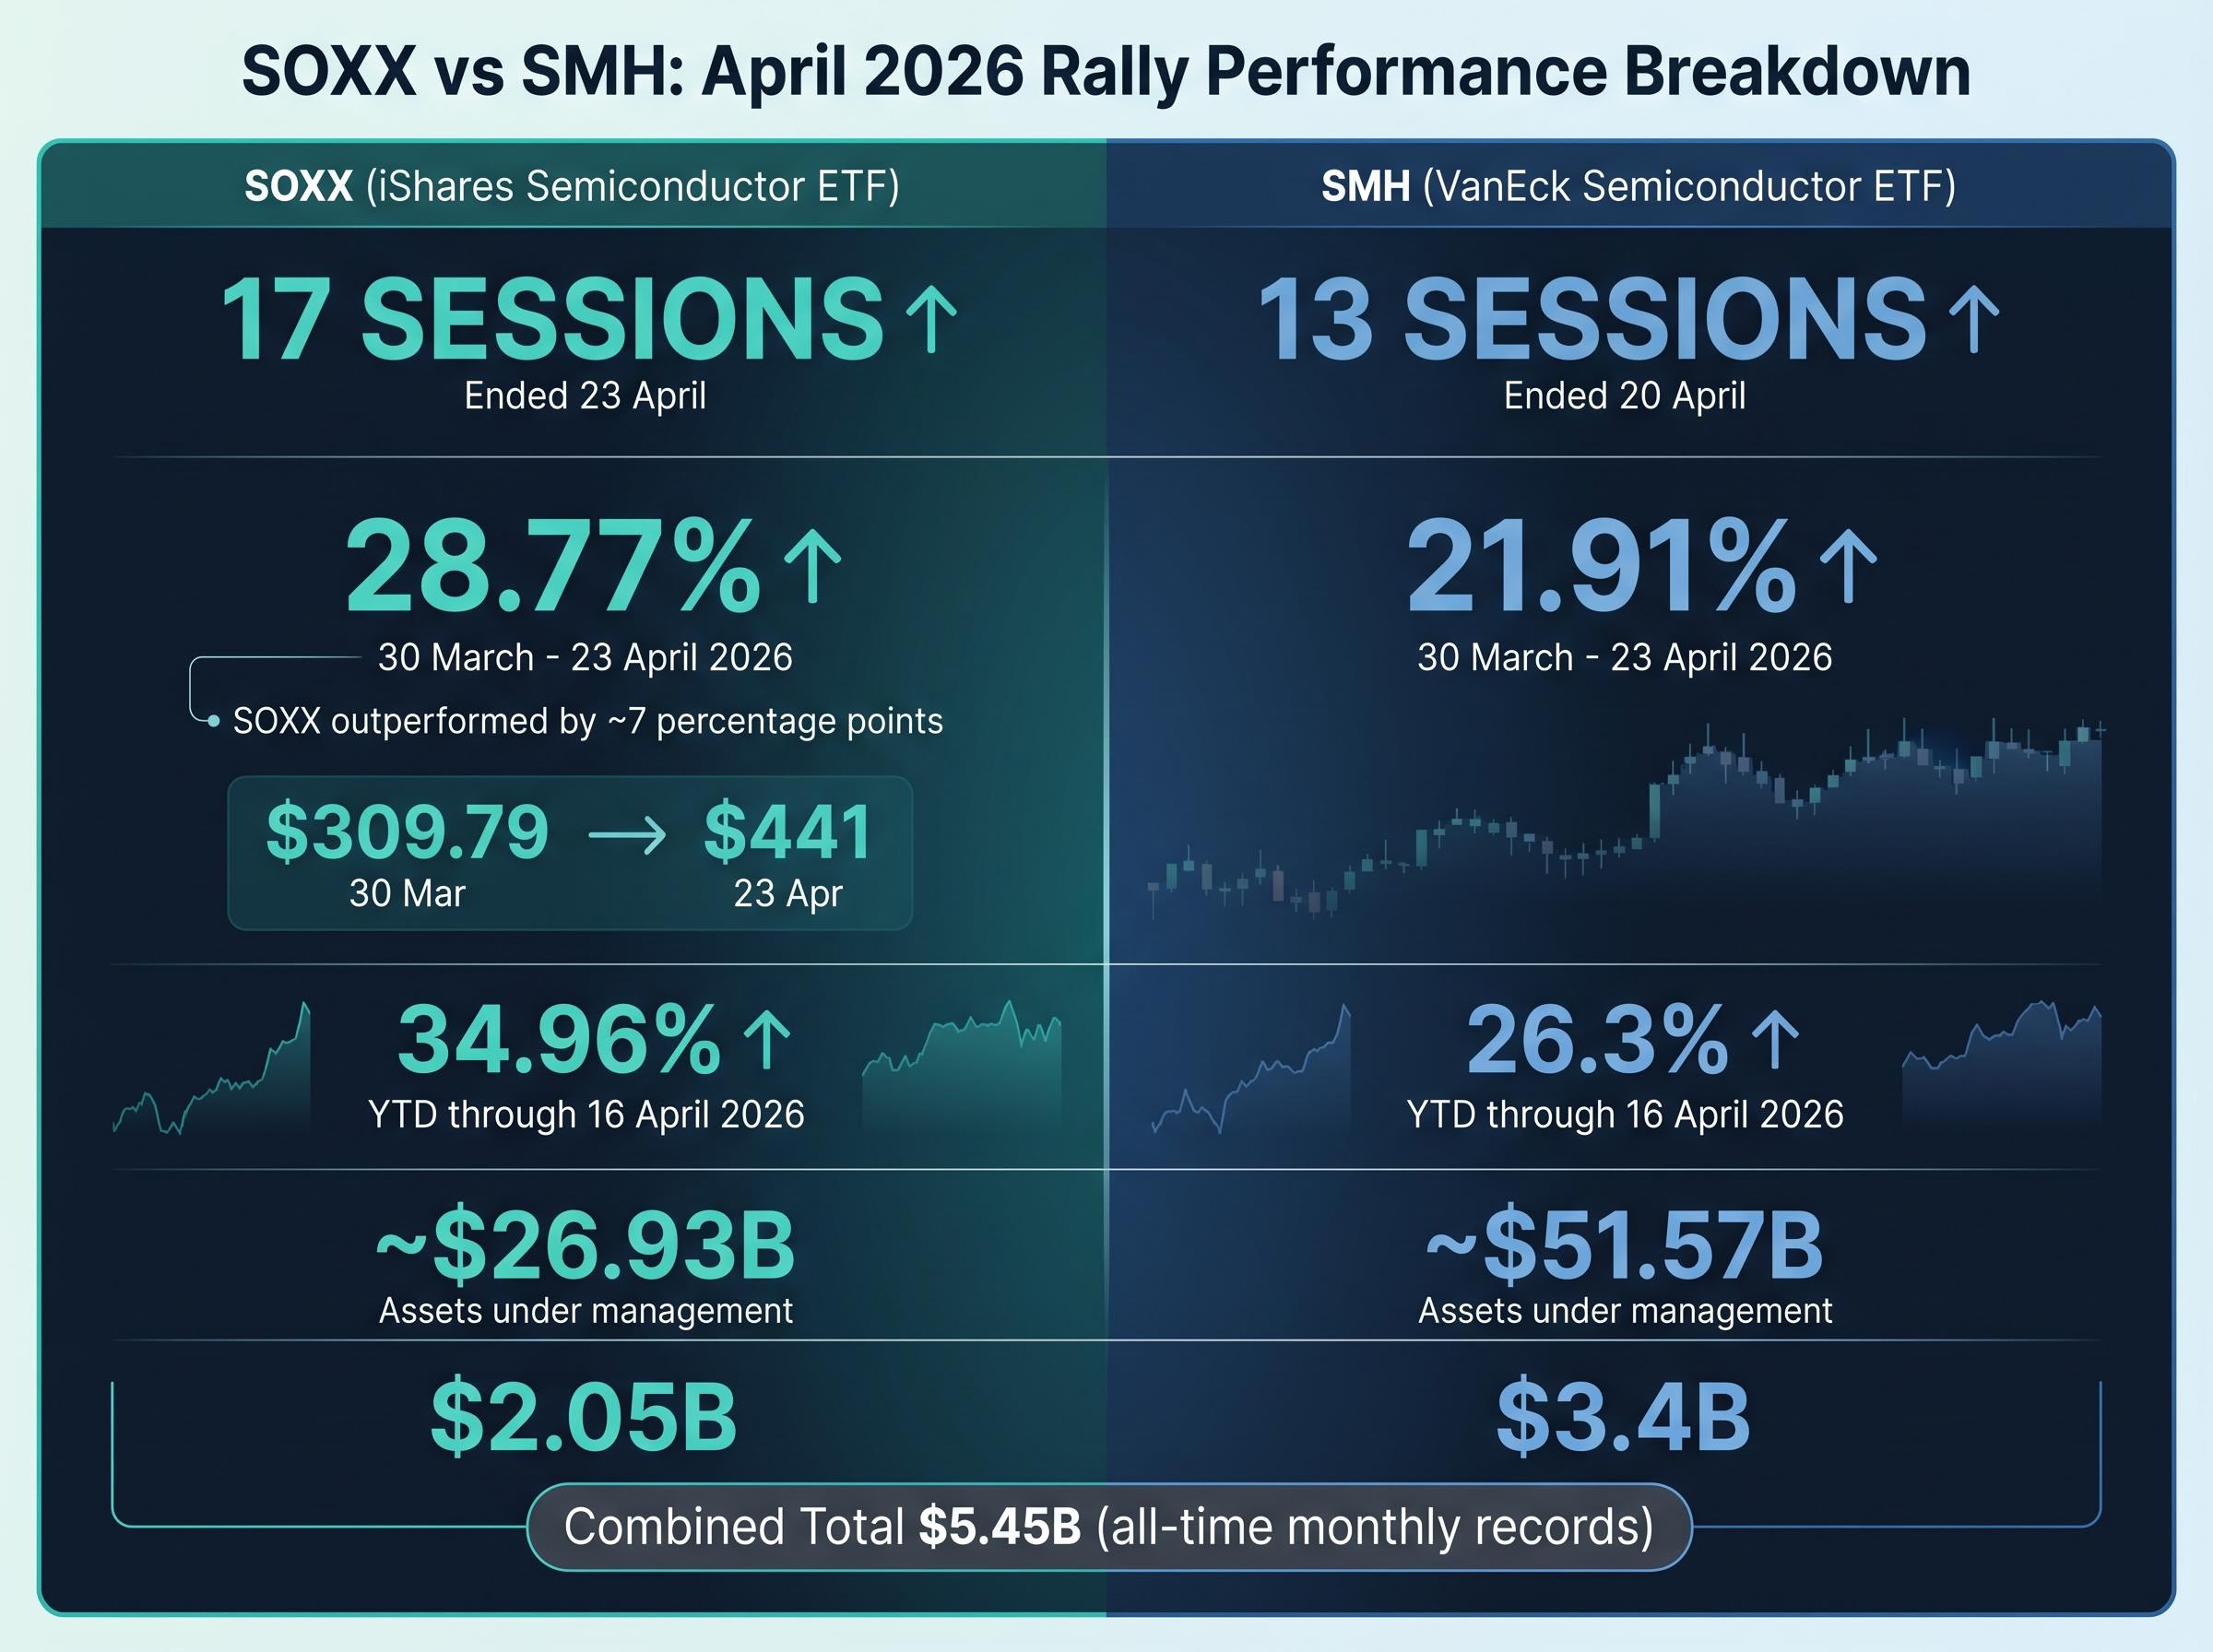
SOXX’s 17-session winning streak delivered 28.77% returns and shattered the fund’s previous record by a factor of five, marking the most impressive monthly performance in the ETF’s 25-year history. The rally, which pushed the iShares Semiconductor ETF from $309.79 on 30 March 2026 to $441 by 23 April, coincided with a broader semiconductor sector surge driven by converging AI infrastructure commitments, geopolitical relief following the 7 April 2026 US-Iran ceasefire, and critical memory chip supply shortages.
The April rally forced investors to reconsider which ETF structure captures the semiconductor opportunity most effectively. SOXX’s 28.77% advance outpaced the VanEck Semiconductor ETF’s 21.91% gain during the same window, despite SMH’s larger asset base and concentrated exposure to mega-cap leaders like NVIDIA. This performance divergence reveals structural differences in how these two flagship funds respond to market conditions, raising the question: does diversified semiconductor exposure outperform concentrated mega-cap positioning when the rally broadens beyond a handful of dominant names?
This analysis breaks down the structural differences between SOXX and SMH, explains why their performance diverged during this historic rally, and provides a framework for evaluating semiconductor ETF positioning as of late April 2026.
SOXX’s 17-session winning streak stands as the longest in the fund’s history, eclipsing the previous record of 15 sessions set in 2014 that produced only 8% gains. The streak began 30 March 2026 and ended 23 April, compressing a year’s worth of typical performance into less than a month. SMH’s rally ended earlier, with the fund’s 13-session streak broken on 20 April by a 0.04% decline, a margin so slim it underscores how tightly both funds tracked during the surge’s peak intensity.
The performance gap between the two funds tells a more significant story than the streak itself. SOXX’s 28.77% rally outpaced SMH’s 21.91% by approximately seven percentage points, the widest divergence between these two vehicles during any comparable period since November 2022. Year-to-date performance through 16 April 2026 showed SOXX up 34.96% versus SMH’s 26.3%, reversing 2025‘s pattern when SMH’s 50.46% annual gain beat SOXX’s 42.52%.
Performance Divergence During April Rally SOXX gained 28.77% from 30 March to 23 April 2026, while SMH advanced 21.91% during the same window. The approximately seven percentage point gap represents the widest performance spread between these funds during any sustained rally since the ChatGPT launch in late 2022.
The divergence raises the central question driving semiconductor ETF allocation decisions: whether this reflects a narrow mega-cap surge or a genuine broadening of semiconductor opportunity across the supply chain. The answer determines whether concentrated exposure to NVIDIA and Taiwan Semiconductor or diversified positioning across memory, equipment, and specialty players delivers superior risk-adjusted returns.
NVIDIA valuation analysis as of April 2026 shows the stock trading at a forward price-to-earnings multiple of 24 on projected 74% earnings growth, a narrow premium over the S&P 500’s 21x multiple despite fundamentally different growth profiles. This relative valuation context helps explain why the rally broadened beyond mega-cap names.
Key metrics reveal the scale:
The combined $5.45 billion in April inflows, SOXX’s $2.05 billion and SMH’s $3.4 billion, both established all-time monthly records for their respective funds. These flows occurred despite already elevated asset bases, suggesting structural capital reallocation by institutional investors rather than tactical positioning.
The combined $5.45 billion in semiconductor ETF inflows during April 2026 represents a monthly record, with SOXX’s $2.05 billion and SMH’s $3.4 billion each setting individual fund highs despite already elevated asset bases. This flow magnitude signals structural institutional reallocation rather than tactical momentum chasing.
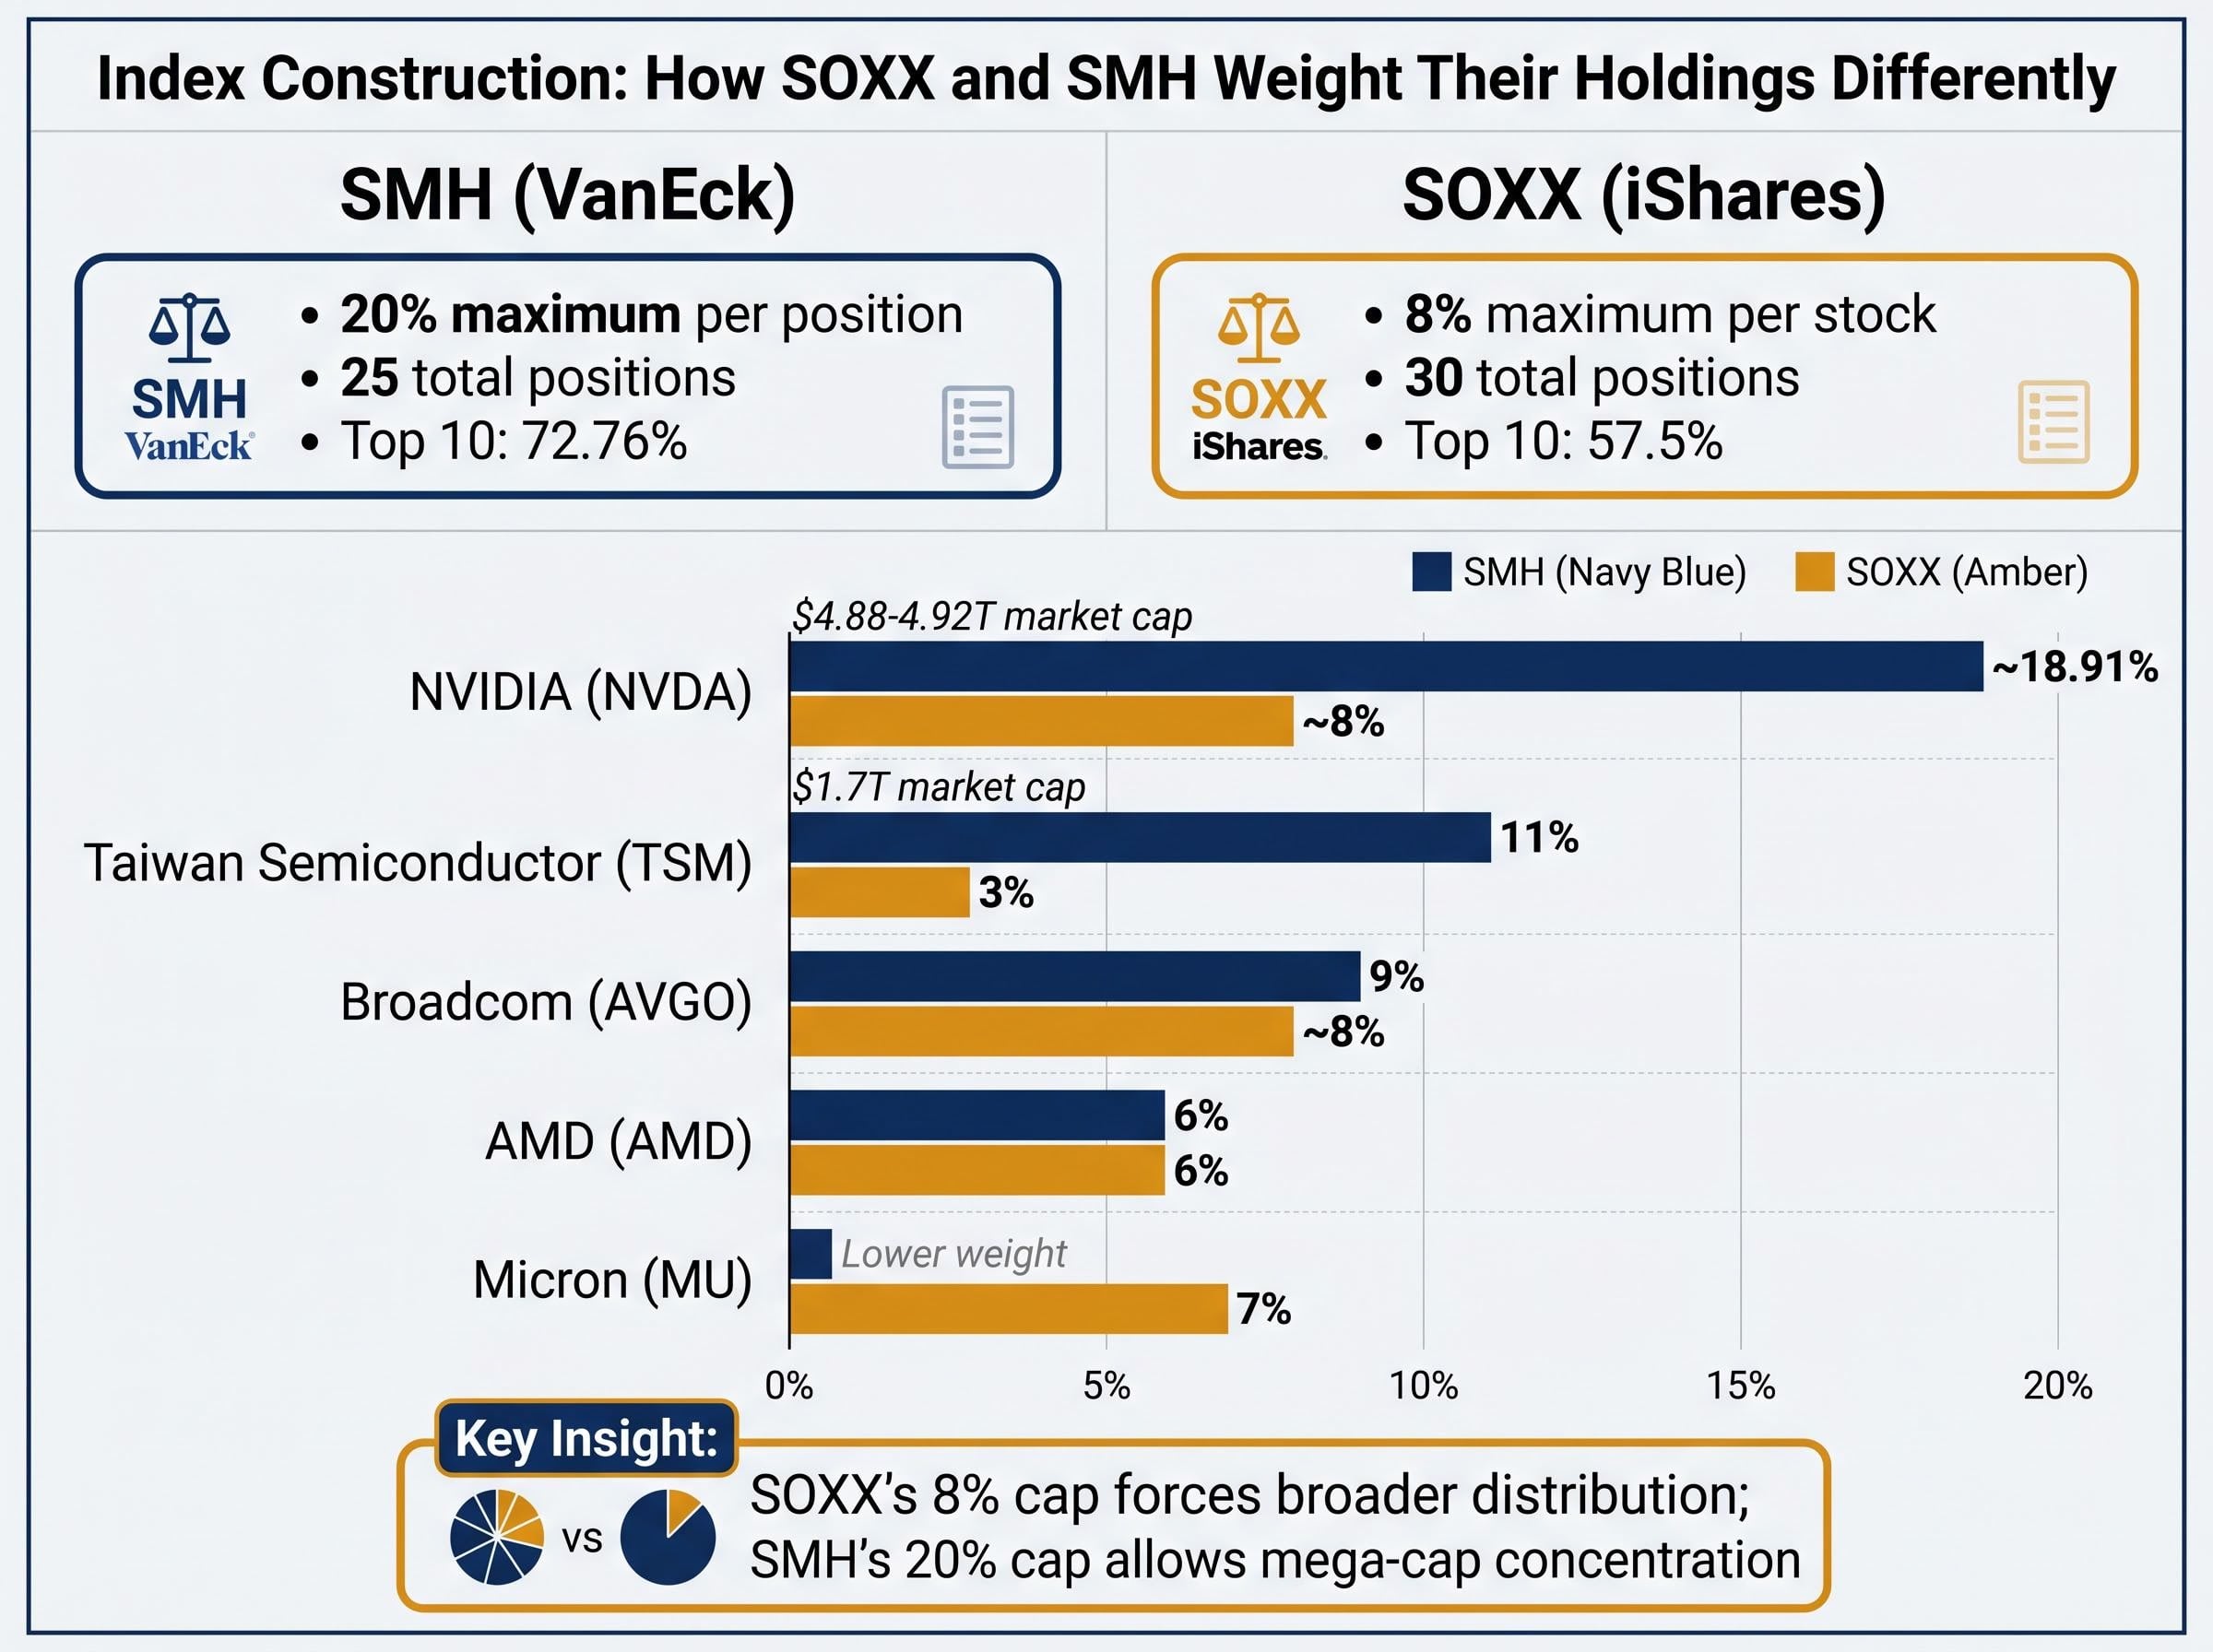
SMH tracks the MVIS US Listed Semiconductor 25 Index using modified market-cap weighting with a 20% maximum per position and a requirement that holdings derive at least 50% of revenue from semiconductor operations. This methodology produces concentrated exposure to the largest chipmakers. NVIDIA sits near the 20% ceiling at approximately 18.91%. Taiwan Semiconductor holds 11%. Broadcom captures 9%. AMD sits below 6%. The top ten holdings command 72.76% of the portfolio.
SOXX follows the NYSE Semiconductor Index with different constraints. The fund holds 30 positions with an 8% maximum per stock, a 4% ceiling for non-top-five holdings, and a 10% aggregate cap on American Depositary Receipts. These rules force weight distribution across a broader range of companies regardless of market capitalisation. Broadcom holds near 8%. Micron sits at 7%. NVIDIA captures around 8%. AMD takes 6%. Marvell holds 6%. The top ten represent 57.5% of assets.
The constraint structures create radically different portfolios despite tracking the same sector. Taiwan Semiconductor, with a $1.7 trillion market capitalisation, holds 11% weight in SMH but only 3% in SOXX because of the ADR cap. Marvell, at $143 billion market cap, receives comparable weighting to NVIDIA’s approximately $4.88-4.92 trillion in SOXX’s construction, a mechanical outcome that would never occur under pure market-cap methodology.
| Holding | SMH Weight | SOXX Weight | Market Cap |
|---|---|---|---|
| NVIDIA | ~18.91% | ~8% | $4.88-4.92 trillion |
| Taiwan Semiconductor | 11% | 3% | $1.7 trillion |
| Broadcom | 9% | ~8% | Large cap |
| Micron | Lower weight | 7% | Mid cap |
| AMD | <6% | 6% | Large cap |
These structural differences determine whether a semiconductor allocation bets on NVIDIA dominance or captures the full spectrum of chipmakers benefiting from AI infrastructure buildout. When NVIDIA surges and smaller players lag, SMH’s concentration amplifies returns. When the rally broadens to memory manufacturers, equipment makers, and specialty chipmakers, SOXX’s diversification captures gains SMH’s methodology dilutes.
April’s performance spread confirms the mechanical outcome. NVIDIA remained relatively flat during the month whilst Micron, equipment manufacturers, and specialty players led sector gains. SOXX’s 7% Micron position and balanced equipment exposure captured this breadth. SMH’s 18.91% NVIDIA allocation functioned as a relative performance drag when the largest holding treaded water.
From December 2011 through 30 November 2022, the day before ChatGPT’s public launch, SMH returned 781% whilst SOXX delivered 811%. The 30-basis-point difference over more than a decade represents essential parity, with both funds tracking semiconductor sector performance through multiple cycles without meaningful divergence.
ChatGPT’s launch changed the dynamic. Generative AI adoption created explosive demand for NVIDIA’s data centre GPUs, driving the company’s market capitalisation from roughly $350 billion in late 2022 to approximately $4.88-4.92 trillion by April 2026. SMH’s methodology, which allows positions to reach 20% of assets, captured this surge more aggressively than SOXX’s 8% cap. The result: SMH’s 50.46% gain in 2025 beat SOXX’s 42.52% as NVIDIA’s dominance rewarded concentrated exposure.
Historical Performance Parity SMH returned 781% whilst SOXX delivered 811% from December 2011 through 30 November 2022, representing virtual parity over more than a decade before generative AI adoption created divergent performance patterns.
April 2026 reversed the advantage. NVIDIA’s relatively flat performance during the month meant SMH’s 18.91% allocation to the chipmaker no longer functioned as an accelerant. Meanwhile, smaller semiconductor companies surged on catalysts ranging from memory supply shortages to Intel’s foundry partnership announcements. SOXX’s balanced exposure to these names captured gains SMH’s concentration missed.
NVIDIA’s approximately $4.88-4.92 trillion market capitalisation makes it the dominant semiconductor company globally, yet April showed the first meaningful evidence that smaller players can outperform during AI-driven rallies. Micron’s 539.43% one-year return, driven by high-bandwidth memory shortages, demonstrates how supply constraints in specific chip categories create opportunities beyond mega-cap names. Equipment makers like Lam Research and Applied Materials posted strong April gains as semiconductor manufacturers deployed record capital expenditure.
Intel’s approximately 50% April surge, the company’s largest monthly move since 1974, came from the Terafab partnership announcement positioning Intel as a key manufacturing partner for Elon Musk’s AI infrastructure projects involving Tesla, SpaceX, and xAI. The rally challenged the assumption that Taiwan Semiconductor dominates advanced foundry capacity, suggesting diversification opportunities exist even in manufacturing, the supply chain segment most concentrated around a single provider.
The reversal marks a shift from 2025‘s pattern, when NVIDIA and Taiwan Semiconductor concentration delivered superior returns, to 2026‘s broadening rally rewarding diversified semiconductor exposure across memory, equipment, and foundry players.
Four converging catalysts drove April’s semiconductor surge, each reinforcing the others to create momentum that lifted the entire sector rather than isolated segments.
Tesla’s announced tripling of AI and robotics capital expenditure to $25 billion annually, confirmed during the company’s April 2026 earnings call, represents the largest single-company AI investment commitment disclosed to date and signals that AI infrastructure spending has moved from experimental to strategic allocation across hyperscalers.
AI infrastructure commitments reached unprecedented scale. Tesla announced a tripling of AI and robotics capital expenditure to $25 billion annually, the largest single-company AI investment commitment disclosed to date. Amazon’s $185 billion construction blitz for 2026 represents more capital deployed to infrastructure buildout in a single year than any company in history. Alphabet’s $200 billion infrastructure commitment for 2026 signals that hyperscalers view AI compute capacity as a strategic imperative rather than an experimental investment.
Memory chip shortages created pricing power for manufacturers. High-bandwidth memory demand increased 70% year-on-year in 2026, consuming 23% of total DRAM wafer output versus 19% in 2025. This reallocation toward AI-specific memory created supply squeezes in consumer electronics and traditional computing applications. Micron’s 539.43% one-year return reflects market recognition of the profitability opportunity from sustained supply constraints.
HBM3e memory shortages cap global AI accelerator production, with SK hynix controlling 60-62% of supply and Micron forecasting scarcity extending beyond 2026. This supply constraint explains why memory manufacturers command pricing power even during broader semiconductor rallies.
Geopolitical relief reversed technology equity declines. The 7 April 2026 announcement of a conditional two-week ceasefire between the United States and Iran immediately lifted semiconductor stocks that had declined during weeks of Middle Eastern conflict. Broadcom surged 5% on 9 April as the primary catalyst for broad-based sector rebounds. The semiconductor industry’s complex dependencies on energy security, critical materials, and supply chain stability made it uniquely vulnerable to disruptions, so the ceasefire provided meaningful relief.
Deloitte’s 2026 Global Semiconductor Industry Outlook projects generative AI chips will approach $500 billion in revenue in 2026, representing roughly half of total global semiconductor sales of $975 billion, a forecast that provides institutional backing for the multiyear demand visibility driving current semiconductor valuations.
Intel’s Terafab partnership signalled foundry diversification beyond Taiwan Semiconductor. Tesla confirmed during earnings that it plans to use Intel’s next-generation 14A process for chips in its Terafab AI complex in Austin, marking Intel’s first significant external customer win for this advanced node. The approximately 50% April gain represents market recognition that Intel’s foundry strategy may succeed despite years of scepticism.
AI Chip Revenue Projection Deloitte’s 2026 Global Semiconductor Industry Outlook projects generative AI chips will approach $500 billion in revenue in 2026, representing roughly half of total global semiconductor sales of $975 billion.
Key catalyst data:
These catalysts provide multiyear demand visibility supporting semiconductor valuations beyond the current rally. However, the concentration of capital expenditure in a small number of hyperscalers creates meaningful risk if AI infrastructure investment moderates. Any slowdown in spending by Alphabet, Amazon, or Meta could create sharp semiconductor demand reduction, a concentration risk that diversified ETF exposure cannot eliminate.
SOXX fits investors who believe the AI boom will enrich the full semiconductor supply chain rather than concentrating gains in a handful of mega-cap names. The fund’s 8% maximum position constraint and 57.5% top-ten concentration provide diversification against single-stock risk whilst maintaining meaningful exposure to sector leaders. Investors choosing SOXX accept lower leverage to NVIDIA’s continued dominance in exchange for broader participation across memory manufacturers, equipment makers, and specialty chipmakers.
SMH serves investors with high conviction in continued NVIDIA and Taiwan Semiconductor leadership who accept concentration risk for potential outperformance. The 18.91% NVIDIA position and 72.76% top-ten concentration amplify both upside and downside relative to diversified approaches. 2025‘s 50.46% return versus SOXX’s 42.52% demonstrates the upside case. April 2026‘s underperformance shows the concentration cost when mega-caps lag.
Alternatives provide different risk-return profiles. The SPDR S&P Semiconductor ETF (XSD) uses equal weighting across 44 positions with a 3% maximum single position, delivering the broadest mid-cap exposure in the category. Year-to-date return of 21% through April trails both SOXX and SMH, suggesting equal weighting dilutes gains during concentrated rallies. The Invesco PHLX Semiconductor ETF (SOXQ) holds 31 positions with a 0.19% expense ratio, offering cost-conscious investors broad exposure weighted toward AI leaders at lower annual fees.
Technical caution warrants consideration despite strong fundamentals. Both SOXX and SMH show overbought Relative Strength Index readings on daily timeframes. Volume on major equity indices remained remarkably anaemic over the final days of the rally, with the SPDR S&P 500 ETF trading 42 million, 54 million, and 60 million shares over three sessions, substantially below historical norms. This suggests the semiconductor rally may be underpinned by shorter-term positioning rather than broad institutional rebalancing, creating risk that rapid liquidation could occur if disappointing earnings or macro data triggers selling.
For investors concerned about the sustainability of semiconductor valuations given concentrated hyperscaler spending, our full explainer on AI capital expenditure ROI risks examines why $527 billion in consensus capex for 2026 has produced no proportionate return visibility and how Vanguard’s downside warnings apply to semiconductor exposure.
| Fund | Expense Ratio | Positions | Top Holding Weight | YTD Return |
|---|---|---|---|---|
| SOXX | 0.34% | 30 | ~8% (Broadcom) | 34.96% |
| SMH | 0.35% | 25 | ~18.91% (NVIDIA) | 26.3% |
| XSD | 0.35% | 44 | ~3% (equal weight) | 21% |
| SOXQ | 0.19% | 31 | 13% (NVIDIA) | 30% |
Analyst scepticism persists despite extraordinary price performance. Intel’s consensus rating remains “Reduce” despite 50% April gains and approximately 70% year-to-date performance. This disconnect between market pricing and sell-side validation creates risk for momentum-dependent investors if analyst downgrades or negative earnings surprises accelerate profit-taking when technical support fails.
Three investor profiles guide selection:
Selecting between these ETFs aligns structural methodology with specific conviction regarding whether mega-cap dominance persists or the semiconductor opportunity broadens across the supply chain. Neither approach proves universally superior. The choice depends on conviction about where the AI boom delivers returns and willingness to accept the trade-offs each methodology creates.
The April 2026 rally delivered the first meaningful evidence that diversified semiconductor exposure can outperform concentrated mega-cap positioning during an AI-driven surge. SOXX’s 28.77% streak return versus SMH’s 21.91% reflects not a fluke but the mechanical outcome of different index methodologies responding differently to a broadening rally. When NVIDIA remained relatively flat whilst memory manufacturers, equipment makers, and Intel surged, SOXX’s balanced weighting captured gains SMH’s concentration diluted.
Investors evaluating semiconductor ETF positioning should recognise that structural methodology determines risk-return profile. SOXX’s balanced weighting captures supply chain breadth. SMH’s concentration amplifies NVIDIA exposure. XSD’s equal weighting provides maximum diversification. SOXQ’s lower expense ratio reduces long-term costs. Neither approach proves universally superior. The choice depends on conviction about where the AI boom delivers returns.
With combined April inflows exceeding $5.4 billion and multiyear AI capital expenditure commitments providing demand visibility, semiconductor ETFs remain positioned for continued institutional allocation. However, overbought technical conditions, low-volume price action during the rally’s final sessions, and concentrated hyperscaler capital expenditure spending warrant monitoring for signs of moderation. The sector stands at an inflection point where fundamental drivers remain supportive yet near-term positioning suggests consolidation potential before the next leg of the longer-term AI-driven semiconductor leadership trend.
This article is for informational purposes only and should not be considered financial advice. Investors should conduct their own research and consult with financial professionals before making investment decisions.
Past performance does not guarantee future results. Financial projections are subject to market conditions and various risk factors.
SOXX holds 30 positions with an 8% maximum per stock, spreading exposure across memory, equipment, and specialty chipmakers, while SMH holds 25 positions and allows up to 20% in a single holding, giving it much heavier concentration in NVIDIA and Taiwan Semiconductor.
SOXX outperformed because NVIDIA remained relatively flat during the rally while memory manufacturers, equipment makers, and Intel surged; SOXX's balanced 7% Micron position and broader supply chain exposure captured those gains, whereas SMH's roughly 19% NVIDIA allocation acted as a relative drag.
The best choice depends on conviction: SOXX suits investors who believe AI gains will broaden across the supply chain, SMH suits those with high conviction in continued NVIDIA and Taiwan Semiconductor leadership, and SOXQ offers the lowest expense ratio at 0.19% for cost-conscious broad exposure.
SOXX and SMH combined attracted approximately $5.45 billion in April 2026 inflows, with SOXX taking in $2.05 billion and SMH $3.4 billion, both setting all-time monthly records for their respective funds.
Four converging catalysts drove the rally: unprecedented AI infrastructure commitments from Tesla, Amazon, and Alphabet; high-bandwidth memory shortages boosting manufacturers like Micron; geopolitical relief following the US-Iran ceasefire on 7 April 2026; and Intel's Terafab foundry partnership announcement signalling diversification beyond Taiwan Semiconductor.