How $4B in Fuel Costs Erased American Airlines’ Record Q1
5 mins ago

Nvidia’s $4.9 trillion valuation sits 33% below Wall Street’s median price target of $267.55, creating a tension investors must resolve: is the market missing something, or are analysts too bullish? After becoming the first company to breach $5 trillion in October 2025, Nvidia shares have stagnated near $202 for six months despite continued earnings outperformance. With 93% of 70 analysts rating it a buy yet the stock trading sideways, the disconnect demands examination.
This analysis breaks down what Wall Street sees, what the technicals suggest, and what risks could derail the bull case, giving readers a framework to evaluate their own position.
Seventy analysts cover Nvidia, and 93% of them rate it a buy. The median 12-month price target sits at $267.55, implying 33% upside from current levels near $202. At that target, Nvidia’s market capitalisation would reach approximately $6.5 trillion, extending its lead as the world’s most valuable company.
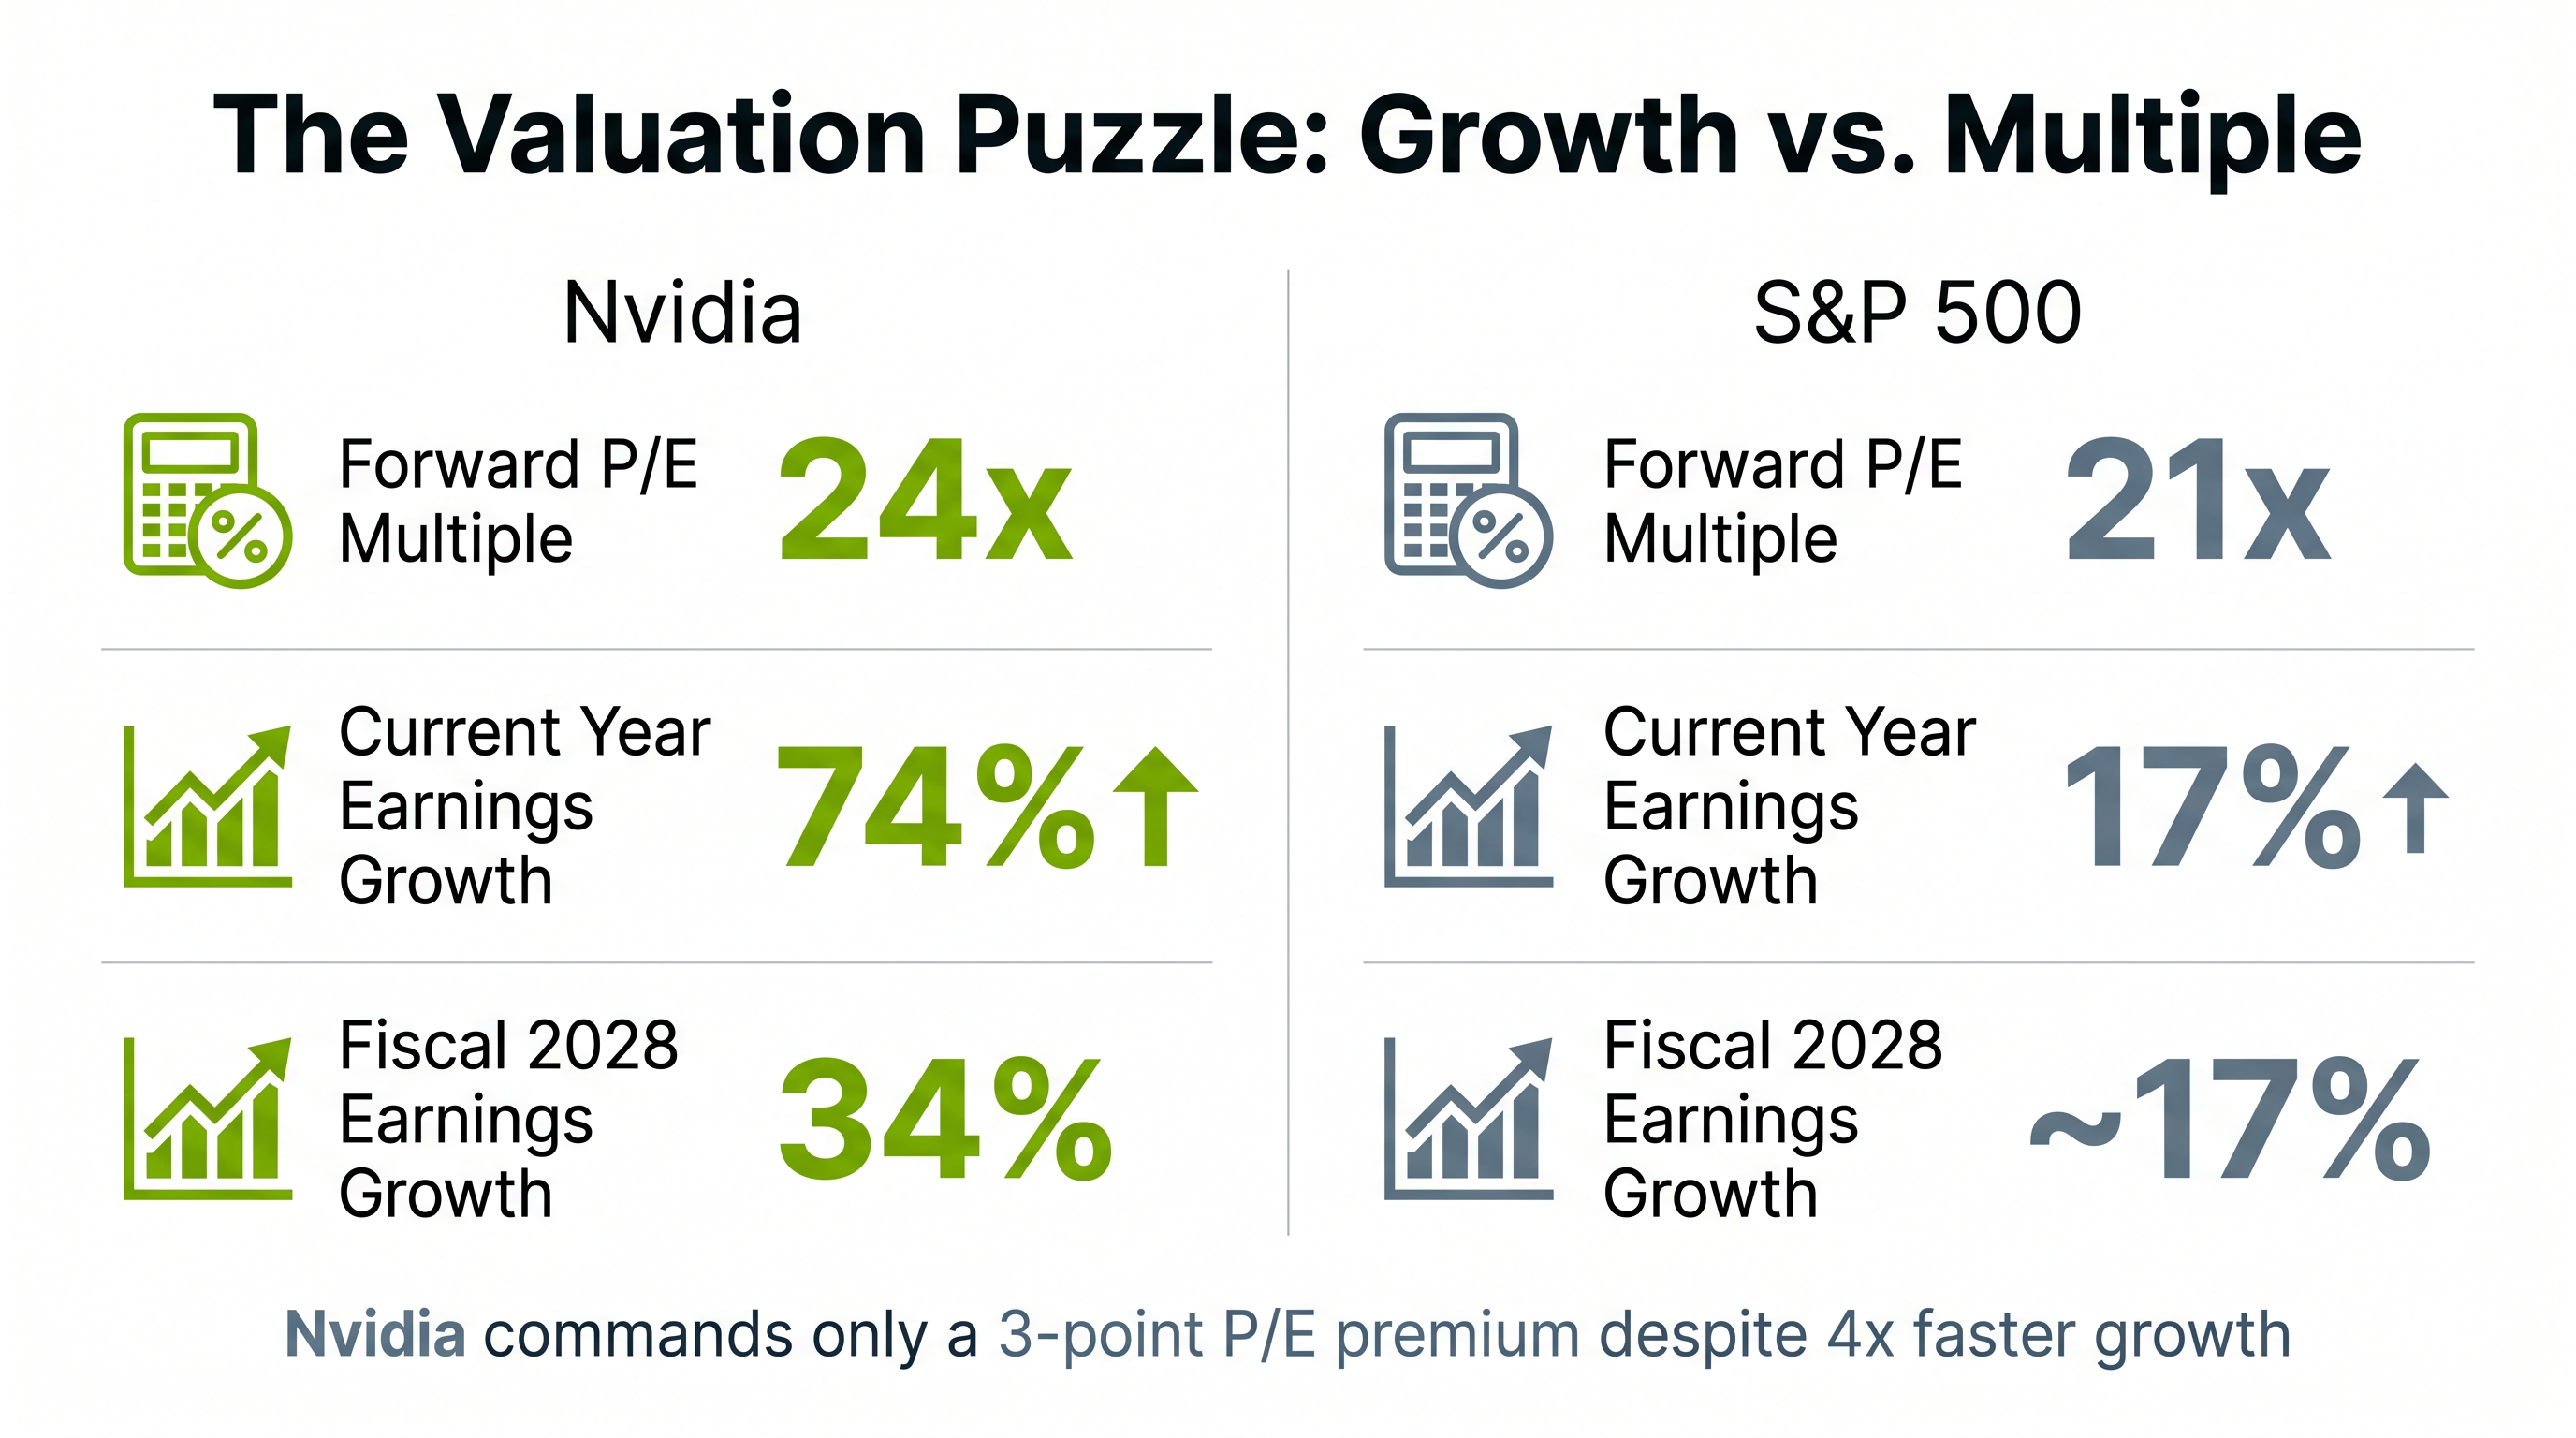
The consensus is not built on optimism alone. It is built on an earnings growth differential that separates Nvidia from the broader market. Analysts project 74% earnings growth for Nvidia’s current fiscal year, compared to 17% for the S&P 500. Looking further out, fiscal 2028 consensus earnings of $11.12 per share would represent 34% growth, roughly double the anticipated index average of 17%.
Analyst Consensus Snapshot – Current price: $202 – Median 12-month target: $267.55 – Implied upside: 33% – Implied market cap: $6.5 trillion – Buy ratings: 93% (65 of 70 analysts)
Wall Street’s near-unanimous bullishness is not typical. Understanding the earnings growth differential that underpins these targets helps readers assess whether consensus is complacent or correct.
Nvidia trades at a forward price-to-earnings multiple of 24, compared to the S&P 500’s forward multiple of 21. For a company projected to deliver 74% earnings growth this year, a three-point premium feels narrow. The S&P 500, growing earnings at 17%, commands a 21x multiple. Nvidia, growing earnings at more than four times that rate, trades at only 24x.
The gap presents two interpretations. Bulls argue Nvidia is undervalued relative to its growth trajectory. A company compounding earnings at 34% through fiscal 2028 should command a materially higher multiple than an index growing at half that rate. Bears counter that the narrow premium reflects justified scepticism about whether Nvidia can sustain its dominance as competition from AMD, Intel, and hyperscaler custom chips intensifies.
For readers wanting to understand how valuation multiples behave when earnings growth outpaces price appreciation, our dedicated guide to valuation multiples during earnings expansion cycles examines the S&P 500’s recent pattern of declining PE ratios amid rising stock prices, a dynamic directly relevant to evaluating Nvidia’s 24x forward multiple against its 74% earnings growth rate.
Deloitte’s 2026 Global Semiconductor Industry Outlook on valuation multiple benchmarks provides sector-wide context for interpreting forward price-to-earnings ratios in high-growth semiconductor companies, helping readers compare Nvidia’s 24x multiple against industry peers facing similar competitive and macroeconomic pressures.
| Metric | Nvidia | S&P 500 |
|---|---|---|
| Forward P/E Multiple | 24 | 21 |
| Current Year Earnings Growth | 74% | 17% |
| Fiscal 2028 Earnings Growth | 34% | ~17% |
Valuation multiples are often misread in isolation. This section equips readers to understand why a 24x forward multiple on 74% growth is fundamentally different from a 21x multiple on 17% growth.
Price targets are not predictions. They are mathematical outputs of input assumptions. Analysts derive 12-month price targets by estimating future earnings and applying a valuation multiple they believe the market will assign. Understanding this mechanics allows readers to stress-test targets themselves rather than treating analyst calls as gospel.
The construction follows three steps:
The bull case scenario illustrates the range of outcomes. At a 30x multiple on fiscal 2028 earnings of $11.12, Nvidia would trade at $333 per share, representing 67% upside from current levels. At that price, Nvidia’s market capitalisation would exceed $8 trillion.
Bull Case Scenario Fiscal 2028 EPS of $11.12 at a 30x multiple yields a $333 share price, implying 67% upside and a market cap exceeding $8 trillion.
Price targets are not guarantees. They are frameworks. Readers who understand the assumptions behind them can evaluate whether those assumptions are reasonable given competitive dynamics, macroeconomic conditions, and regulatory risks.
Nvidia reported $216 billion in total revenue for fiscal 2026, which ended 25 January 2026. The data centre segment contributed $193.7 billion, roughly 90% of total revenue. The concentration underscores how dependent Nvidia’s growth is on infrastructure spending by hyperscalers and enterprise customers deploying AI workloads.
The 90% concentration of Nvidia’s revenue in data centre hardware means its growth trajectory directly tracks data centre capacity expansion cycles evidenced by 250MW of new Q1 2026 contracts secured by regional providers, signaling sustained infrastructure build-out demand through 2027.
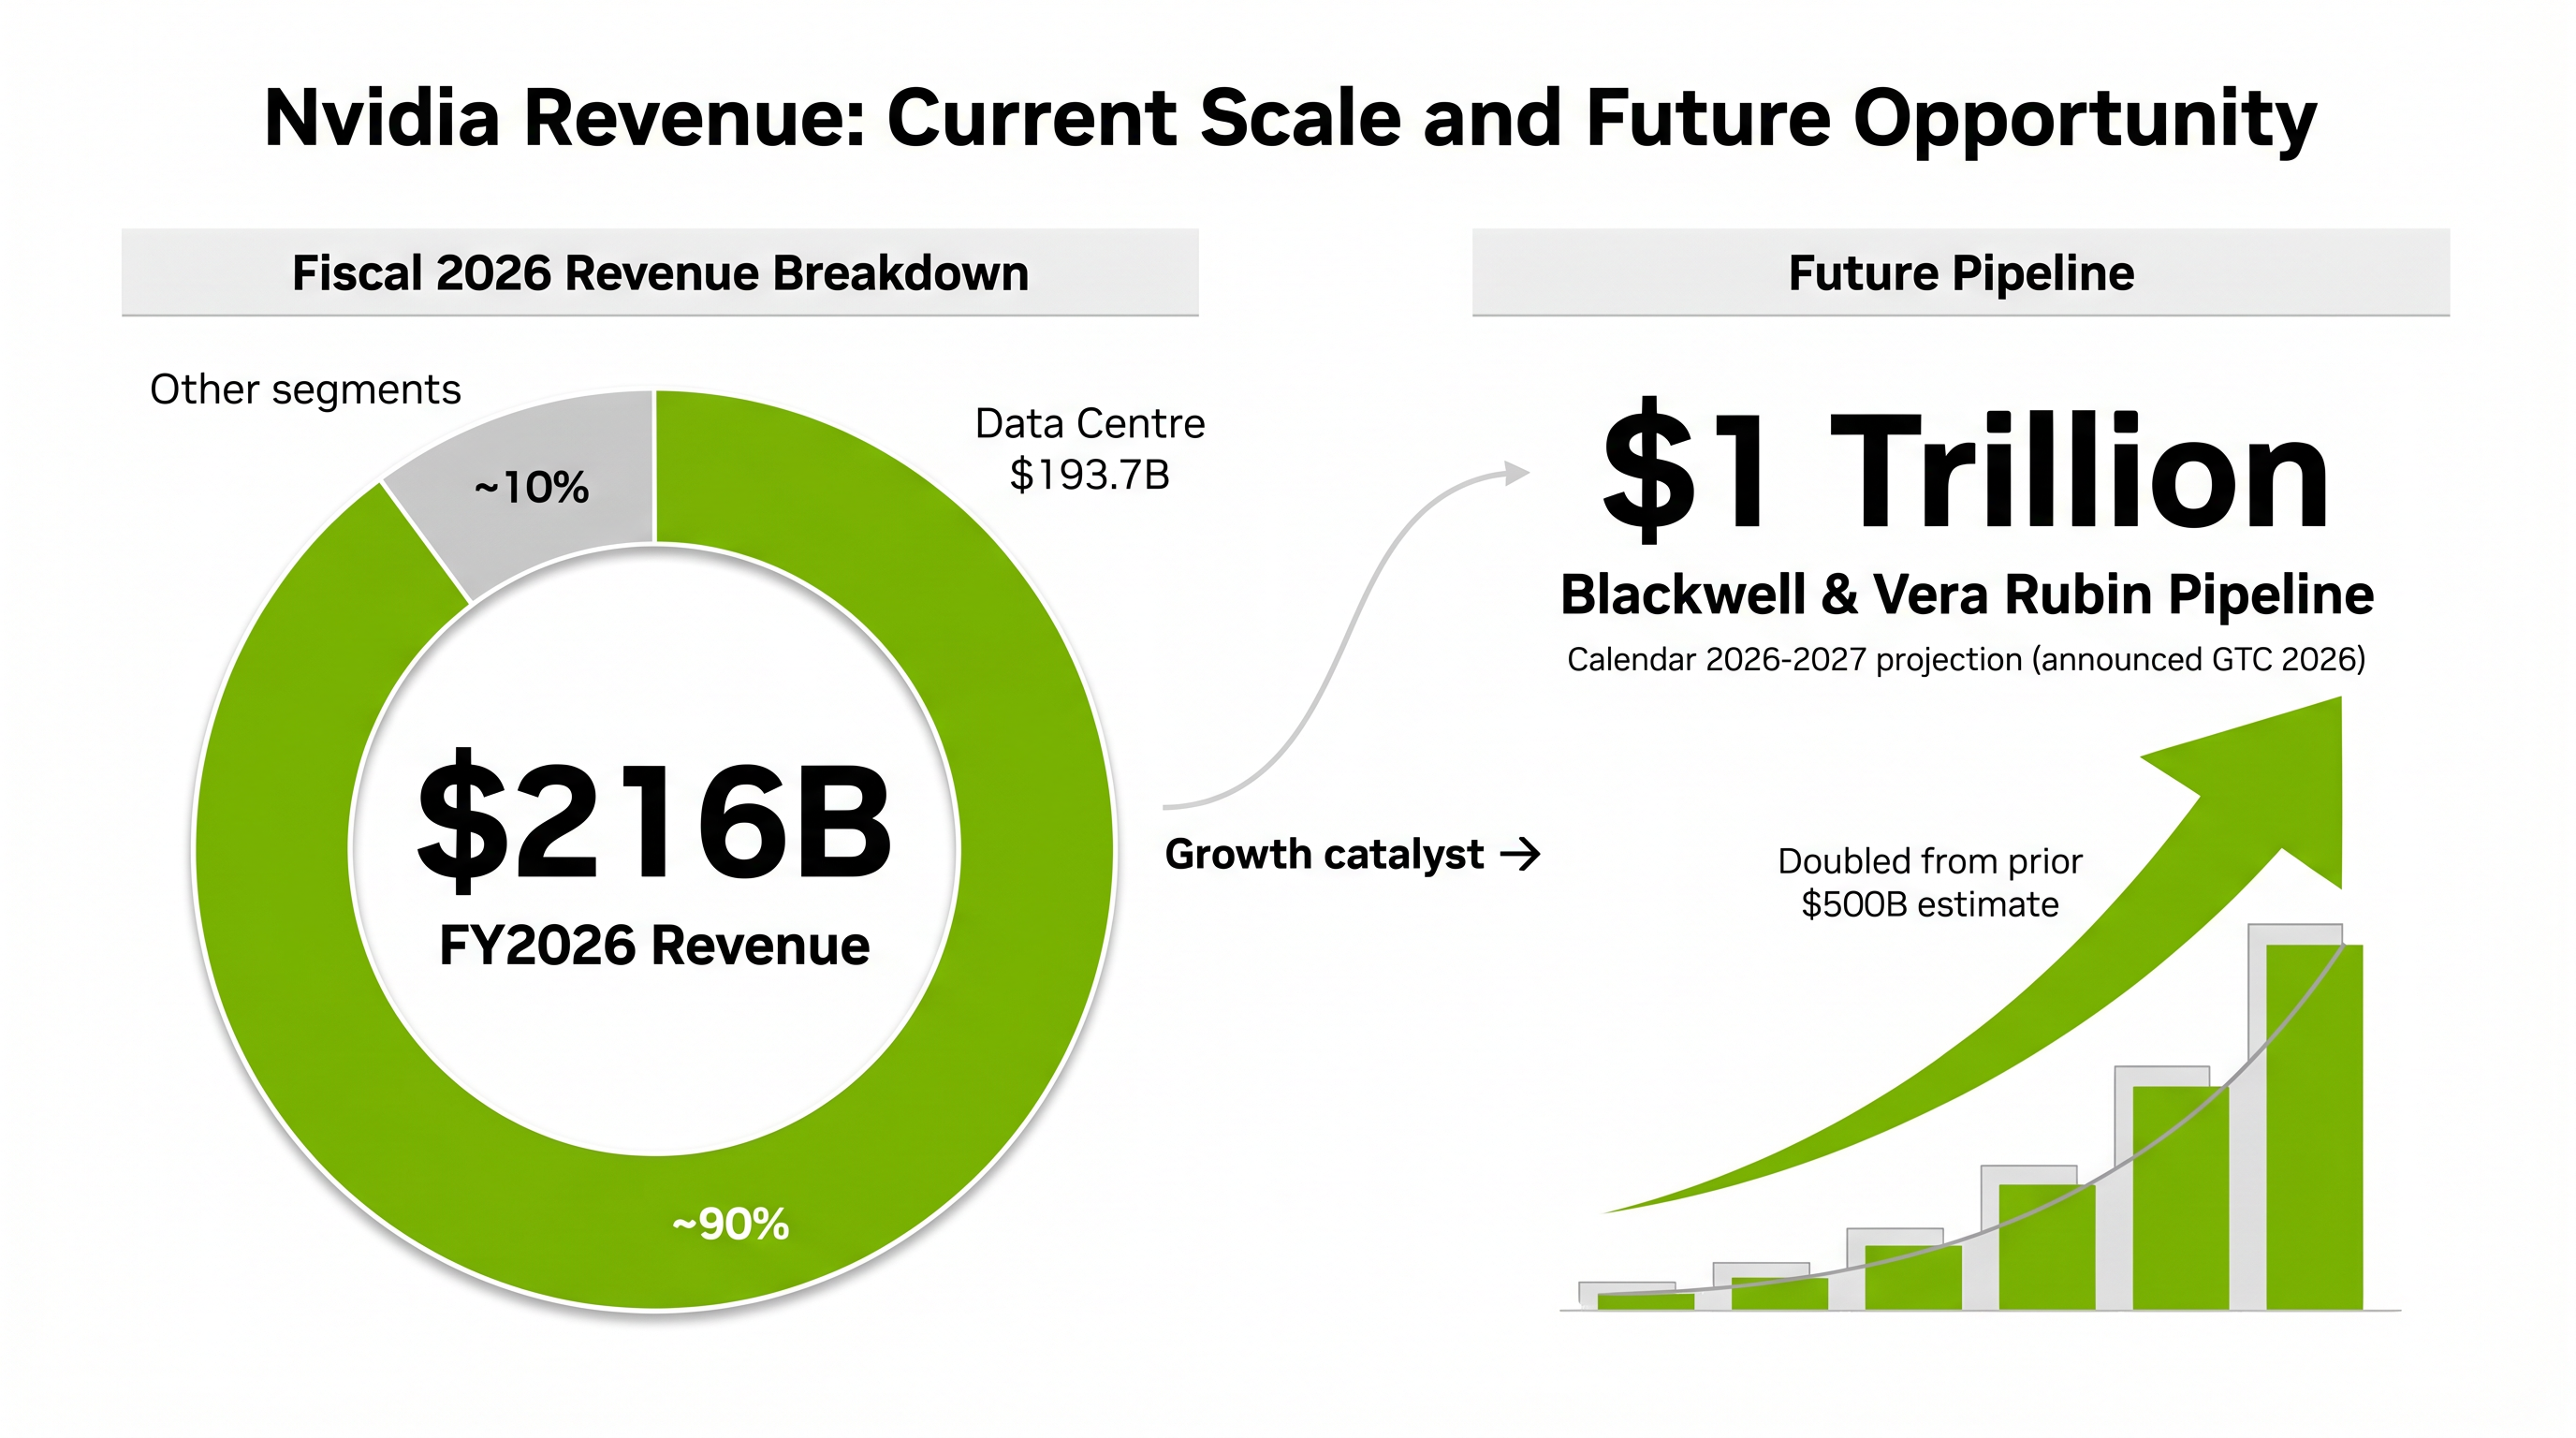
At GTC 2026 in March, Nvidia projected a $1 trillion revenue opportunity from its Blackwell and Vera Rubin product families over calendar years 2026 and 2027. The projection doubled a prior estimate of $500 billion, signalling accelerating demand. If achieved, the pipeline would represent a step-change in scale that would justify or exceed current analyst targets.
Fiscal 2026 Revenue Breakdown – Total revenue: $216 billion – Data centre contribution: $193.7 billion – Data centre share: ~90%
Pipeline Projection Nvidia projects $1 trillion in data centre revenue from Blackwell and Vera Rubin over calendar 2026-2027, doubled from a prior $500 billion estimate announced at GTC 2026.
A $1 trillion two-year pipeline is not incremental growth. It would represent a step-change in scale that, if achieved, would justify or exceed current analyst targets.
The Blackwell and Vera Rubin platforms target agentic AI and inference workloads, where demand is shifting from training-focused infrastructure to systems optimised for real-time decision-making. CEO Jensen Huang has emphasised “exponential” computing demand driven by these use cases. The product families include seven breakthrough chips and liquid-cooled systems designed for AI factory deployment, addressing both performance and energy efficiency requirements.
Hyperscaler infrastructure spending trends support the demand thesis. Cloud providers continue to allocate capital toward AI-optimised hardware, and Nvidia’s lead in both training and inference workloads positions it as the default supplier. However, competitive threats from AMD, Intel, and hyperscaler custom chips could erode market share if these alternatives prove cost-effective and performance-competitive by year-end 2026.
The $1 trillion revenue opportunity from Blackwell and Vera Rubin assumes sustained demand from customers whose own capital returns remain uncertain, and infrastructure capital allocation efficiency concerns raised by institutional investors in early 2026 could pressure hyperscaler spending commitments if AI monetisation timelines extend beyond current projections.
Three primary risk categories cloud the bull case: competitive threats, macroeconomic and regulatory uncertainty, and technical breakdown scenarios.
Competitive threats include AMD and Intel launching AI accelerators designed to undercut Nvidia’s pricing, and hyperscalers such as OpenAI developing custom silicon to optimise costs and reduce dependence on a single supplier. If these alternatives gain traction, Nvidia’s market share could compress, pressuring margins and growth projections.
Competitive threats include AMD and Intel launching AI accelerators designed to undercut Nvidia’s pricing, and hyperscaler custom chip partnerships such as Broadcom’s deal with OpenAI that allow cloud providers to optimise costs and reduce dependence on a single supplier.
Macroeconomic and regulatory uncertainty centres on the Federal Open Market Committee meeting scheduled for 28-29 April. Jerome Powell’s positioning on interest rates and economic outlook could shift sentiment across growth stocks. Additionally, export control ambiguity and potential antitrust scrutiny add layers of risk that are difficult to quantify but material to valuation.
Technical breakdown scenarios present quantifiable downside. Analysts have identified a head-and-shoulders pattern that, if the neckline breaks, risks a 15% decline to approximately $172. Low implied volatility amplifies the potential for sharp swings on catalyst announcements, meaning a negative earnings surprise or policy shift could trigger rapid repricing.
Technical Downside Scenario A head-and-shoulders pattern risks a 15% decline to approximately $172 if the neckline breaks, amplified by low implied volatility that magnifies catalyst-driven swings.
Bulls often underweight risks that have not yet materialised. This section ensures readers price in downside scenarios rather than anchoring solely on upside targets.
Commercial intent readers need a decision framework, not a single verdict. The table below presents bear, base, and bull case scenarios, each tied to specific assumptions and price implications.
| Scenario | Price Target | Key Assumption | Implied Move from $202 |
|---|---|---|---|
| Bear Case | $172 | Technical breakdown triggered by competition acceleration or macro deterioration | -15% |
| Base Case | $267.55 | Earnings momentum sustains, no material competitive disruption | +33% |
| Bull Case | $333 | Nvidia trades at 30x fiscal 2028 EPS of $11.12, validating $1 trillion pipeline | +67% |
The bear case assumes technical support fails and competitive or macroeconomic pressures intensify. The base case assumes Nvidia converges toward Wall Street’s median target as earnings momentum continues without major disruption. The bull case assumes the $1 trillion revenue pipeline materialises and the market assigns a premium multiple reflecting Nvidia’s sustained dominance.
Readers evaluating a position should identify which scenario matches their conviction. Risk-averse investors may weigh the bear case more heavily, particularly if the FOMC meeting or competitive announcements shift sentiment. Growth-focused investors may favour the base or bull case if they believe the Blackwell and Vera Rubin pipeline will validate projections.
The 33% gap between Nvidia’s current price of $202 and Wall Street’s median target of $267.55 reflects genuine uncertainty, not mispricing. Nvidia’s valuation looks reasonable against its growth trajectory, with a forward multiple of 24x on 74% earnings growth comparing favourably to the S&P 500’s 21x on 17% growth. However, competitive emergence from AMD, Intel, and hyperscaler custom chips, combined with macroeconomic and regulatory risks, mean the consensus is not guaranteed.
Readers evaluating a position should identify which scenario matches their conviction: the technical breakdown at $172, the base case at $267.55, or the bull case at $333. Monitor May earnings for demand validation, watch the FOMC decision on 28-29 April for rate trajectory signals, and track competitive announcements from AMD and hyperscalers through year-end. The $1 trillion revenue opportunity from Blackwell and Vera Rubin is the catalyst that could resolve the valuation tension, but execution risk remains.
This article is for informational purposes only and should not be considered financial advice. Investors should conduct their own research and consult with financial professionals before making investment decisions.
93% of 70 analysts covering Nvidia rate it a buy, with a median 12-month price target of $267.55, implying approximately 33% upside from the current price near $202.
Nvidia has stagnated near $202 for around six months despite 74% projected earnings growth, with investors weighing competitive threats from AMD, Intel, and hyperscaler custom chips against the bullish consensus.
The bull case applies a 30x multiple to fiscal 2028 earnings per share of $11.12, yielding a target price of $333, which would represent 67% upside from current levels and a market cap exceeding $8 trillion.
Key risks include competitive AI accelerators from AMD and Intel, hyperscaler custom chip development reducing Nvidia dependence, macroeconomic uncertainty around Federal Reserve rate decisions, and a technical breakdown scenario that could push the stock down 15% to approximately $172.
Nvidia trades at a forward price-to-earnings multiple of 24, compared to the S&P 500's forward multiple of 21, yet Nvidia is projected to deliver 74% earnings growth versus the index's 17%, making its modest premium appear narrow relative to its growth rate.