How the Energy Crisis Pushed Inflation to 3.58% as S&P Hit Records

Key Takeaways
- The S&P 500 reached a record 7,126.06 in the week ending 13 April 2026, even as the Cleveland Fed inflation nowcast climbed to 3.58%, the highest reading since the energy crisis began.
- The Strait of Hormuz closure removed roughly 20 million barrels per day from global supply, pushing crude oil to $112 per barrel and U.S. average gasoline prices to $4.11 per gallon.
- Markets now price an 80% probability the Fed holds rates at 3.5%-3.75% with no cuts, as supply-shock inflation eliminates the rate reduction optionality that had supported elevated equity valuations.
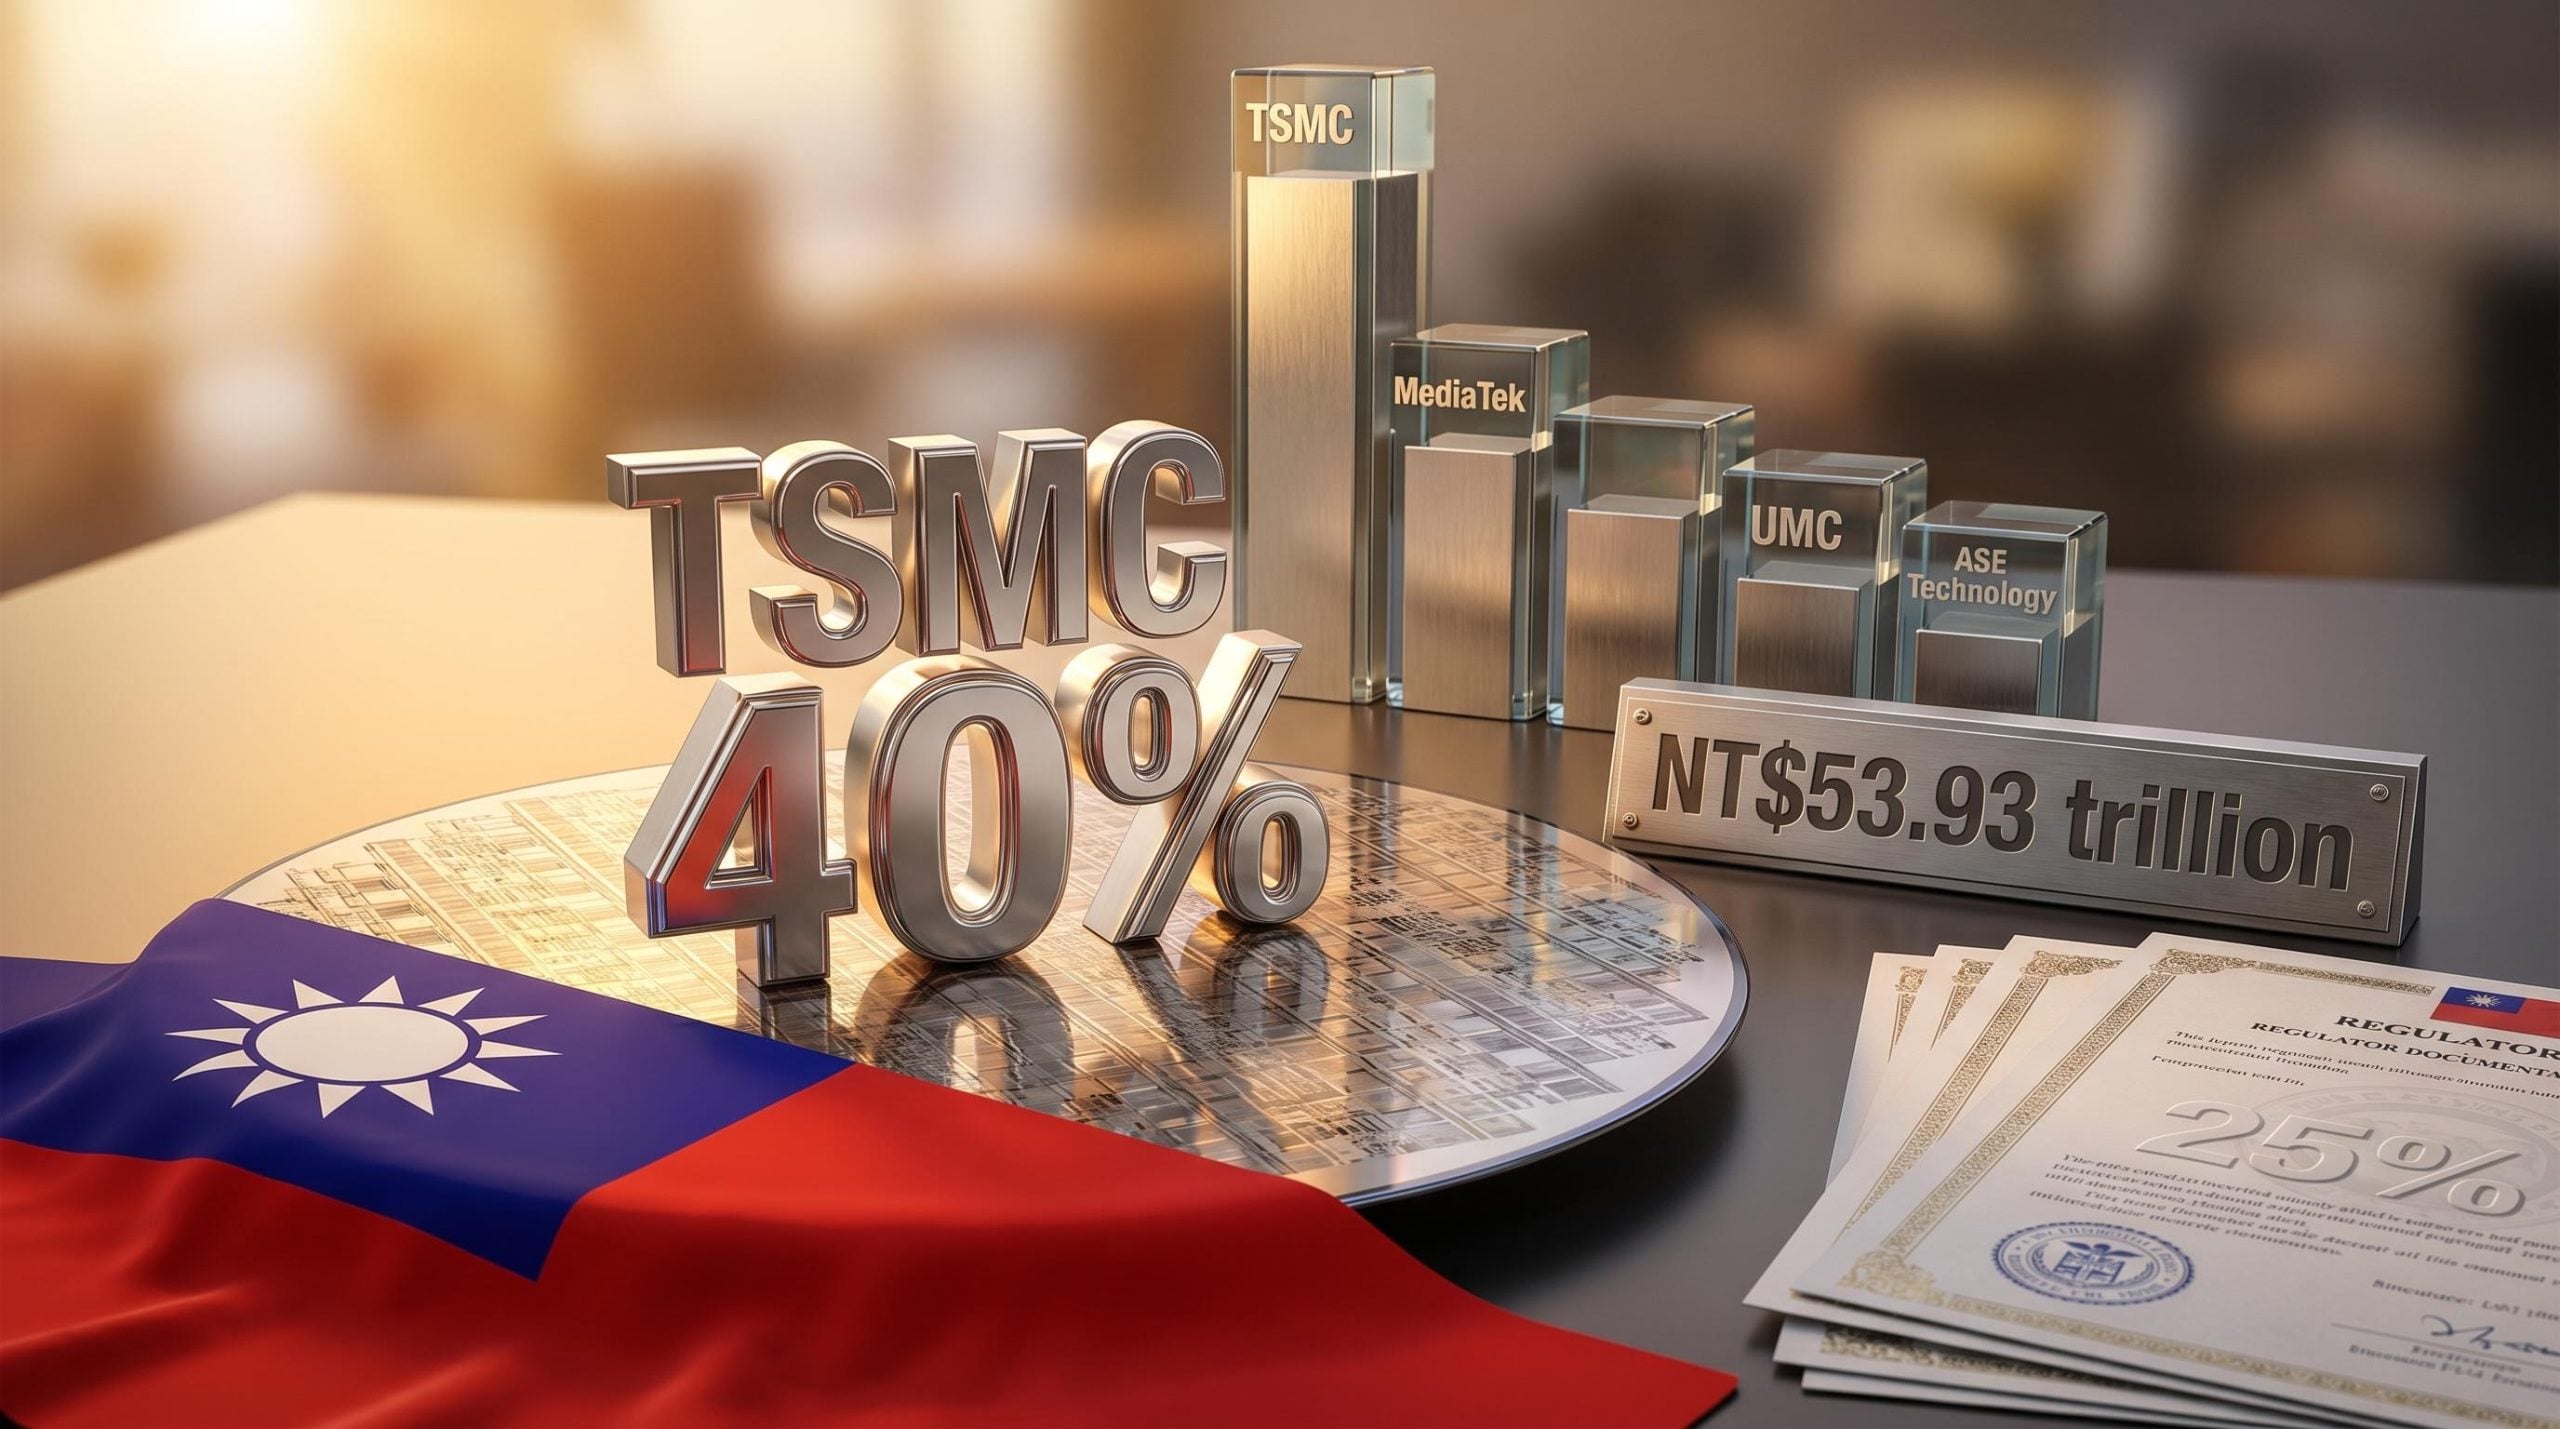
- The energy sector delivered a 38.2% total return in Q1 2026 via XLE, but became the sole S&P decliner in the week ending 13 April as ceasefire news drove oil prices lower.
- Investors should reassess sector allocations ahead of the 28-29 April FOMC meeting and upcoming PCE data, as the persistence of energy prices will determine Fed flexibility and corporate margin trajectories through Q2 2026.
The S&P 500 touched record highs above 7,100 during the same week that the Cleveland Federal Reserve’s inflation nowcast hit 3.58%, the highest reading since the energy crisis began. That juxtaposition defines the market’s current tension: major indices rallying on ceasefire hopes and AI-driven earnings while energy prices reshape inflation expectations and constrain Federal Reserve policy.
U.S. equity markets face an unusual environment in April 2026. The Iran conflict and resulting Strait of Hormuz closure created the most severe energy supply disruption in modern history, yet the S&P 500 climbed to 7,126.06 by the week ending 13 April. This disconnect between macro risk and market exuberance raises the question of whether the rally rests on solid ground or fragile assumptions. The following analysis unpacks how energy prices are reshaping inflation expectations, constraining Fed policy, and creating divergent fortunes across S&P sectors.
How the Strait of Hormuz closure triggered the biggest energy shock in decades
Roughly 20 million barrels of petroleum liquids transit the Strait of Hormuz daily under normal conditions. U.S. and Israeli military operations began roughly seven weeks prior to mid-April, prompting Iran to shut the Strait to nearly all petroleum shipping. The result was what the Energy Information Administration framed as the biggest energy supply interruption in contemporary history.
The EIA characterized the Strait of Hormuz closure as the biggest energy supply interruption in contemporary history, with 20 million barrels per day of petroleum liquids cut from global markets when Iran shut the waterway in late February 2026.
“The biggest energy supply interruption in contemporary history.” — Energy Information Administration
Crude oil touched $112 per barrel earlier in the week of 13 April, before falling sharply after a U.S.-Iran ceasefire announcement eased geopolitical tensions. The physical supply loss translated immediately into consumer pain. The U.S. national average gasoline price reached $4.11 per gallon as of 15 April 2026, up from under $3.00 pre-conflict. Regional variations were stark:
- East Coast: $4.00 per gallon
- West Coast: $5.40 per gallon
- Diesel: Projected to peak above $5.80 per gallon in April
The EIA assumes conflict does not persist past April, with production shut-ins at 9.1 million barrels per day in April falling to 6.7 million barrels per day in May. Whether energy prices normalise quickly or remain elevated determines whether current inflation is transitory or structural, a distinction that shapes every investment decision from here.
When big ASX news breaks, our subscribers know first
The inflation math that ended soft landing hopes
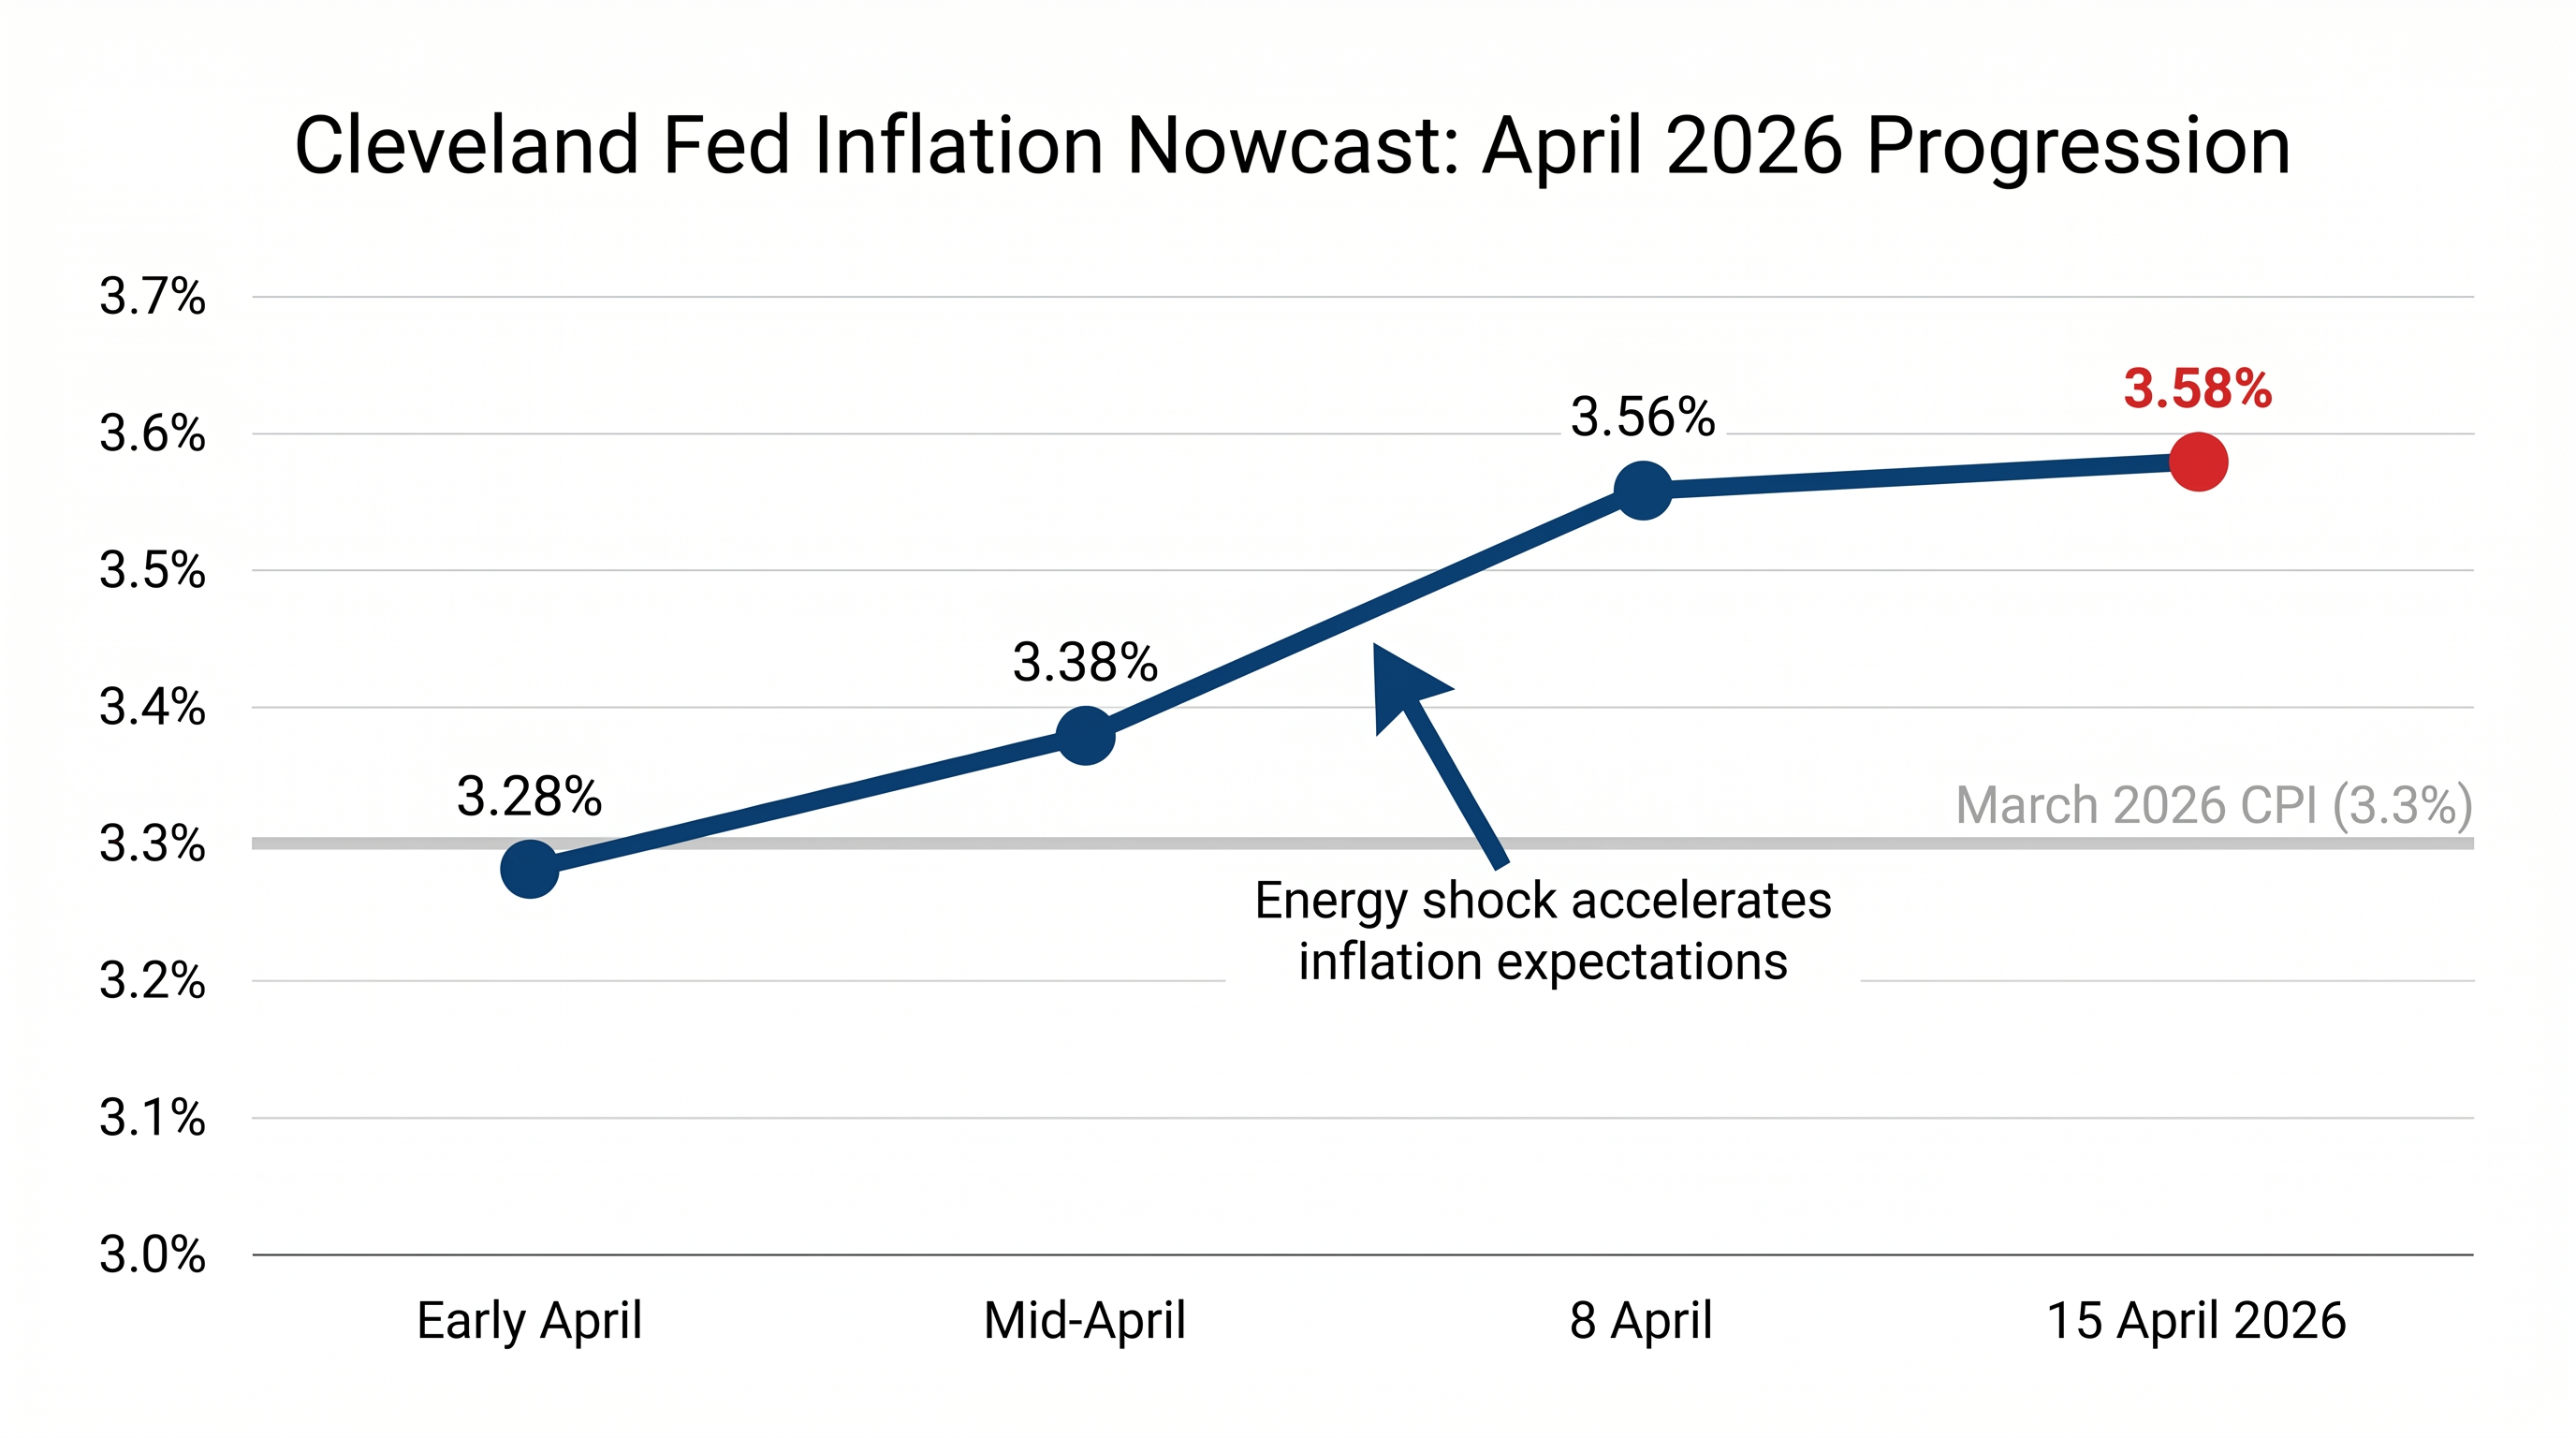
March 2026 CPI showed trailing 12-month inflation at 3.3%, a 90-basis-point jump from February. The Cleveland Fed’s inflation nowcast for April evolved week by week, climbing from 3.28% in early April to 3.58% by 15 April. The progression told the story of Fed options narrowing in real time.
| Date | Nowcast Estimate |
|---|---|
| Early April 2026 | 3.28% |
| Mid-April 2026 | 3.38% |
| 8 April 2026 | 3.56% |
| 15 April 2026 | 3.58% |
The 12.5% year-over-year energy price increase contributed 0.8 percentage points to overall CPI, with gasoline alone surging 21.2% in March. This inflation sequence unfolded in three steps:
- Energy shock from Strait of Hormuz closure
- CPI spike driven by fuel and input costs
- Fed policy constraint as rate cut justification evaporated
Markets now price an 80% probability of holding rates at 3.5%-3.75%, not cutting. Investors who anticipated summer rate cuts must recalibrate. The inflation trajectory determines Fed flexibility, and the data shows that flexibility has disappeared.
Markets that entered 2026 pricing two rate reductions now face how oil price dynamics eliminated Fed rate cut optionality, with the path from sub-3% inflation expectations in January to 3.58% nowcast readings in April reshaping the entire central bank policy calculus.
Why energy inflation constrains Fed policy differently than demand-driven price rises
Supply-shock inflation is a policy trap. The distinction matters because the Federal Reserve’s tools work differently depending on the inflation source.
Demand-pull inflation occurs when too much money chases too few goods. The Fed can cool this by raising rates, which dampens spending and hiring. Supply-shock inflation, by contrast, stems from physical supply constraints, not excess demand. Rate hikes in this scenario punish consumers without addressing the underlying problem. The Fed cannot drill for oil or reopen the Strait of Hormuz by adjusting the federal funds rate.
Characteristics of each type:
- Demand-pull inflation: Excess consumer spending, tight labour markets, wage-price spirals. Fed rate hikes cool demand and bring prices down.
- Supply-shock inflation: Physical supply disruptions, commodity price spikes, energy shocks. Fed rate hikes reduce consumer purchasing power but do not restore supply.
Markets viewing the energy spike as temporary may be overly optimistic. The Cleveland Fed’s own projections show inflation persisting above the 2% target through mid-2026. Expectations of Fed rate cuts had been a key pillar supporting elevated equity valuations alongside AI enthusiasm. The S&P 500’s Shiller P/E ratio entered 2026 at its second-highest level since January 1871. Treasury 10-year yields rose slightly at the week’s end despite flat weekly performance, reflecting the market’s gradual acceptance that higher rates will persist.
“Inflation return challenging S&P resilience via consumer and input costs.” — Wedbush
Grasping the Fed’s policy bind helps investors understand why the base case is now higher for longer, and why rate-sensitive sectors may underperform even if headline indices hold steady.
Sector rotation reveals the market’s energy winners and losers
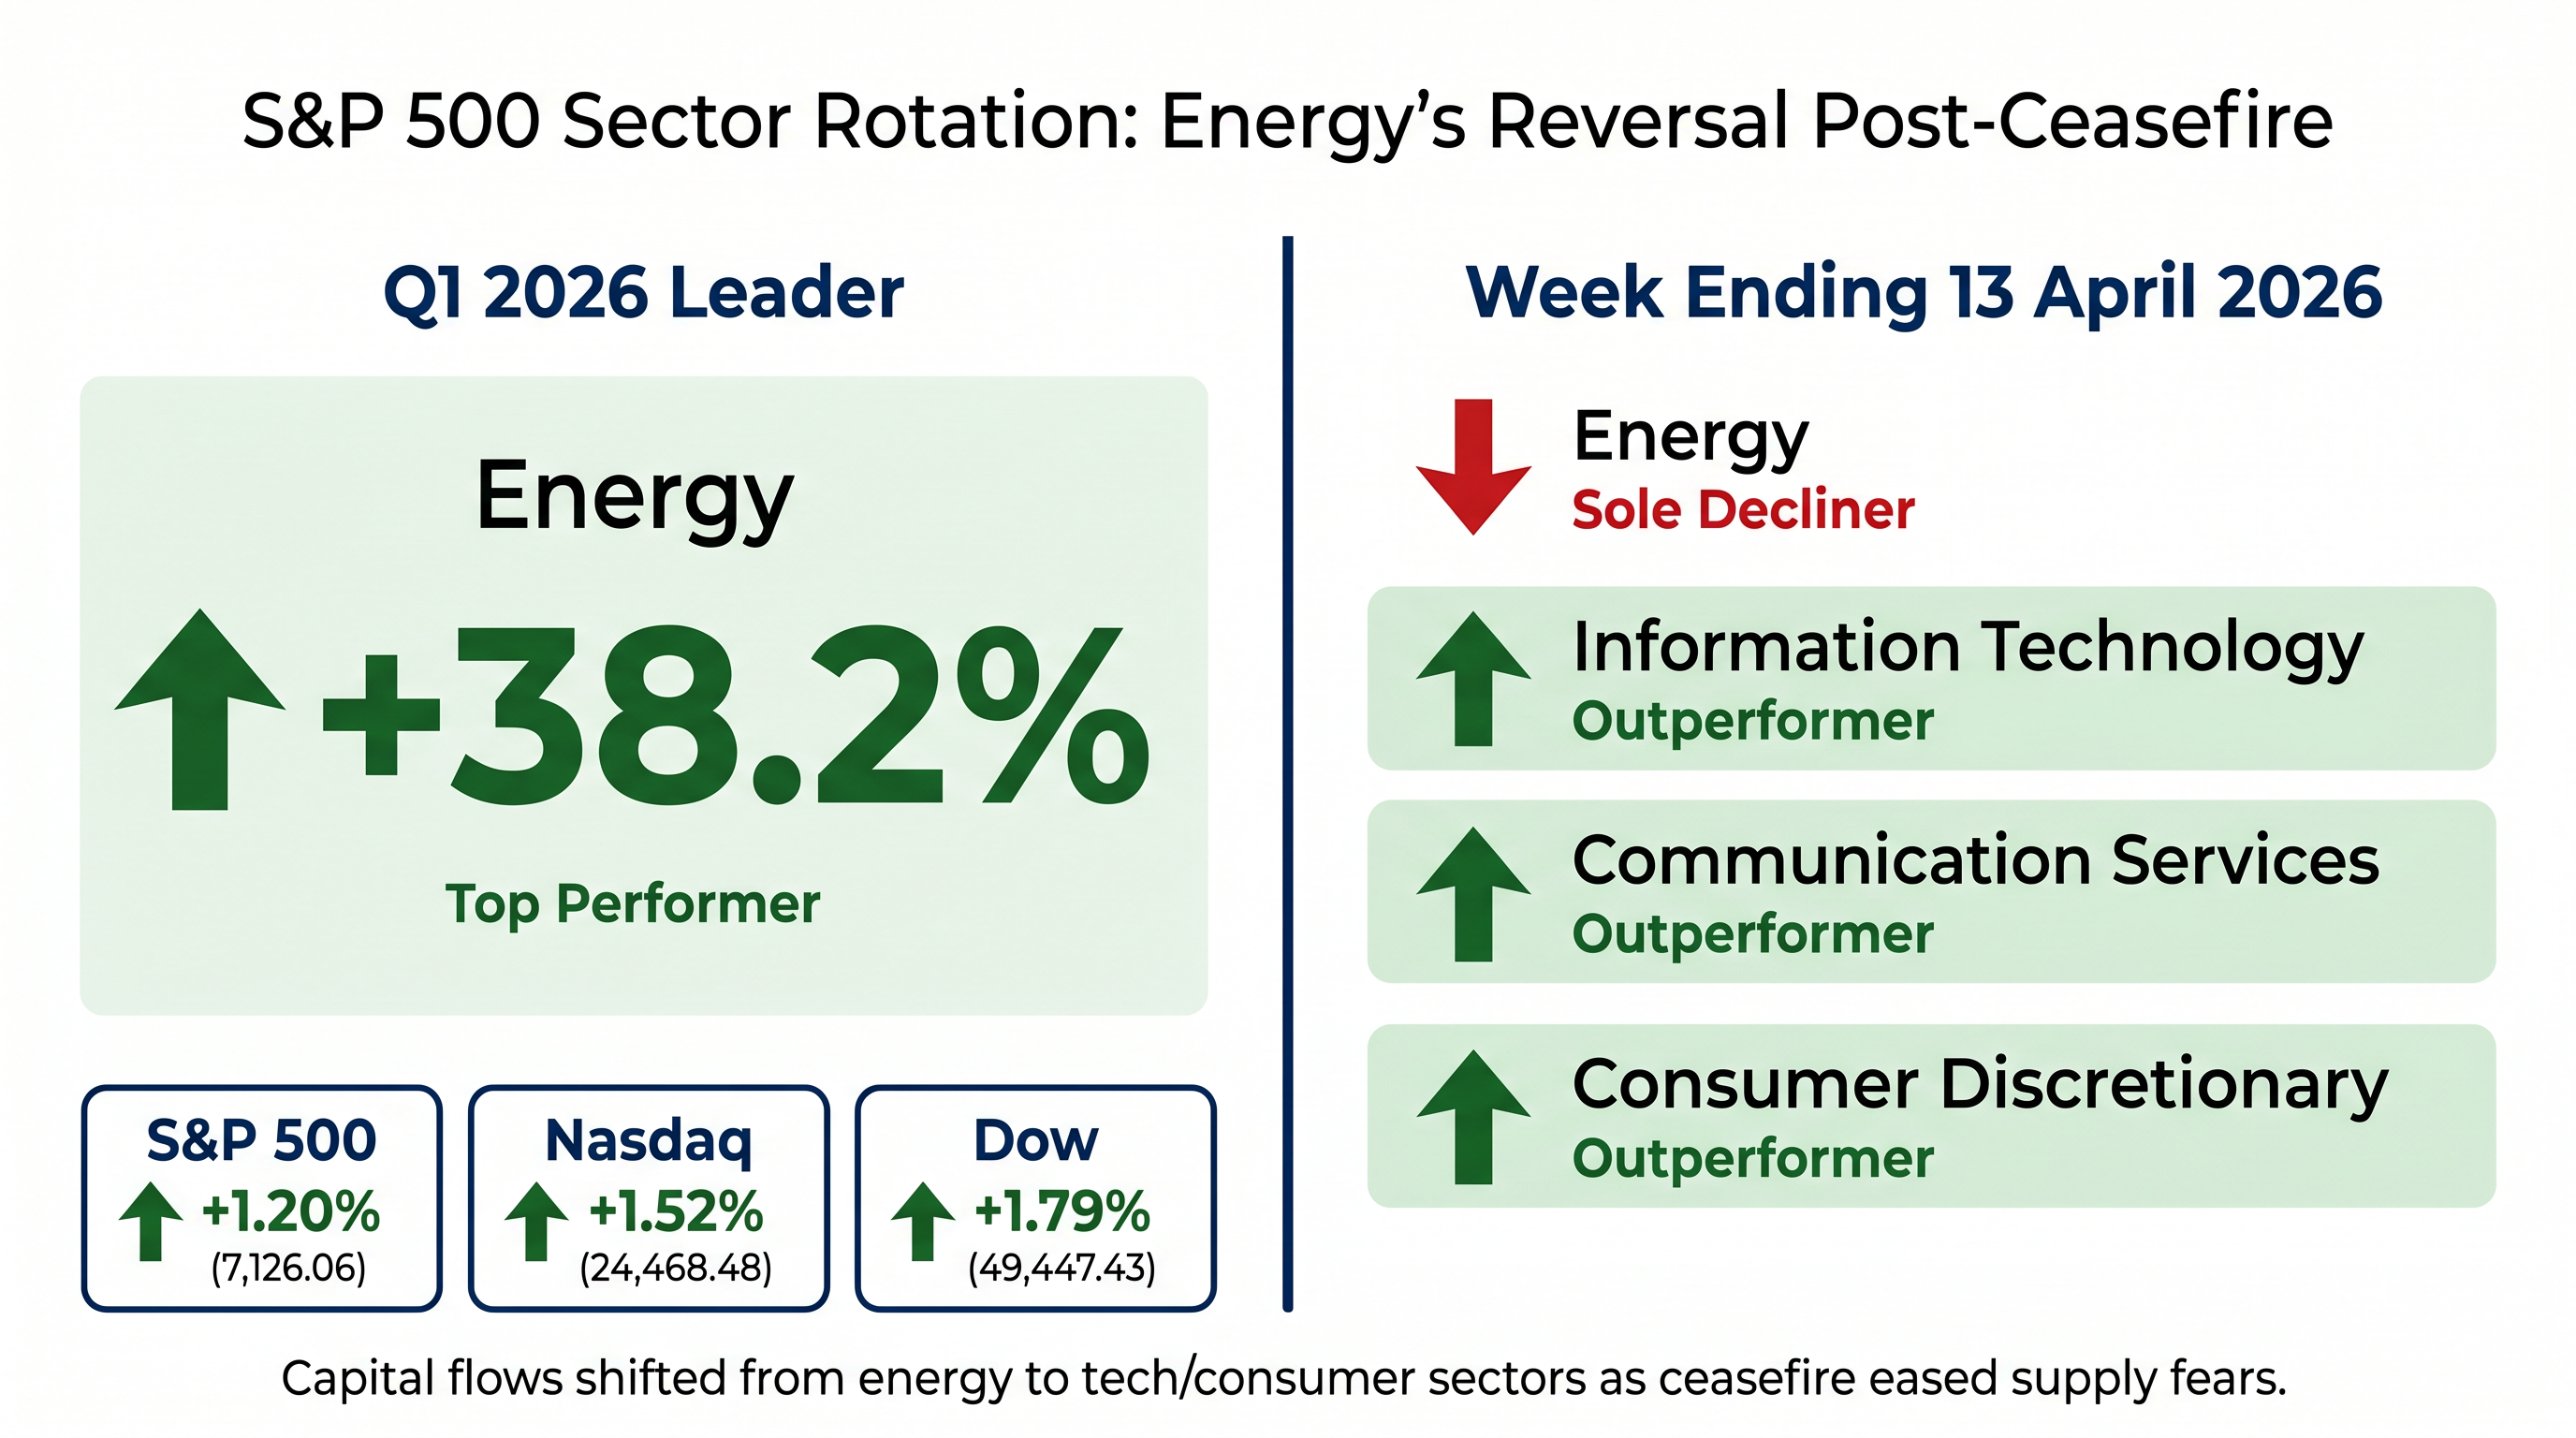
The energy sector led Q1 2026 with a 38.2% total return via XLE, driven by ExxonMobil, Chevron, and ConocoPhillips benefiting from elevated prices through cash flows and buybacks. The week ending 13 April told a different story. Energy was the sole decliner among 11 S&P sectors as oil fell post-ceasefire, while information technology, communication services, and consumer discretionary outperformed.
| Sector | Q1 2026 Return | Week Ending 13 April |
|---|---|---|
| Energy | 38.2% | Sole Decliner |
| Information Technology | N/A | Outperformer |
| Communication Services | N/A | Outperformer |
| Consumer Discretionary | N/A | Outperformer |
The rotation pattern shows capital flowing away from energy as ceasefire optimism reduced immediate supply fears, and toward sectors positioned to benefit from sustained consumer spending and technological innovation. The S&P 500 closed the week at 7,126.06, up 1.20%. The Nasdaq gained 1.52% to 24,468.48, while the Dow rose 1.79% to 49,447.43.
Wall Street frames energy as the ultimate macro variable. Higher fuel costs squeeze consumer discretionary spending and raise input costs for industrials. The energy tax dynamic means sectors reliant on consumer wallets or manufacturing throughput face margin pressure even as energy producers book record cash flows.
“Markets navigated Strait blockade volatility but reacted sharply to the ceasefire, questioning why investors aren’t more worried about ongoing geopolitical risks.” — Goldman Sachs
The sector rotation pattern reveals where capital is positioning as the energy crisis evolves. Investors can allocate portfolios by understanding which sectors benefit from elevated prices and which suffer from the consumer and input cost squeeze.
Investors exploring how to position energy allocations as the crisis evolves will find our full explainer on energy stock positioning during the Iran conflict, which compares integrated majors like ExxonMobil and Chevron against leveraged upstream pure-plays with detailed cash flow sensitivity analysis at different oil price scenarios.
The next major ASX story will hit our subscribers first
Corporate earnings signals from Q1 calls
Energy majors reported record cash flows in mid-April Q1 earnings calls. ExxonMobil, Chevron, and ConocoPhillips all benefited from the 12.5% energy price surge, deploying cash flows toward:
- Record cash flow generation from elevated oil and gas prices
- Share buyback programmes
- Dividend increases
The energy sector’s windfall contrasts sharply with the pressure building elsewhere in corporate America. Broader corporate earnings face rising input costs and discretionary spending cooling as the energy price spike filters through supply chains and consumer budgets. The S&P 500 entered 2026 with its Shiller P/E ratio at the second-highest level since 1871, supported by AI-driven earnings optimism that fueled tech outperformance. That optimism now faces the test of whether energy-driven cost pressures will erode margins in coming quarters.
What broader corporate earnings suggest
Specific Q1 call impacts on demand destruction remain unquantified in available updates. The energy tax dynamic is building, with consumer-facing companies and industrials absorbing higher input costs while discretionary spending shows signs of cooling. JPMorgan’s view that prolonged Hormuz obstruction could favour liquidity over emerging market equities suggests the investment community is positioning defensively.
Q1 earnings calls are the first window into how corporations are absorbing the energy shock. The divergence between energy sector windfalls and potential margin erosion elsewhere signals where earnings surprises may emerge in Q2. Investors should monitor upcoming earnings guidance for signs of whether companies can pass through higher costs or will face compressed margins.
Conclusion
The Strait of Hormuz disruption created a historic energy shock. Energy prices drove inflation to 3.58% according to the Cleveland Fed nowcast. Inflation eliminated Federal Reserve rate cut optionality, leaving markets pricing an 80% chance of holding rates at 3.5%-3.75%. Sector performance bifurcated between energy beneficiaries posting record cash flows and consumer-facing sectors absorbing the energy tax.
The ceasefire announcement eased crude prices temporarily, with oil falling from $112 per barrel earlier in the week of 13 April. The conflict’s resumption risk and elevated gasoline costs at $4.11 per gallon nationally mean the energy variable remains the dominant force shaping both Fed policy and sector rotation through Q2 2026.
The ceasefire announcement that drove oil down from $112 per barrel came amid week-by-week Hormuz crisis developments showing Iran re-closing the waterway just days after the initial announcement, creating the whipsaw price action that defined mid-April trading.
Investors should monitor the 28-29 April FOMC meeting minutes and upcoming PCE data for signals on whether the Fed will tolerate the energy bump or consider tightening. Sector allocations warrant reassessment based on energy price trajectory. The market’s ability to sustain record highs depends on whether energy prices normalise or the current shock proves more persistent than ceasefire optimism suggests.
Frequently Asked Questions
What is a supply-shock inflation and how does it affect the stock market?
Supply-shock inflation occurs when physical disruptions, such as an oil supply cutoff, drive prices higher rather than excess consumer demand. Unlike demand-driven inflation, the Fed cannot fix it by raising rates, which means equity markets face both persistent inflation and constrained policy flexibility.
How did the Strait of Hormuz closure impact energy prices in 2026?
The closure cut roughly 20 million barrels per day of petroleum liquids from global markets, pushing crude oil to $112 per barrel and the U.S. national average gasoline price to $4.11 per gallon by mid-April 2026, the biggest energy supply disruption in modern history according to the EIA.
What is the Cleveland Fed inflation nowcast and what is it showing for April 2026?
The Cleveland Fed inflation nowcast is a real-time estimate of the current month's CPI reading before official data is released. By 15 April 2026 it had climbed to 3.58%, up from 3.28% in early April, reflecting the ongoing energy price surge feeding through to consumer prices.
Which S&P 500 sectors are benefiting from the energy crisis and which are suffering?
The energy sector led Q1 2026 with a 38.2% total return as ExxonMobil, Chevron, and ConocoPhillips booked record cash flows, while consumer discretionary, industrials, and other consumer-facing sectors face margin pressure from rising input costs and reduced household spending power.
What should investors watch to gauge whether the Fed will cut rates in 2026?
Investors should monitor the 28-29 April FOMC meeting minutes and upcoming PCE data, as markets currently price an 80% probability of the Fed holding rates at 3.5%-3.75% with no cuts, depending on whether energy prices normalise after the ceasefire or remain elevated.