Nvidia Set to Reveal First Windows PC Processors at Computex
6 hrs ago


Westpac closed April at AU$38.43. The analyst community’s average price target sits between AU$34.75 and AU$36.29. That gap, compressed into a single number, captures the story facing every investor holding the stock today. Broker consensus on WBC has shifted to “Sell” or “Underweight” across a covering panel of approximately 14-15 analysts, following an ASX announcement on 14 April flagging higher provisions for the first half of 2026. The downgrade activity that followed sits within a broader macro environment of persistent inflation near 4%, a Reserve Bank of Australia (RBA) cash rate of 4.10% after a March hike, and market expectations of two further increases toward a peak of 4.85%. That backdrop is not incidental to Westpac’s situation; it is the engine driving it. What follows unpacks the trigger behind the downgrade cycle, the macro forces compounding the pressure, how Westpac’s position compares with its Big Four peers, and what investors who hold WBC primarily for dividend income need to weigh before the 1H26 result lands.
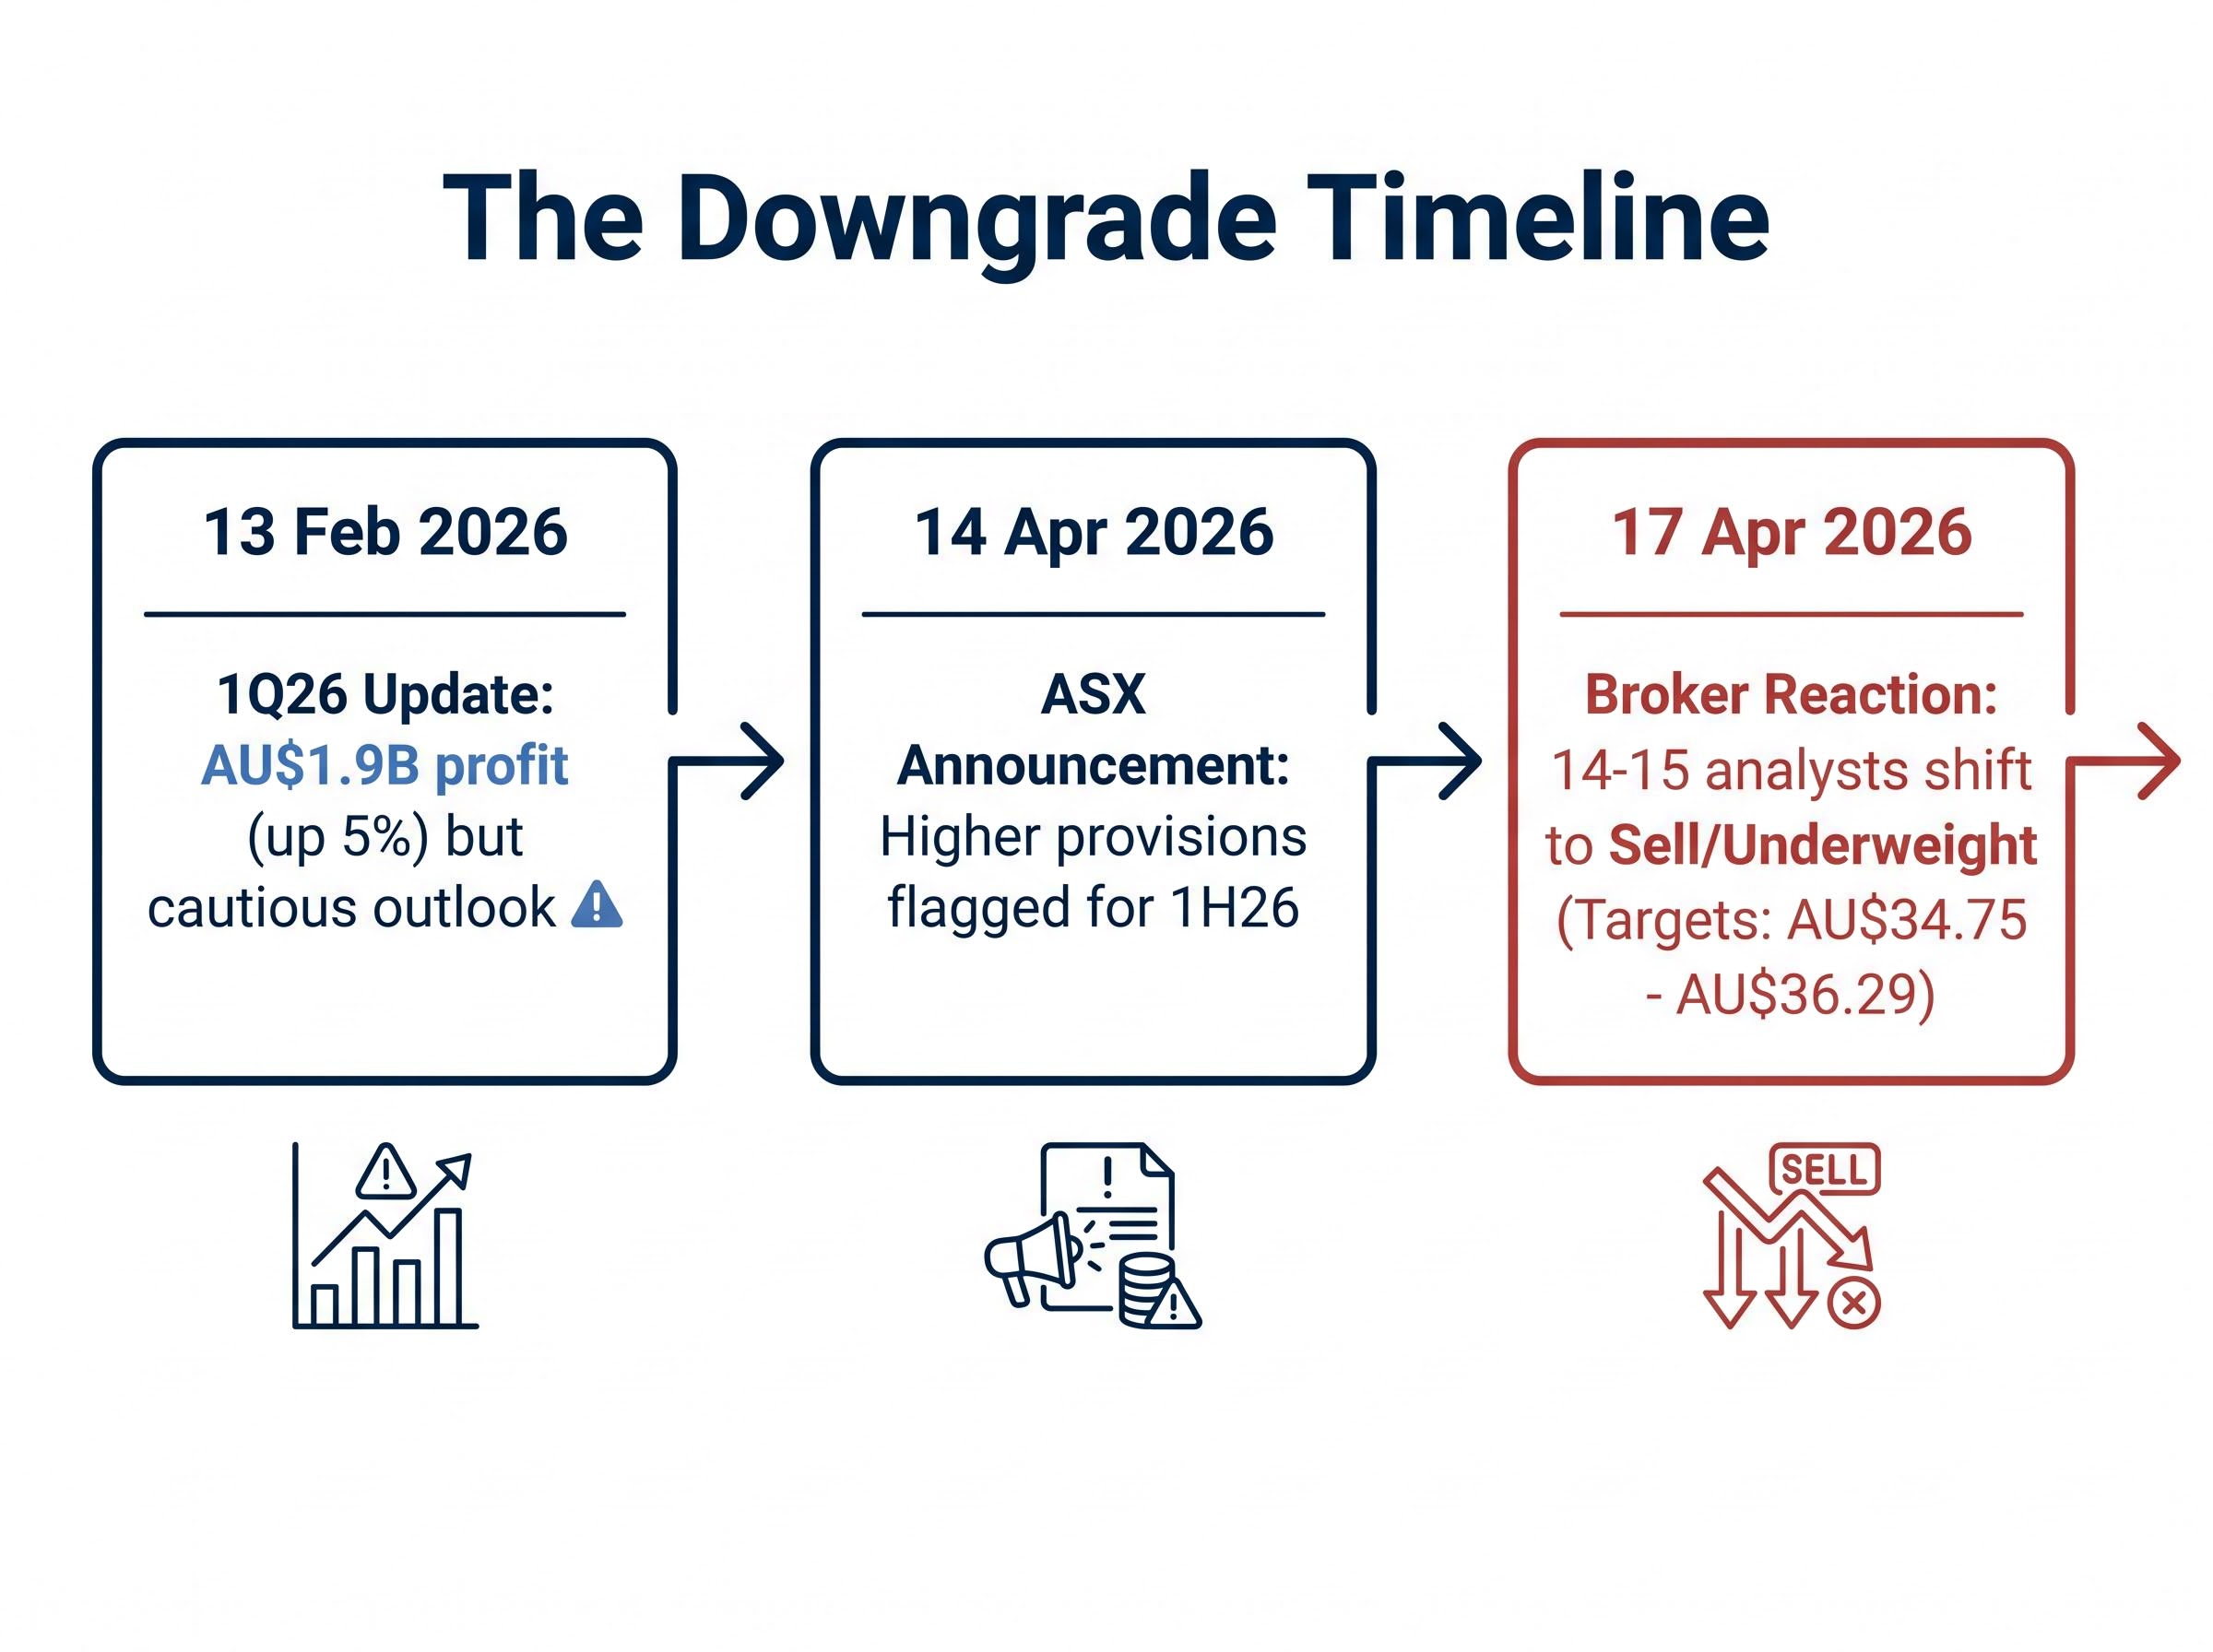
The sequence matters. On 13 February 2026, Westpac released its 1Q26 trading update. The headline figure was solid: unaudited statutory net profit of AU$1.9 billion, up 5% on the second half of 2025. Credit quality was described as stable. But the language surrounding the result carried a different signal, referencing energy-driven inflation risks and the potential for borrower stress in the quarters ahead.
Two months later, on 14 April 2026, Westpac lodged an ASX announcement disclosing items expected to impact its 1H26 results, including higher provisions. By 17 April, downgrade activity across the broker community had followed.
Beyond the provisions overlay, Westpac also confirmed the RAMS portfolio sale to a Pepper Money, KKR, and PIMCO consortium will generate a AU$75 million post-tax hit to reported 1H26 profit, adding a second line item separating the statutory result from the underlying operating picture.
The surface and the signal: Westpac reported AU$1.9 billion in quarterly profit, a 5% increase. The April disclosure of higher provisions told a different story: one of forward-looking stress, not backward-looking strength.
The distinction is worth understanding. Higher provisions are not a past loss; they are a bank’s own estimate that future losses are rising. Brokers read the April disclosure as a margin and credit-quality warning, not a one-off adjustment. The consensus shifted to “Sell” or “Underweight” across approximately 14-15 analysts because the disclosure chain, from February’s cautious language to April’s explicit provisioning flag, pointed in one direction.
Investors who tracked only the February profit figure may have missed the shift. The April announcement reframed the earlier result as a peak rather than a platform.
The inflation and rate environment Westpac cited in its trading update is not a scenario sitting on a whiteboard. It is already embedded in the rate cycle.
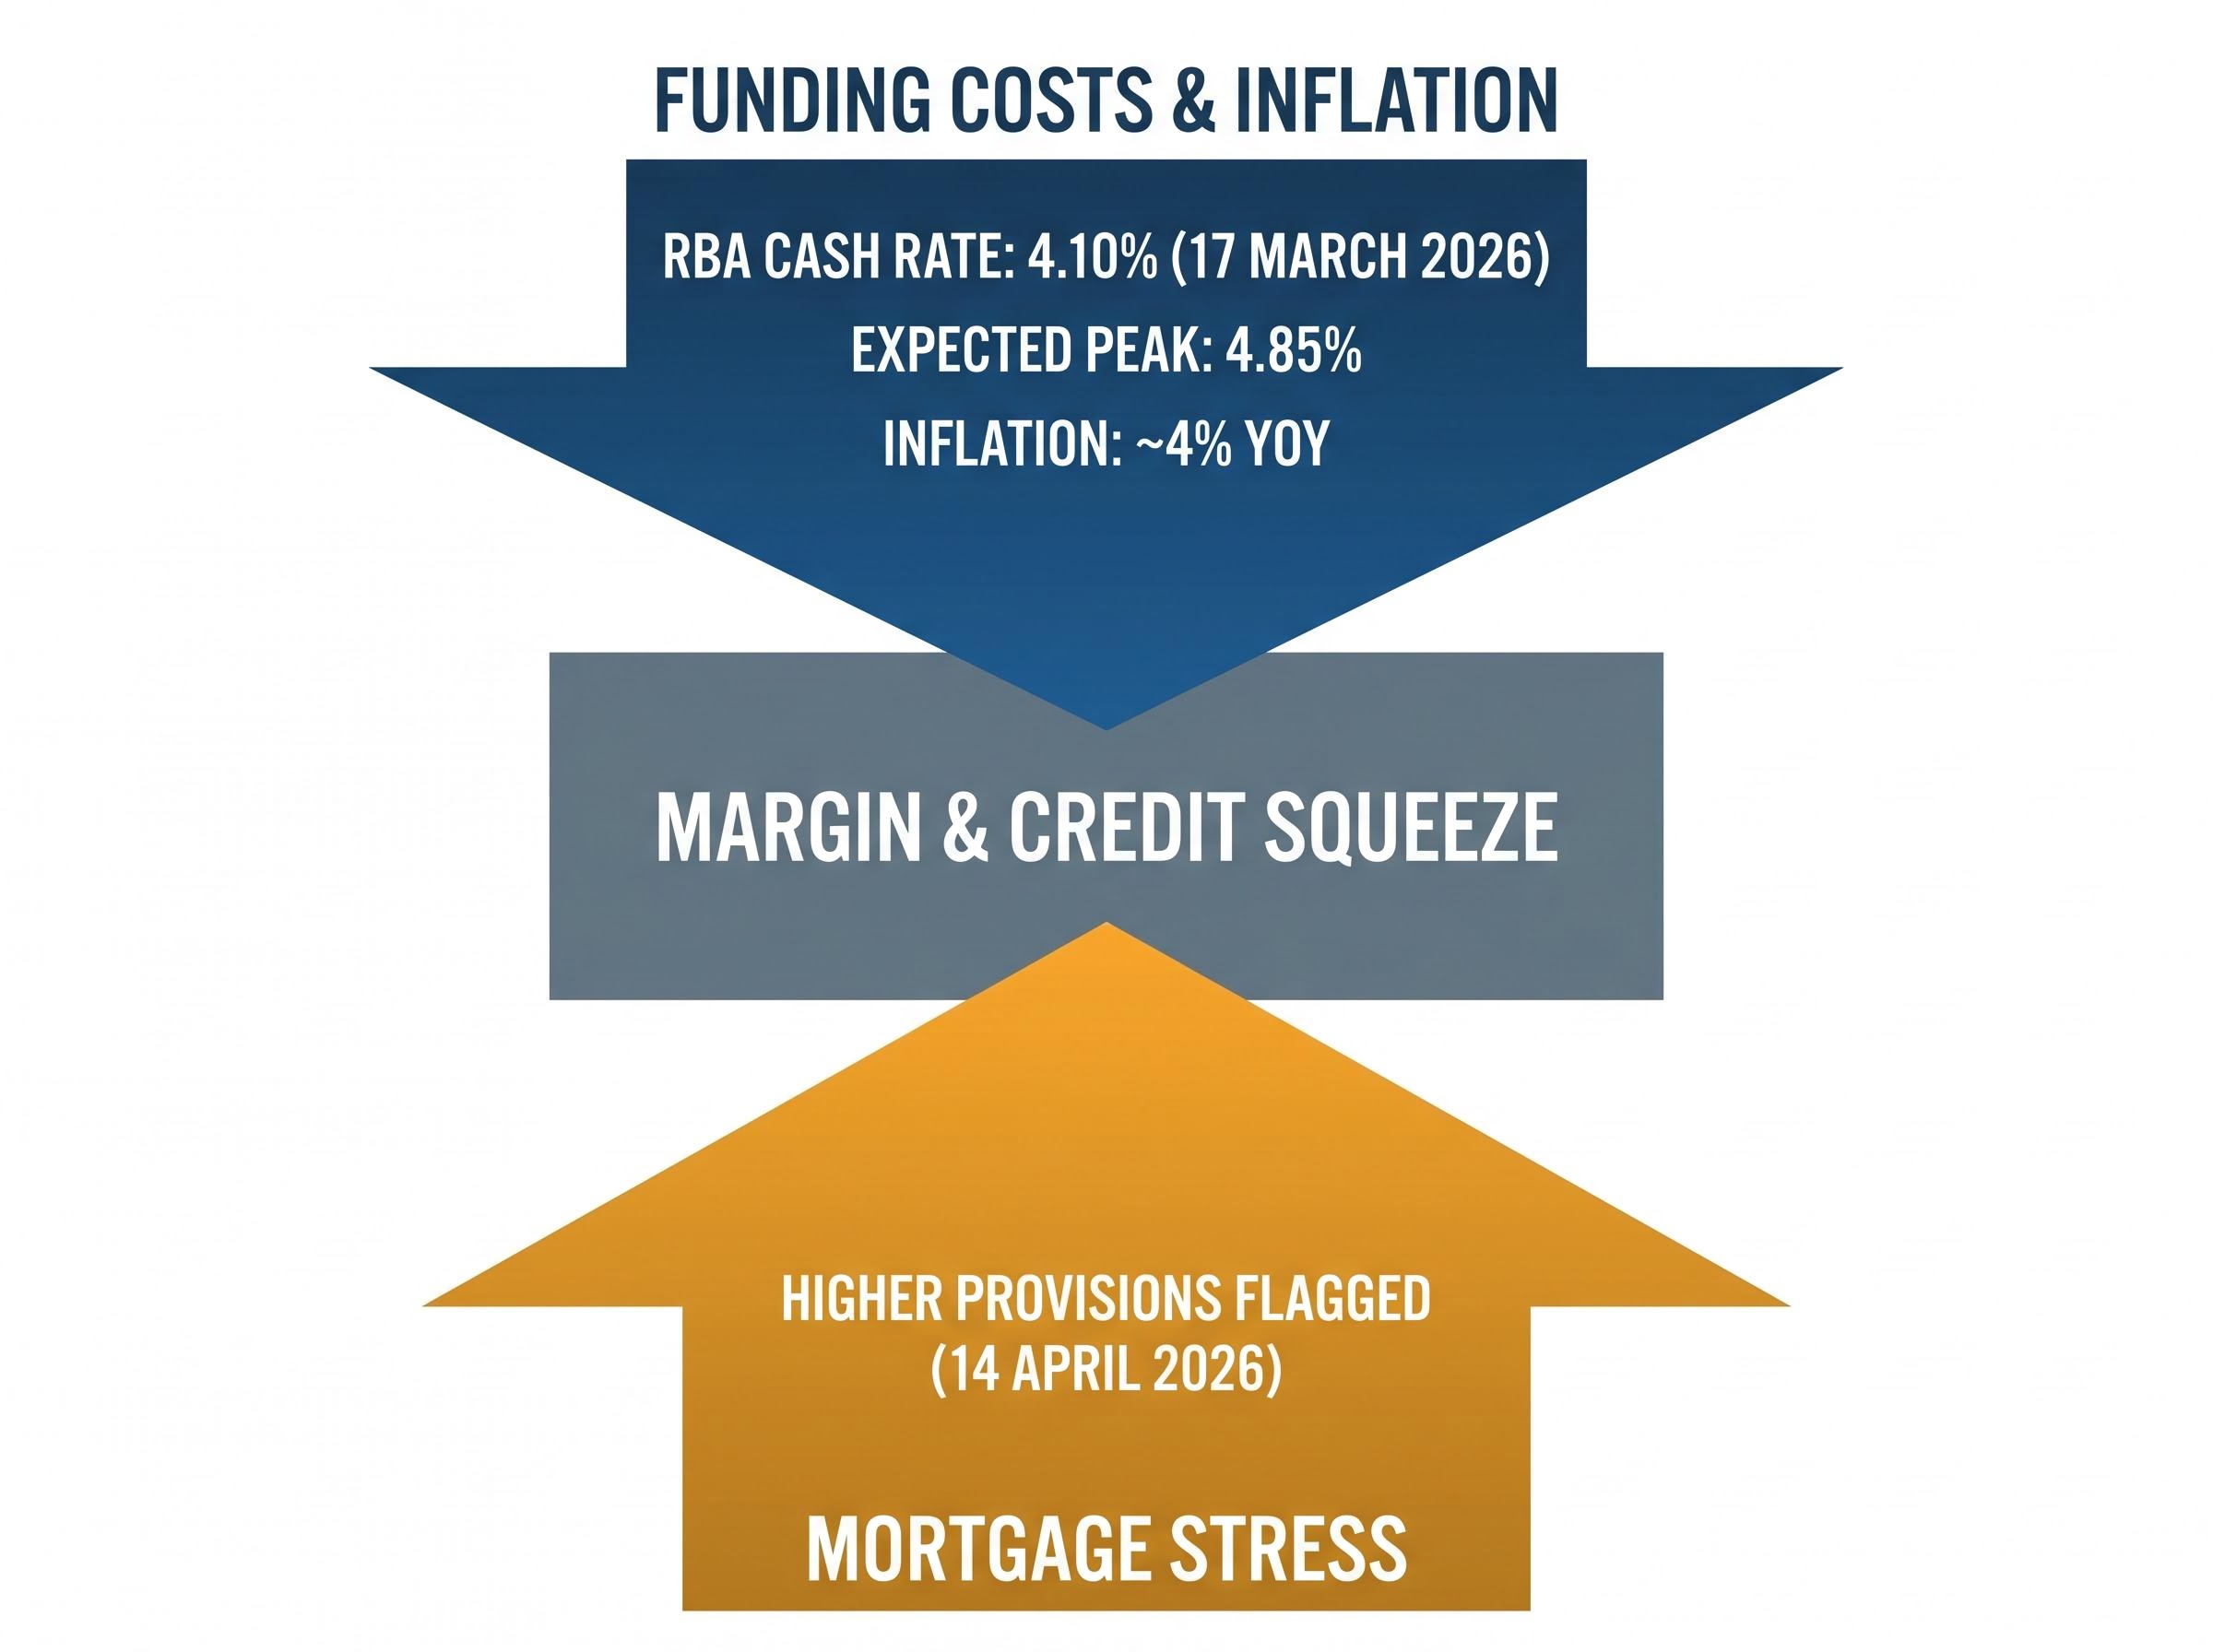
As of 17 March 2026, the RBA cash rate stands at 4.10% following a 25 basis point hike. Market and economist expectations point to approximately two further increases, targeting a peak of around 4.85%. The driver is persistent inflation, running at approximately 4% year-on-year, fuelled in part by energy supply shocks that Westpac itself identified as a risk factor.
Australian inflation dynamics in early 2026 complicate the picture further: headline CPI reached 4.6% in March, nearly double the top of the RBA’s 2-3% target band, while trimmed mean inflation held at 3.3%, suggesting the acceleration reflects energy price volatility rather than a broad deterioration in underlying price pressures.
The RBA’s March 2026 monetary policy decision confirmed the 25 basis point increase to 4.10% and cited persistent inflation as the primary driver, providing the official basis for market expectations of further tightening toward the 4.85% peak that Westpac’s own risk commentary referenced.
| Indicator | Current level | Expectation | Westpac implication |
|---|---|---|---|
| RBA cash rate | 4.10% | Two further hikes toward 4.85% | Higher funding costs, compressed margins |
| Inflation (YoY) | ~4% | Persistent through 2026 | Sustained rate pressure, no near-term relief |
| Energy supply | Ongoing shocks | Cited by Westpac as inflation driver | Feeds through to borrower cost-of-living pressure |
The problem for Westpac is that higher rates cut both ways simultaneously. On one side, funding costs rise. On the other, the probability of mortgage stress across the loan book increases as borrowers absorb higher repayments. That dual-sided squeeze, margin pressure from above and credit deterioration from below, is not theoretical. It is the condition the April provisions disclosure appears to reflect.
Extended rate pressure above 4% stretches debt-service capacity for variable-rate mortgage holders, and variable-rate lending forms the core of Westpac’s retail book. As rates push toward the expected 4.85% peak, the proportion of borrowers under repayment stress rises.
The 14 April higher provisions disclosure suggests Westpac’s own internal credit modelling has already moved to reflect this reality. The bank is not waiting for stress to materialise; it is provisioning for it now. That is the signal brokers acted on.
Westpac’s downgrade is not an isolated event. A widely cited analysis from 16 April 2026 rated three of the four major Australian banks as “Sell,” with only one rated “Buy.” The sector-wide repositioning suggests brokers are repricing the entire banking cohort against the same macro headwinds, not singling out Westpac for company-specific failure.
The distinctions between the majors still matter, however, and they matter most for investors considering a rotation out of WBC and into a peer.
| Bank | Share price | Consensus rating | Consensus target | Implied downside |
|---|---|---|---|---|
| WBC | AU$38.43 | Sell / Underweight | AU$34.75 – AU$36.29 | ~10.6% – 16.0% |
| CBA | AU$174.49 | Mixed (buy-side outlier) | AU$129.88 | ~28% |
| NAB | — | Sell (sector analysis) | — | 12% profit growth noted |
| ANZ | — | Sell (sector analysis) | — | — |
Commonwealth Bank trades at a price-to-earnings ratio of 28 with a consensus target implying approximately 28% downside from its current price, making it the most overvalued of the group on a relative basis, even as some analyses position it as the sector’s sole constructive call. NAB reported 12% underlying profit growth in its most recent results, offering a benchmark for what near-term earnings resilience looks like when it exists.
Over five years, WBC has returned approximately 56%, compared with 96% for CBA and 24% for the ASX 200. Westpac has outperformed the index but trails the sector leader by a wide margin.
The sector context is important because it prevents a reflexive rotation. An investor exiting WBC on downgrade concerns who moves into CBA faces a stock carrying even larger implied downside to consensus targets. The problem is not Westpac alone; it is the pricing of the entire major bank sector relative to the analyst community’s forward view.
Morningstar’s Big Four valuation analysis flagged signs of frothy valuations across the major banks in early 2026, with elevated price-to-earnings multiples cited as a key concern, a finding that contextualises why the sector-wide broker repositioning extended well beyond Westpac to encompass CBA and the other majors.
Many Australian retail investors hold Westpac for one reason: income. The stock has long been positioned as a reliable dividend payer in a market where yield-focused portfolios lean heavily on the major banks. The current situation forces a specific calculation.
The analyst consensus implies 10.6% to 16.0% capital erosion from the AU$38.43 close, based on targets of AU$34.75 to AU$36.29. At the lower end of the analyst range, AU$32.29 implies approximately 16.0% downside. A dividend yield that appears attractive at today’s price looks materially different when set against that capital loss.
Forward estimates project a dividend of approximately AU$1.70 per share by 2028, though this remains an estimate rather than confirmed guidance. Even if the dividend holds, a re-rating toward the consensus target range would erode total return significantly for investors who entered at or near the current price.
For income investors wanting to model the specific scenarios in detail, our dedicated guide to Westpac’s dividend forecast examines the FY25 confirmed payout of AU$1.53, the path to the projected AU$1.70 by FY28, the three risk factors that could interrupt that trajectory, and the historical context of Westpac’s only dividend cut in over a decade.
The stress case: An analyst target of AU$32.29 implies approximately 16.0% capital downside from today’s close. Income investors should weigh whether the dividend stream over the next 12 months is sufficient to offset that potential erosion.
Detailed fund manager commentary on Westpac’s yield-versus-downside calculus for April 2026 is not publicly available in current sources. The structural tension, however, is clear from the data: the stock’s income appeal is being tested by the scale of the analyst-implied markdown. Westpac carries a market capitalisation of approximately AU$133 billion and a five-year return of roughly 56%, but those figures reflect a period that preceded the current downgrade cycle.
The analyst picture is unambiguous in direction, if not in magnitude. Approximately 14-15 analysts rate WBC at “Sell” or “Underweight,” with a consensus target range of AU$34.75 to AU$36.29 and a downside case at AU$32.29. The question is whether that consensus hardens or softens over the coming months.
The broker consensus targets clustering 8-11% below the current share price reflect a consistent directional signal from multiple independent analysts, with Westpac’s trailing price-to-earnings ratio of 21.39 viewed as elevated for a mature bank facing both margin compression and rising credit costs.
Three scenarios frame the range of outcomes:
Sentiment is not uniformly bearish. Some analysts maintain Hold ratings and note that an earlier-than-expected RBA pause or faster credit stabilisation could provide grounds for a more constructive view. The consensus is a current reading, not a locked verdict.
The 1H26 result is the single most important event on the horizon for Westpac holders. The 14 April provisions announcement sets a negative pre-announcement tone, meaning the result itself will either validate the downgrade thesis or provide grounds for revision.
Within that result, the figure to watch is any revision to credit provisions relative to what the April disclosure signalled. If provisions come in at or above the flagged level, the Sell consensus is likely to hold. If they stabilise below expectations, the path to broker upgrades opens, and the income investor calculus shifts with it.
The analytical threads converge on a consistent picture. A specific disclosure chain, from February’s cautious language to April’s explicit provisioning flag, triggered the downgrade cycle. A macro environment of persistent inflation and an extended RBA hiking cycle validates those concerns in real time. Sector context confirms that Westpac is not uniquely troubled but is specifically exposed within a banking cohort that brokers have broadly repriced.
For the income-focused retail investor who holds WBC for its dividend, the yield-versus-downside calculation is the one that matters most, and it is one each holder must run against their own portfolio context and time horizon. The 1H26 result and any RBA decisions in the coming months are the two variables most likely to move the analyst consensus from its current position.
This article is for informational purposes only and should not be considered financial advice. Investors should conduct their own research and consult with financial professionals before making investment decisions. Past performance does not guarantee future results. Financial projections are subject to market conditions and various risk factors.
The analyst consensus target for Westpac (WBC) sits between AU$34.75 and AU$36.29, implying approximately 10.6% to 16.0% downside from the AU$38.43 April close, with a downside case at AU$32.29.
Brokers downgraded Westpac following an ASX announcement on 14 April 2026 disclosing higher provisions expected to impact 1H26 results, which analysts read as a forward-looking signal of rising credit stress rather than a one-off adjustment.
With the RBA cash rate at 4.10% and market expectations pointing to a peak near 4.85%, Westpac faces a dual squeeze: rising funding costs compressing margins and increased mortgage stress across its variable-rate loan book.
Income investors need to weigh a projected dividend of approximately AU$1.70 per share by FY28 against analyst-implied capital erosion of 10.6% to 16.0%, as the potential share price decline could more than offset dividend income over a 12-month horizon.
Three of the four major Australian banks carry Sell ratings from brokers, with CBA trading at a price-to-earnings ratio of 28 and facing roughly 28% implied downside to consensus targets, meaning rotating from WBC into a peer does not necessarily reduce valuation risk.