Lululemon Fundamental Analysis: the Price of Brand Dilution
10 mins ago

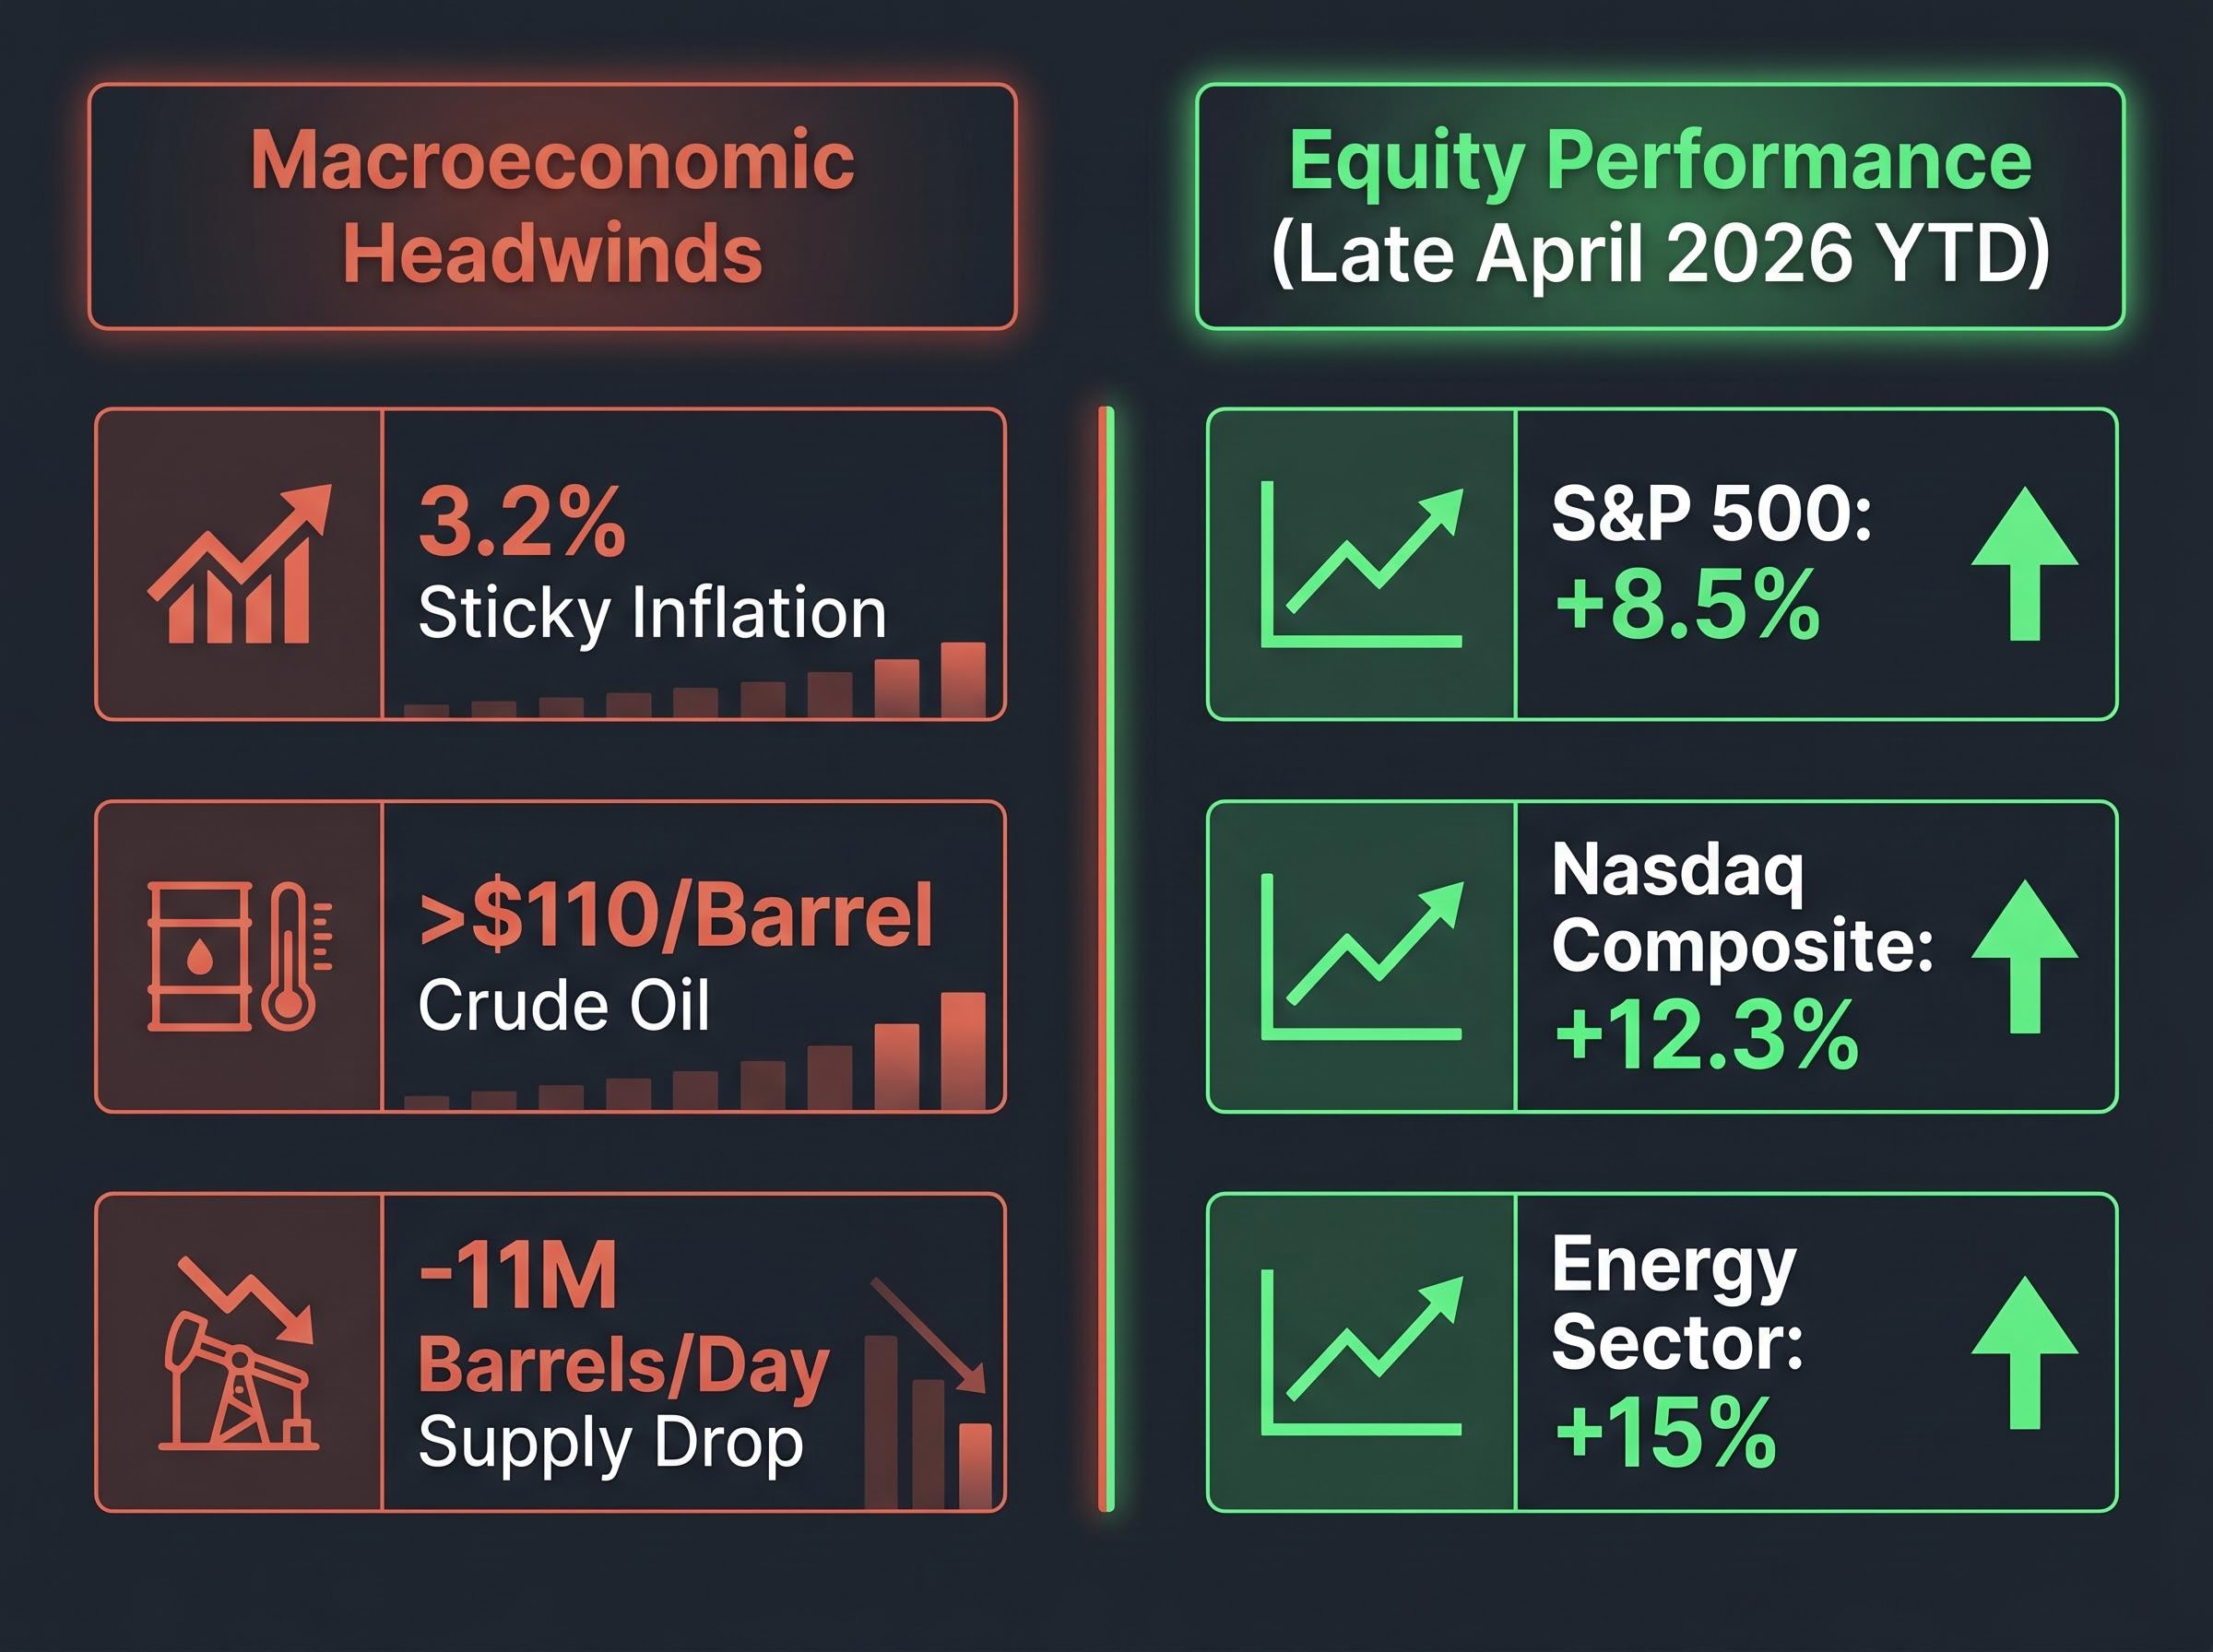
Late April 2026 presents a sharp divergence between global anxiety and equity performance. Current stock market trends reveal major US indices climbing steadily upward despite a backdrop of escalating geopolitical friction. The Federal Reserve holds interest rates steady amid sticky 3.2% inflation, while Middle East conflicts have pushed global oil prices above $110 per barrel.
The S&P 500 has recorded an approximate 8.5% year-to-date climb against these macroeconomic pressures. This gap between the shock’s severity and the market’s response reveals how capital is concentrating in highly specific areas. Two structural forces are driving this defiance: artificial intelligence infrastructure buildouts and resilient digital payment networks.
These distinct sectors are absorbing the impact of higher energy costs and prolonged borrowing rates. Their combined momentum provides a buffer against broader economic headwinds, forcing analysts to look past headline risks to identify where institutional capital is actually flowing.
The US economy faces specific friction points that traditionally suppress equity valuations. The primary pressure stems from the Strait of Hormuz, where regional hostilities have removed roughly 11 million barrels per day from global supply. This disruption has sent crude oil prices spiking above $110 per barrel, complicating the central bank’s inflation battle.
The stubbornness of these energy shocks is forcing institutional investors to recalibrate expectations for monetary easing, as central bankers wait for decisive cooling in core domestic inflation metrics.
Consumer-dependent sectors are already showing strain from these elevated costs. Booking Holdings reported a decline in first-quarter accommodation reservations, prompting travel and hospitality operators to withdraw their forward guidance. Yet the broader economy continues to expand, with gross domestic product posting a 2.5% annualised growth rate in the first quarter.
This localised pressure contrasts sharply with the performance of major equity benchmarks. Capital is rapidly concentrating in sectors insulated from consumer-level inflation and supply chain shocks.
The divergence between economic friction and index performance is evident in late April 2026 metrics:
S&P 500: Up approximately 8.5% year-to-date despite sticky 3.2% inflation. Nasdaq Composite: Advancing 12.3% year-to-date on sustained technology demand. Energy Sector: Surging 15% year-to-date in direct correlation with supply constraints. US Federal Reserve: Holding benchmark borrowing costs steady while monitoring price stability.
This concentrated capital movement helps investors separate broad market noise from sector-specific impacts. Headline risks do not uniformly depress prices when liquidity rotates efficiently into insulated growth pillars.
The primary force countering macroeconomic headwinds is an unprecedented wave of corporate spending. Capital expenditures, or capex, represent the funds large technology companies allocate to acquire, upgrade, and maintain physical assets. In 2026, these physical assets take the form of massive data centres required to train and run artificial intelligence systems.
Four major US hyperscalers have committed an aggregate $650 billion toward artificial intelligence infrastructure this year. This represents a 71.1% year-over-year increase in spending, completely detached from consumer sentiment or retail inflation. Corporate adoption metrics explain this urgency.
According to recent surveys, 86% of organisations plan to increase their artificial intelligence budgets in 2026. In North America, 48% of firms are planning budget hikes specifically targeting artificial intelligence workflows and infrastructure. Recent studies show that these infrastructure investments drove revenue gains for 88% of responding organisations.
The McKinsey cost of compute analysis highlights how this rapid shift toward specialized processing architecture represents a structural change in corporate technology budgets rather than a temporary spending spike.
Industry Demand Projection “Global data centre demand is projected to reach $7 trillion by 2030, driven by the transition from generic compute to specialised artificial intelligence processing,” according to analysis from McKinsey.
This scale of investment triggers a “picks and shovels” rotation across the broader market. Capital flows past the highly valued software developers and directly into the balance sheets of the companies building the physical foundations. Semiconductor fabricators, commercial real estate operators, and power generation firms become the primary beneficiaries of this spending.
The secondary market effects are particularly concentrated in the utilities sector. Data centres consume vast amounts of electricity, forcing technology giants to secure independent power agreements. This dynamic turns previously slow-growing utility and energy providers into high-growth infrastructure plays, effectively shielding investor capital from consumer market volatility.
The theoretical promise of infrastructure spending has materialised into definitive corporate earnings. First-quarter results demonstrate that capital expenditures are generating immediate financial returns for the companies supplying the hardware and power. The convergence of energy requirements and computing scale is producing revenue growth that outpaces the drag of high interest rates.
The resulting semiconductor supercycle has provided immediate and guaranteed revenue streams for fabricators and component designers, reinforcing the broader technology sector against macroeconomic pressures.
Bloom Energy serves as the clearest case study for this dynamic. The alternative energy provider reported total first-quarter revenue of $751.1 million, representing a 130% year-over-year increase. This result thoroughly exceeded the consensus estimate, driven heavily by data centre power requirements.
The company’s stock surged following its earnings release and the announcement of a collaboration with Oracle to power regional computing facilities. This transition from abstract technology hype to undeniable corporate revenue helps investors evaluate whether current valuations are grounded in actual sales.
The infrastructure buildout is delivering comparable financial momentum across related sectors:
Micron: Shares advanced 76.76% year-to-date as of late April 2026, supported by severe supply constraints in specialised memory chips. Broadcom: The semiconductor supplier recorded a 15.77% year-to-date gain, directly tied to data centre networking requirements. Intel: First-quarter revenue rose 7% year-over-year to $13.6 billion, falling perfectly in line with corporate guidance. Nasdaq: The exchange operator reported record first-quarter net revenue of $1.4 billion, heavily driven by increased trading volumes in technology infrastructure and fintech equities.
Market analysts maintain that the current momentum does not reflect a speculative bubble, provided corporate spending continues. However, financial institutions note significant valuation risks for certain unnamed stocks trading at multiples as high as 73x forward earnings. These specific equities assume uninterrupted capital expenditure and remain highly vulnerable to any sudden pauses in institutional budgets.
While infrastructure spending anchors the technology sector, digital transaction data proves the underlying US economy remains resilient. Leading credit and payment networks function as a highly accurate barometer for overall consumer health. Their first-quarter processing metrics indicate that domestic and international spending has not cracked under the pressure of elevated energy costs.
The global transition away from physical currency provides payment processors with real-time visibility into economic activity. Despite international hostilities and margin pressures on travel operators, cross-border transaction volumes continue to expand. Consumers are absorbing the impact of 3.2% inflation without significantly curtailing their daily electronic transactions.
The three largest payment networks all reported first-quarter results that surpassed financial analyst expectations. Visa recorded a 15% increase in total revenue, driven by an 11% jump in cross-border volume. This metric highlights a continuous appetite for international commerce, countering the negative guidance from isolated hospitality brands.
The Visa first-quarter financial results validate this trend of resilient consumer behaviour, demonstrating that cardholders are maintaining their international purchasing habits despite broader macroeconomic headwinds.
| Payment Processor | Q1 EPS / Revenue Result | Network Volume Growth | Primary Growth Driver |
|---|---|---|---|
| Visa | Revenue up 15% | 11% (Cross-border) | International payments and digital adoption |
| Mastercard | Adjusted EPS of $4.76 | Double-digit expansion | Cross-border travel and retail spending |
| American Express | EPS of $4.28 | Overall expansion | Premium card member spending and services |
These processing volumes reassure investors that the domestic spending engine can support broader equity valuations. When consumer transactions hold steady alongside massive corporate infrastructure investments, the total market becomes significantly harder to derail through localised geopolitical shocks.
The dual pillars of corporate infrastructure spending and resilient consumer digital payments are effectively anchoring the broader market. These two forces provide structural support against the continuous drag of elevated energy costs and tight monetary policy. According to market analysts, futures markets are now projecting the next reduction in benchmark borrowing costs will not occur until late 2027, making this organic sector growth critical for portfolio stability.
According to external data, a specialised investment model tracking corporate earnings growth has advanced 26.1% since the year began. This performance validates the strategy of focusing on verifiable revenue streams rather than attempting to time macroeconomic pivots. Moving into the second quarter of 2026, financial analysts will closely monitor specific metrics to determine if this dual-pillar rally can persist through mid-year volatility.
Major financial institutions continue to update their recession probability estimates based on these variables, with some warning that current index levels may not fully reflect the underlying economic fragility.
Investors managing portfolios through the remainder of the year should prioritise three strategic indicators:
This article is for informational purposes only and should not be considered financial advice. Investors should conduct their own research and consult with financial professionals before making investment decisions. Past performance does not guarantee future results. Financial projections are subject to market conditions and various risk factors.
The stock market's resilience in April 2026 is primarily driven by unprecedented capital expenditures in artificial intelligence infrastructure and the robust performance of digital payment networks, countering geopolitical friction and persistent inflation.
Four major US hyperscalers have committed an aggregate of $650 billion towards artificial intelligence infrastructure in 2026, representing a 71.1% year-over-year increase in spending.
Leading digital payment networks like Visa, Mastercard, and American Express reported strong first-quarter results with increasing transaction volumes, including an 11% jump in Visa's cross-border volume, indicating consumers are maintaining spending despite inflation.
Investors should monitor corporate infrastructure guidance from major technology firms, track inflation data, especially crude oil prices filtering into core goods, and exercise caution with equities trading at very high forward earnings multiples.