The iShares Semiconductor ETF (SOXX) fell for an eighth straight session on Thursday, 16 October, and BTIG strategist Jonathan Krinsky now expects chip stocks to bounce. He also expects that bounce to be short-lived, with the sector likely to lose momentum and slide again before October ends.
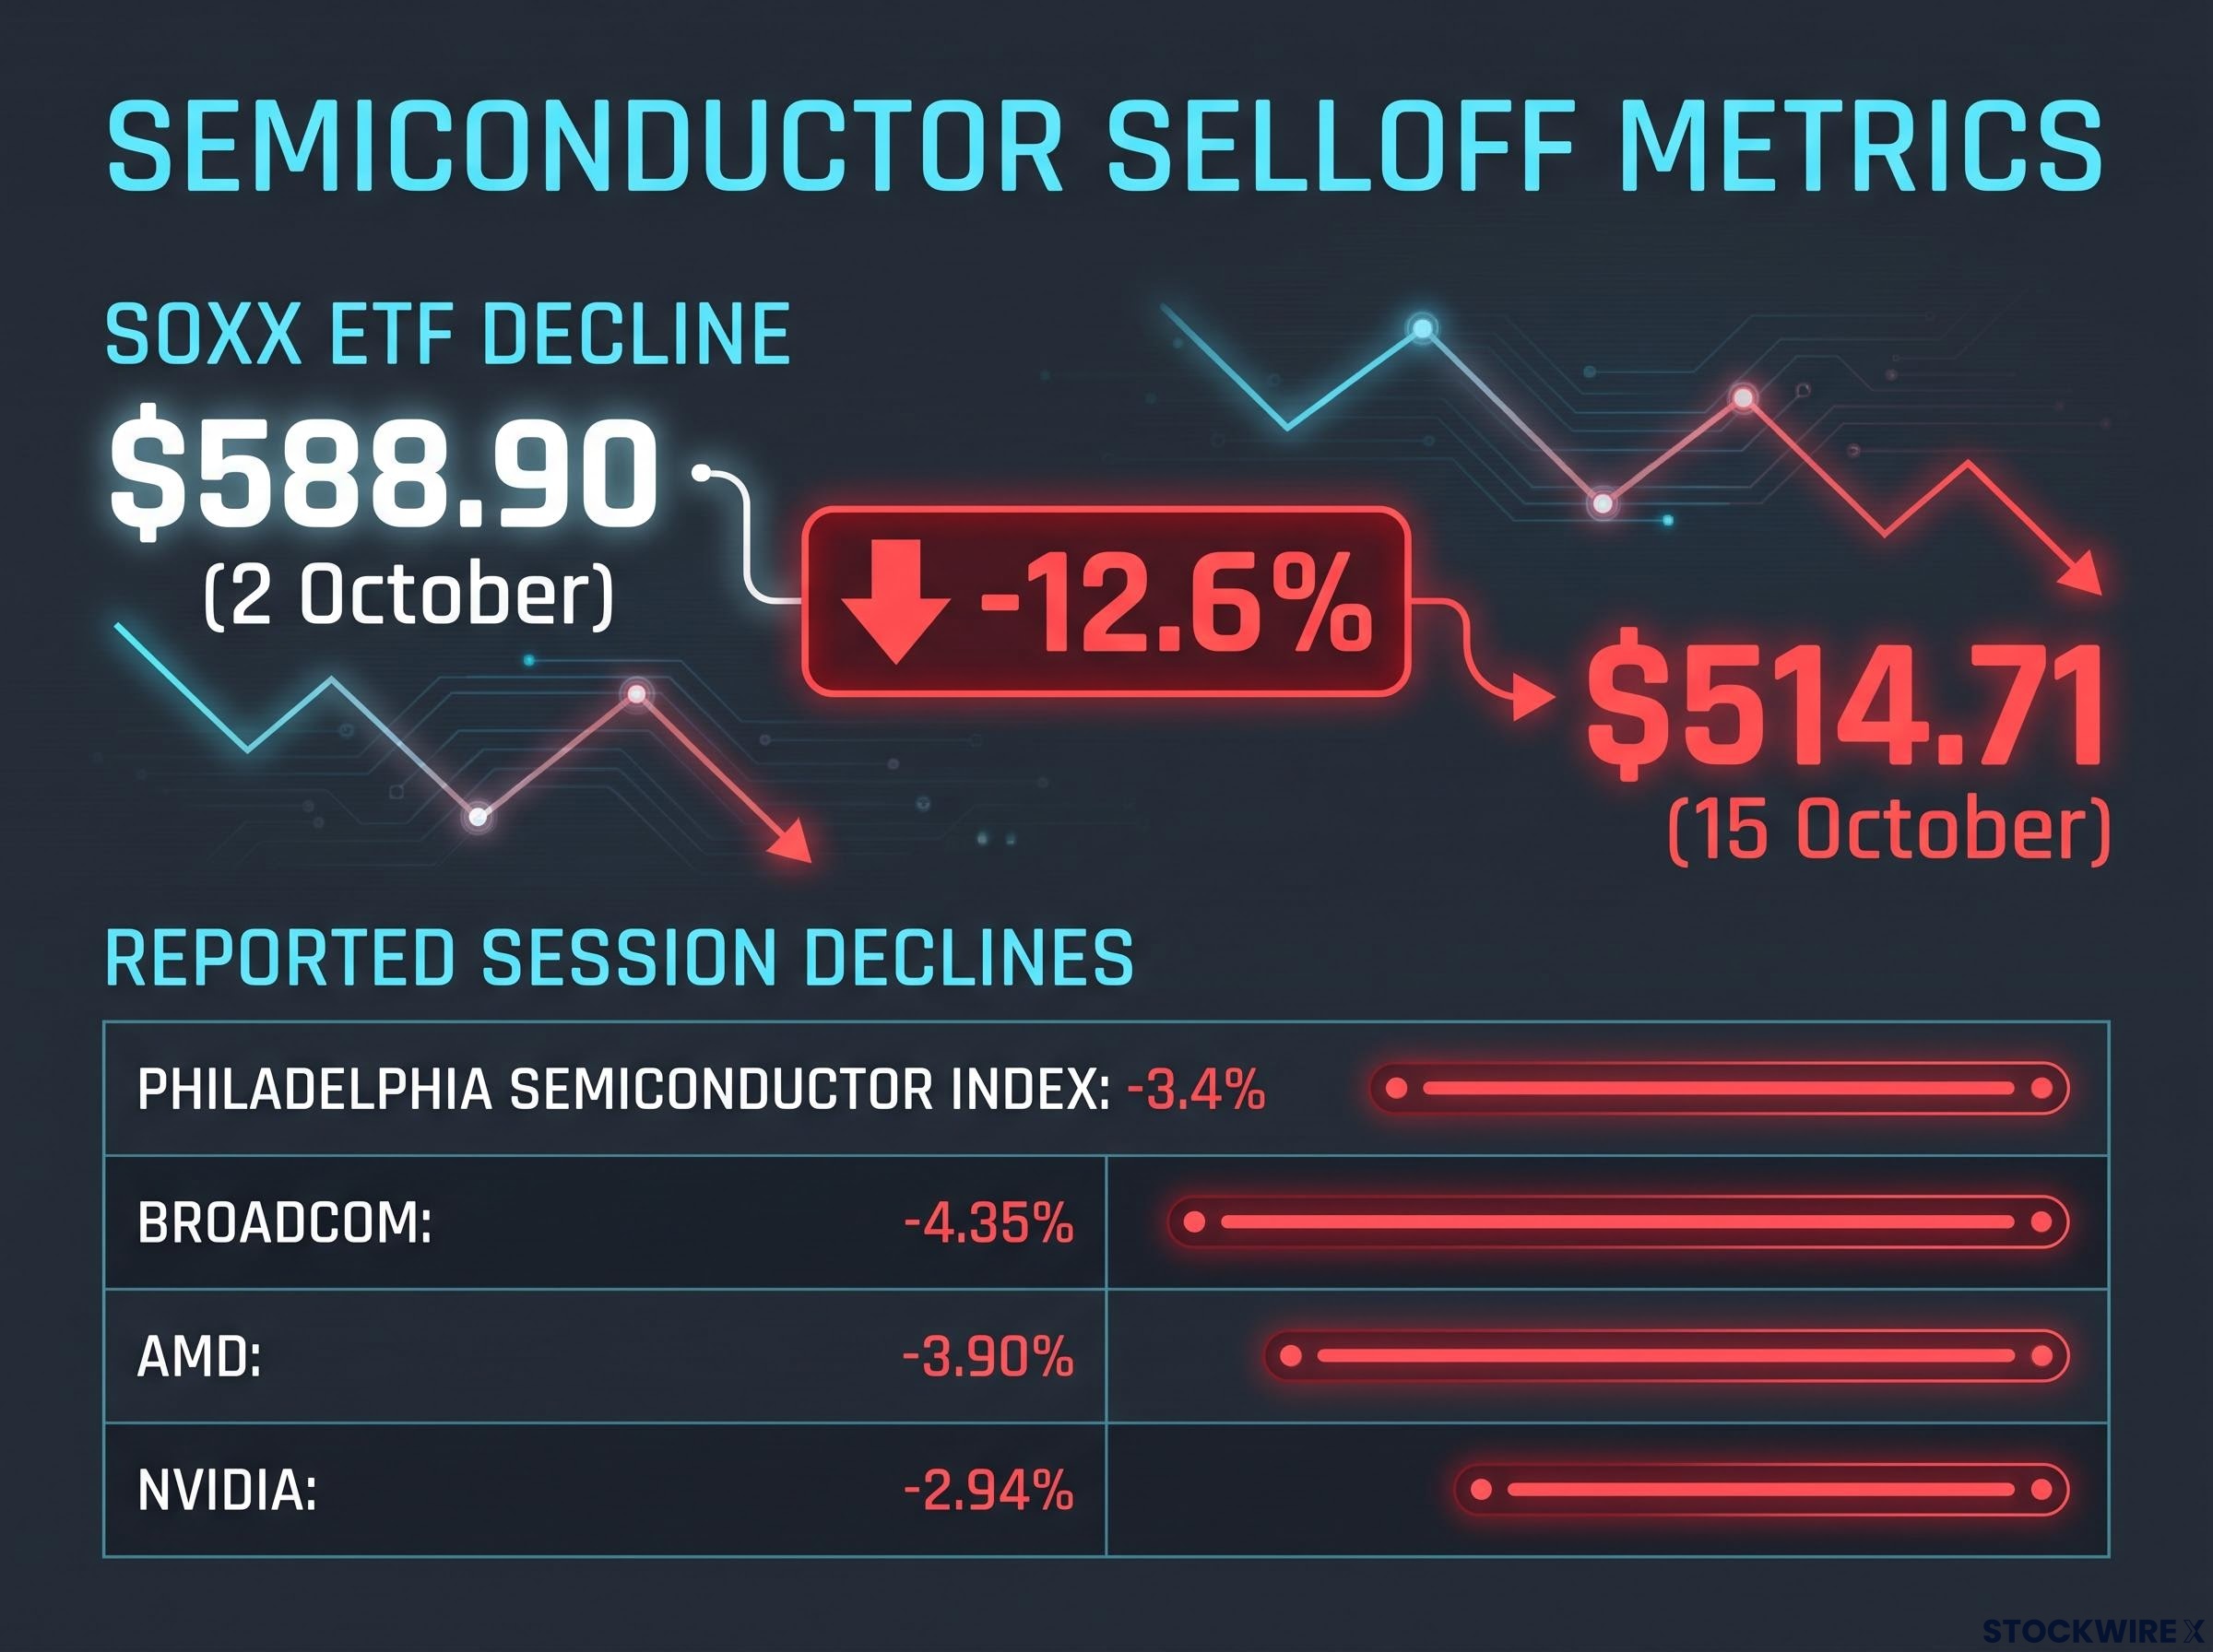
SOXX closed at $514.71 on 15 October, about 12.6% below its 2 October close of $588.90. The losing run is the fund’s longest since at least 2015.
BTIG’s client note is not public, so the figures here come from Investing.com reporter Sam Boughedda‘s coverage on 16 October 2026.
Here is how to separate a tactical bounce from a bear-market pattern, and why BTIG links its chip call to the 10-year Treasury yield.
Why BTIG expects a bounce, and why it does not expect it to last
The statistical case for a rebound is strong. SOXX opened more than 1% lower on Thursday, extending the streak, and the Philadelphia Semiconductor Index dropped 3.4% in the reported session. Broadcom fell 4.35%, AMD fell 3.90% and Nvidia fell 2.94%.
The pattern echoes July’s 6.3% sector rout, when synchronised losses across memory, equipment and logic names signalled a sector-wide reassessment of the AI earnings base, not a company-specific disappointment.
Krinsky searched for earlier cases where SOXX fell seven sessions in a row and then gapped down more than 1%. He found only two, and both came during deep bear markets. A bear market is a prolonged decline, usually defined as a fall of 20% or more from a recent high.
According to Investing.com, the BTIG call breaks down this way:
- A tactical bounce is likely after the streak and fits BTIG’s 2000 analog.
- The analog points to the sector stalling and turning lower later in October.
- BTIG does not yet want to bet against semis, because risk/reward is now more balanced.
- The call concerns timing and price pattern, not AI demand itself.
That last point matters more than the bounce.
The key clause Krinsky’s view, as reported, is that a short-term rebound would sit comfortably inside the 2000 pattern without changing his broader expectation of further losses.
For you, this means a rebound from here would be statistically normal. A green day or two is not, on its own, evidence that the selloff has ended.
What 2000, 2002 and 2008 show, and where the comparison breaks down
BTIG uses 2000 as its main reference point. The two episodes it quantified are more instructive, because they show how much damage followed the relief.
| Episode | Bounce | Subsequent decline | What marked it |
|---|---|---|---|
| September 2002 | SOXX up about 10% over three days | Down 33% over following weeks | That bear market’s semiconductor low |
| October 2008 | SOXX up about 20% over three days | Down 38% | That bear market’s semiconductor low |
In both cases the bounce was sharp and the fall that followed was far larger. Broader markets showed the same pattern. Jim Stack of InvesTech Research has pointed to the S&P 500’s 21.4% rally from September 2001 to January 2002, which came before the index lost about a third of its value.
Why the comparison has limits
The analogs come from very different eras. 2000 was an internet-bubble collapse, 2002 was the aftermath of that bust, and 2008 was a banking and housing crisis. Today’s pressure centres on AI capital spending and how that spending is financed with debt.
The method has its own weaknesses:
- The sample is tiny, with just two matching cases.
- Episodes can be chosen after the fact because the charts look similar.
- Index membership has changed, so moves are not strictly comparable.
- The same chart shape can come from entirely different economic causes.
Not everyone reads the selloff as a bear market. UBS CIO Ulrike Hoffmann-Burchardi calls it a recalibration of expectations rather than a break in the AI investment story. Velan, quoted in the Straits Times, describes a new phase focused on monetisation and return on invested capital. CNBC reported that analysts see higher yields as a headwind for valuations, but not necessarily enough to end the bull market.
The analogs show how bounces can behave inside weak markets. They justify caution, not a forecast of a 30%-plus fall.
Readers interested in testing BTIG’s 2000 analog can read our full explainer on the Nasdaq 1997-2000 parallel, which compares forward P/E of 25x today against 58x at the dot-com peak.
Why the 10-year yield and the Nasdaq 100 are now moving together
Krinsky’s second observation is the more unusual one. Bonds are now trading in step with the Nasdaq 100, not with crude oil.
BTIG considers its short-term bond-rally trade largely complete, as the 10-year yield has already eased from 5.36% to 5.04%. It expects the yield to hold a 4.90%-5.20% range for some time. That is a 30 basis point band (one basis point equals 0.01%) at levels many investors have not seen before.
Goldman Sachs has flagged a 50 basis point monthly move in the 10-year as a threshold for forced institutional selling, and real Treasury yields near multi-year highs add mechanical pressure on long-duration growth stocks.
The yield has been volatile. After the hotter-than-expected September CPI report, it swung from roughly 5.33% to roughly 5.05% within about 24 hours, and Charles Schwab put it near 5.10% on 16 October. Capital Economics‘ James Reilly said higher core inflation could bring an October Fed hike back into consideration.
Here is how the link works:
- Hot inflation data lifts expected policy rates, which pushes the 10-year yield higher.
- A higher yield reduces the present value of tech earnings expected years from now, so chip valuations shrink.
- Growth or AI-credit worries reverse the flow, sending money out of equities and into Treasuries.
- In that case, yields and chip stocks fall together.
Other forces fed the selloff. Nomura economist Takahide Kiuchi said the top five hyperscalers’ 2026 capital spending was expected to exceed their operating cash flow. Progress at Chinese memory maker CXMT raised competitive concerns, and Broadcom CEO Hock Tan warned that funding constraints could become a problem.
| Scenario | Effect on 10-year yield | Effect on chip stocks |
|---|---|---|
| Hot inflation data | Rises | Valuations pressured |
| AI-credit or growth scare | Falls as money moves to Treasuries | Fall with the Nasdaq 100 |
| Yield holds within 4.90%-5.20% | Stable | Less rate pressure on multiples |
On 16 October, the Nasdaq Composite closed at 26,713.03, up 0.08%, after the Nasdaq 100 recovered from an intraday low near 29,408. A chip-stock bounce is now partly a rates trade. If a rebound arrives alongside falling yields, it is more credible than one that has to fight a rising 10-year.
What the bounce does and does not settle, and what to watch next
A relief rally is statistically likely. BTIG’s analog points to renewed weakness later in October, but neither outcome is certain. Three markers will help you judge which one is unfolding:
- Whether the 10-year yield stays inside the 4.90%-5.20% band
- The next inflation readings and Fed signals
- Any shift in how AI capex and monetisation are being priced
UBS and Velan see a reset in expectations rather than an ending, and that view deserves equal weight alongside Krinsky’s caution. This is market analysis, not personalised advice.
The shift in how AI capex and monetisation are priced is already visible in the data: data-center capex growth is decelerating, and hyperscaler spending is projected to consume 90-100% of operating cash flow in 2026.
This article is for informational purposes only and should not be considered financial advice. Investors should conduct their own research and consult with financial professionals before making investment decisions. Past performance does not guarantee future results.
—