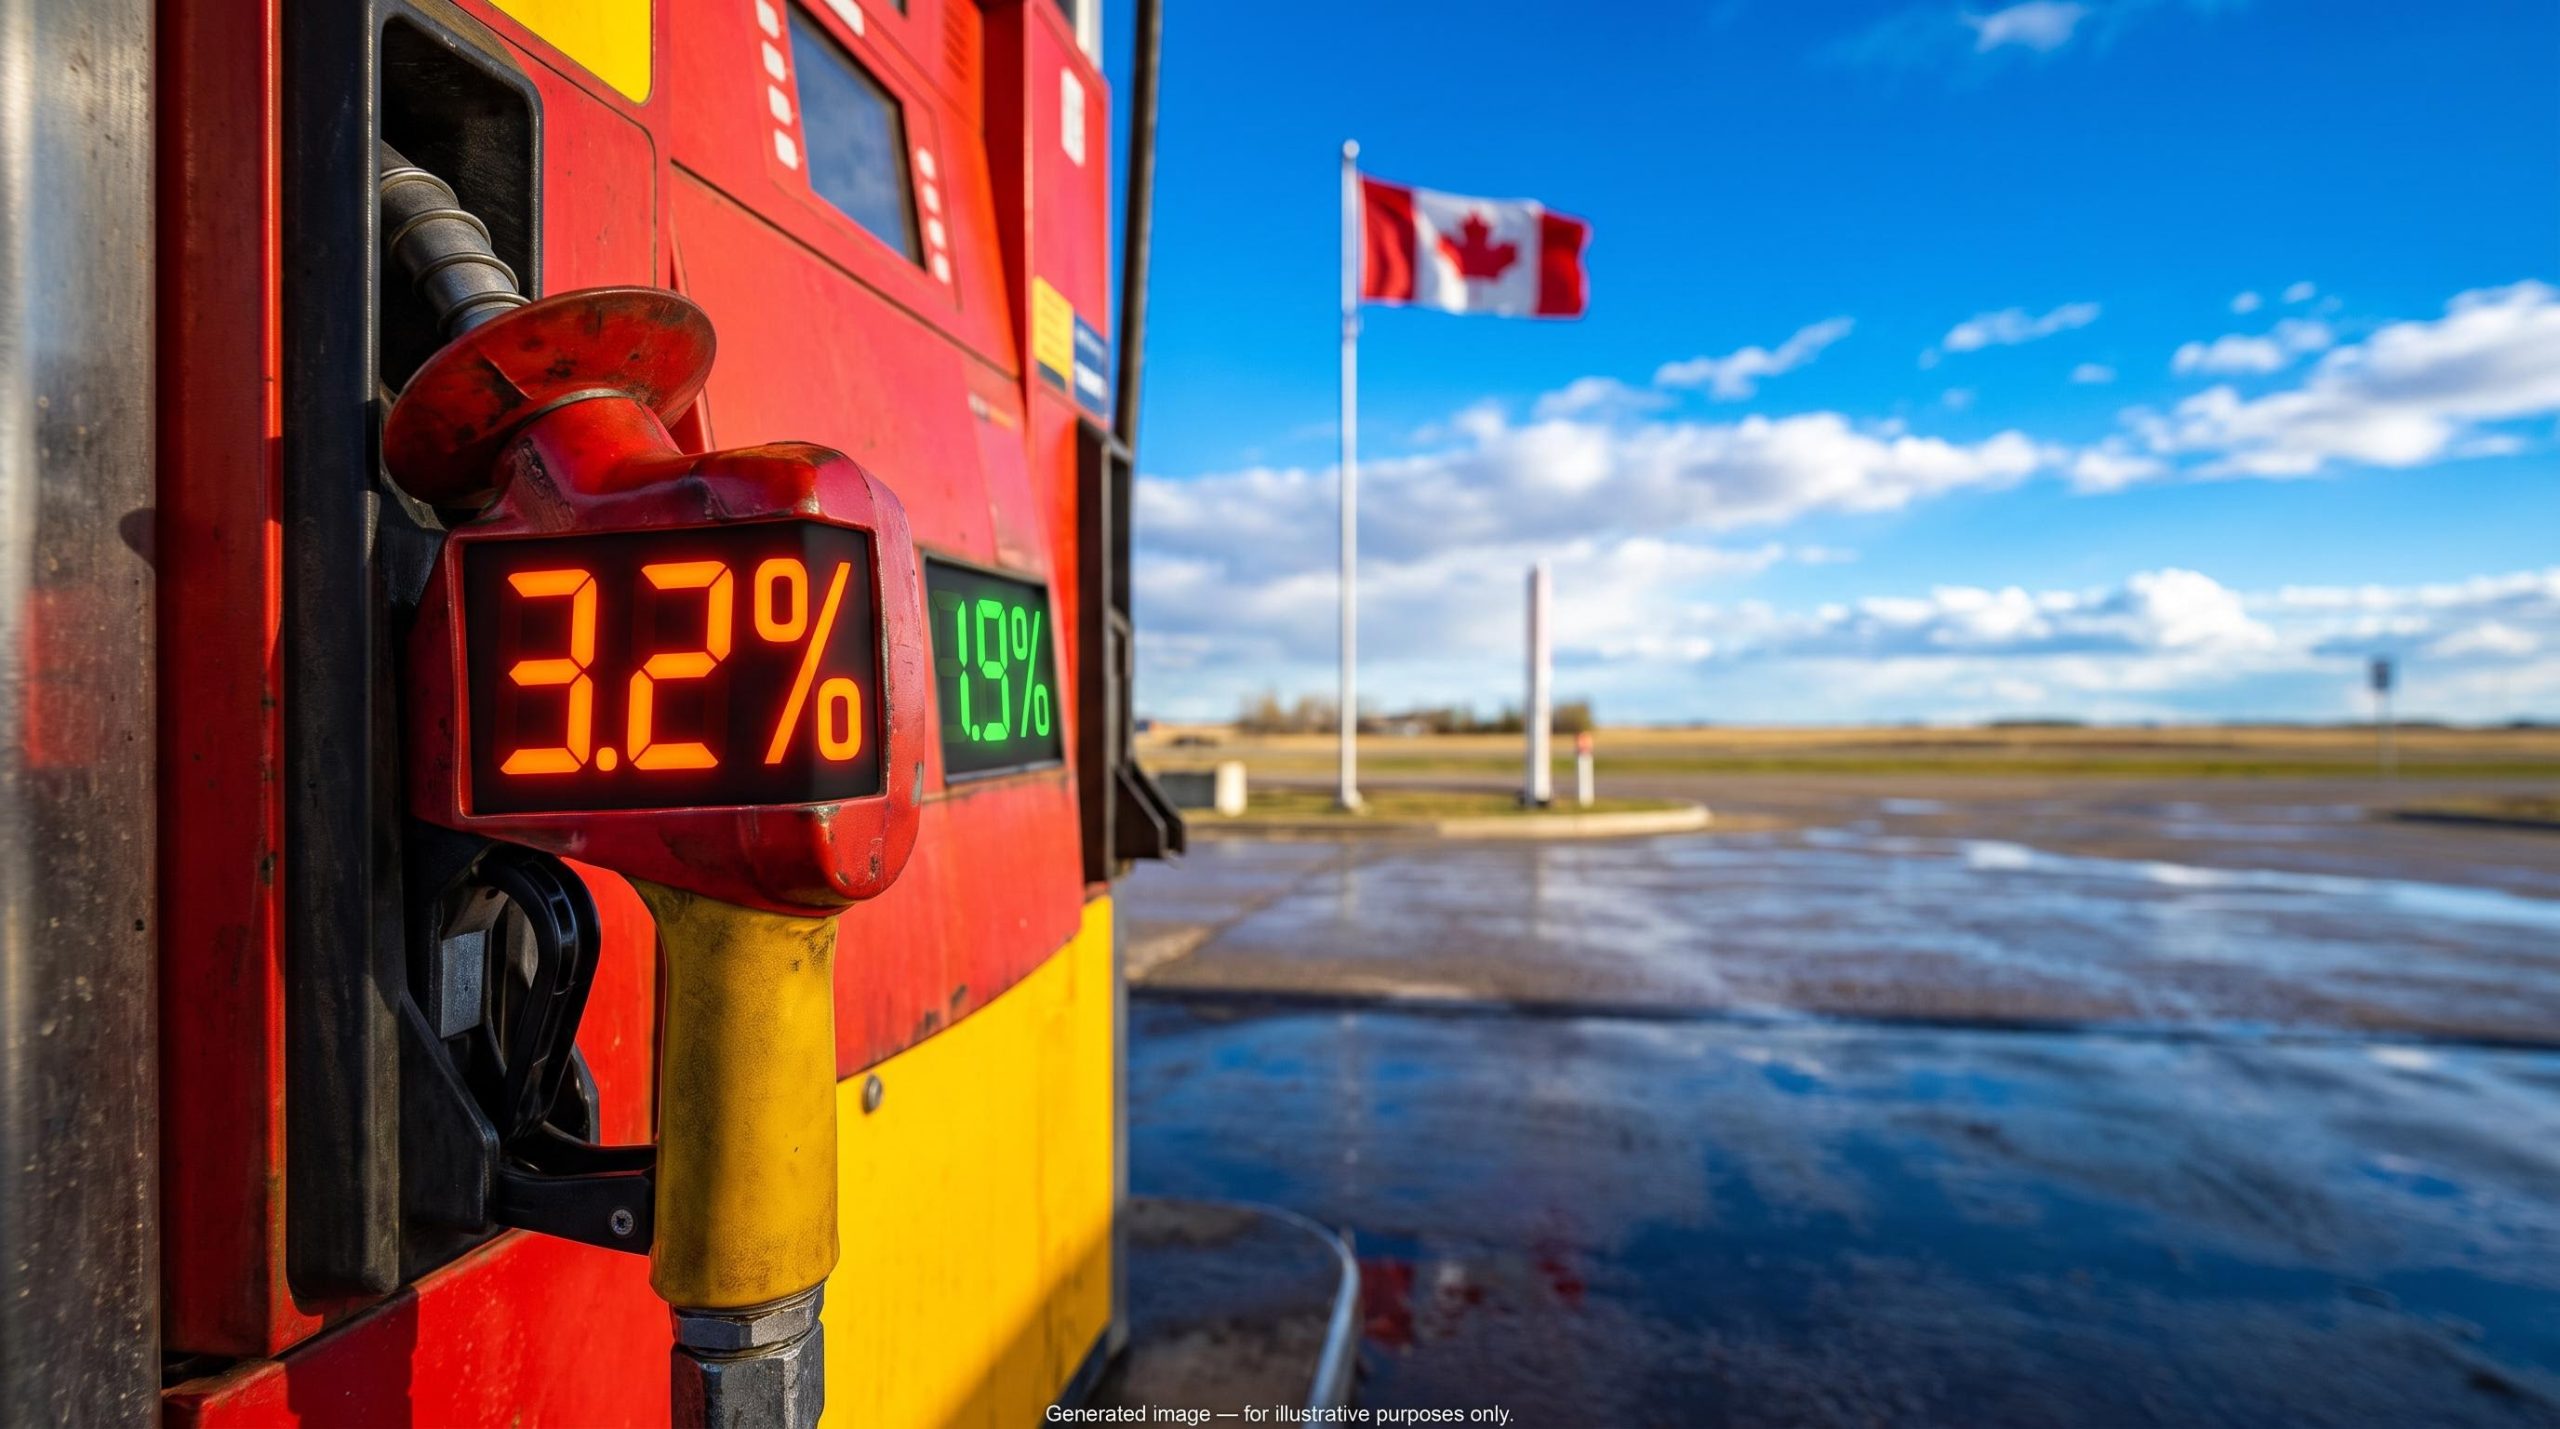
A headline inflation rate above 3% sounds like a case for higher interest rates. Canada’s September CPI release could test that assumption: TD Securities expects headline inflation of 3.2%, while the two measures the Bank of Canada watches most closely, CPI-trim and CPI-median, sit at just 1.9%.
That 1.3 percentage point gap explains why a rising headline might change very little about the next rate decision.
Statistics Canada publishes September CPI on Monday, 19 October 2026, nine days before the Bank’s 28 October decision and Monetary Policy Report (MPR). No September figures exist yet. Every number below is a forecast, mainly from TD’s Robert Both, with RBC‘s view of a headline closer to 3.0% as a counterpoint.
This gives you a practical way to read any Canadian inflation print and judge whether it is likely to move rates, the Canadian dollar or your equity holdings.
What does TD Securities expect from Canada’s September CPI?
Two lines on the same chart are heading in opposite directions. TD’s Robert Both expects headline CPI to rise 0.1 percentage points to 3.2% year on year, with prices up 0.2% for the month. Over the same period, he expects CPI-median to slip 0.1 points to 1.9% and CPI-trim to hold at 1.9%.
The split has one cause. Energy, led by gasoline, is doing almost all of the lifting, and TD does not expect price pressure to broaden across the rest of the basket.
TD’s core framing Headline inflation edges higher on energy costs, while underlying measures stay subdued.
TD also forecasts a three-month annualised core rate of 2.7%, a momentum gauge explained in the next section. If the forecast proves accurate, trim and median would fall back to their lowest readings of 2026.
| Measure | August actual | TD September forecast | RBC September expectation |
|---|---|---|---|
| Headline CPI (y/y) | 3.0% | 3.2% | Around 3.0% |
| Headline CPI (m/m) | -0.1% | +0.2% | Not specified |
| CPI-trim | 1.9% | 1.9% | Not specified |
| CPI-median | 2.0% | 1.9% | Not specified |
| Core ex food and energy | 2.1% (per RBC) | Not specified | About 1.8% |
One detail does not line up. TD’s “up 0.1 points” framing implies August headline inflation of 3.1%, but Statistics Canada reported 3.0% on 14 September, and that is the official figure. August gasoline inflation ran at 22.8% year on year, down from 25.7% in July.
The Statistics Canada August CPI release confirms the official baseline you should measure September against: headline inflation of 3.0% year on year, with gasoline prices up 22.8% over the same period, which is why energy dominates the headline story.
These numbers set your baseline. A headline anywhere between 3.0% and 3.2% is within expectations. A surprise would be trim or median rising above 2%. A 3.2% headline sitting on sub-2% core tells you the pressure is concentrated in one volatile category rather than spreading through the economy.
When big ASX news breaks, our subscribers know first
Why headline and core inflation tell different stories
On release day, you will probably see a 3%-plus headline on your screen next to core readings below 2%. Both numbers can be correct at once, because each one measures something different.
Headline CPI tracks the average price change across the full consumer basket, gasoline and groceries included. It shows what households are paying today. It does not tell you whether those pressures will last.
The Bank’s preferred core measures filter out the noise:
- CPI-trim: removes the components with the most extreme price changes in a given month, at both ends. It shows inflation once one-off spikes are taken out.
- CPI-median: takes the price change at the 50th percentile of the weighted CPI basket, the middle point where half of prices rose faster and half rose slower. It shows what a typical item is doing.
- Core ex food and energy: drops food and energy entirely. It is the measure RBC cites, and it shows the trend without the two most volatile categories.
Each of these reduces the influence of gasoline and food. That matters to the Bank because persistent inflation is linked to the balance between demand and supply in the economy. A gasoline spike caused by refinery damage overseas is a different problem from Canadians bidding up the price of everything.
Before you draw any conclusion about rates from a headline print, check trim, median and the three-month rate. Those are the numbers the Bank itself relies on.
When you track CPI-trim and CPI-median alongside the three-month annualised rate, you see how the Bank’s preferred gauges can sit below the 2% target even while the headline runs well above it.
How to read a three-month annualised rate
Year-on-year figures compare today’s prices with prices twelve months ago, so last year’s swings distort them. Economists call this a base effect. A three-month annualised rate takes the price change over the latest three months and scales it to a yearly pace, which shows you momentum earlier.
The Bank has used this gauge before, including in its 2022 review, when falling three-month rates pointed to further moderation. TD’s 2.7% sits above the year-on-year core readings, but TD judges it too low to prompt a policy response.
The weakness is noise. When gasoline moves sharply, three-month rates can swing a long way, so read them alongside year-on-year core and breadth (how many categories are rising quickly) before treating them as a trend.
How far can an energy shock travel through the economy?
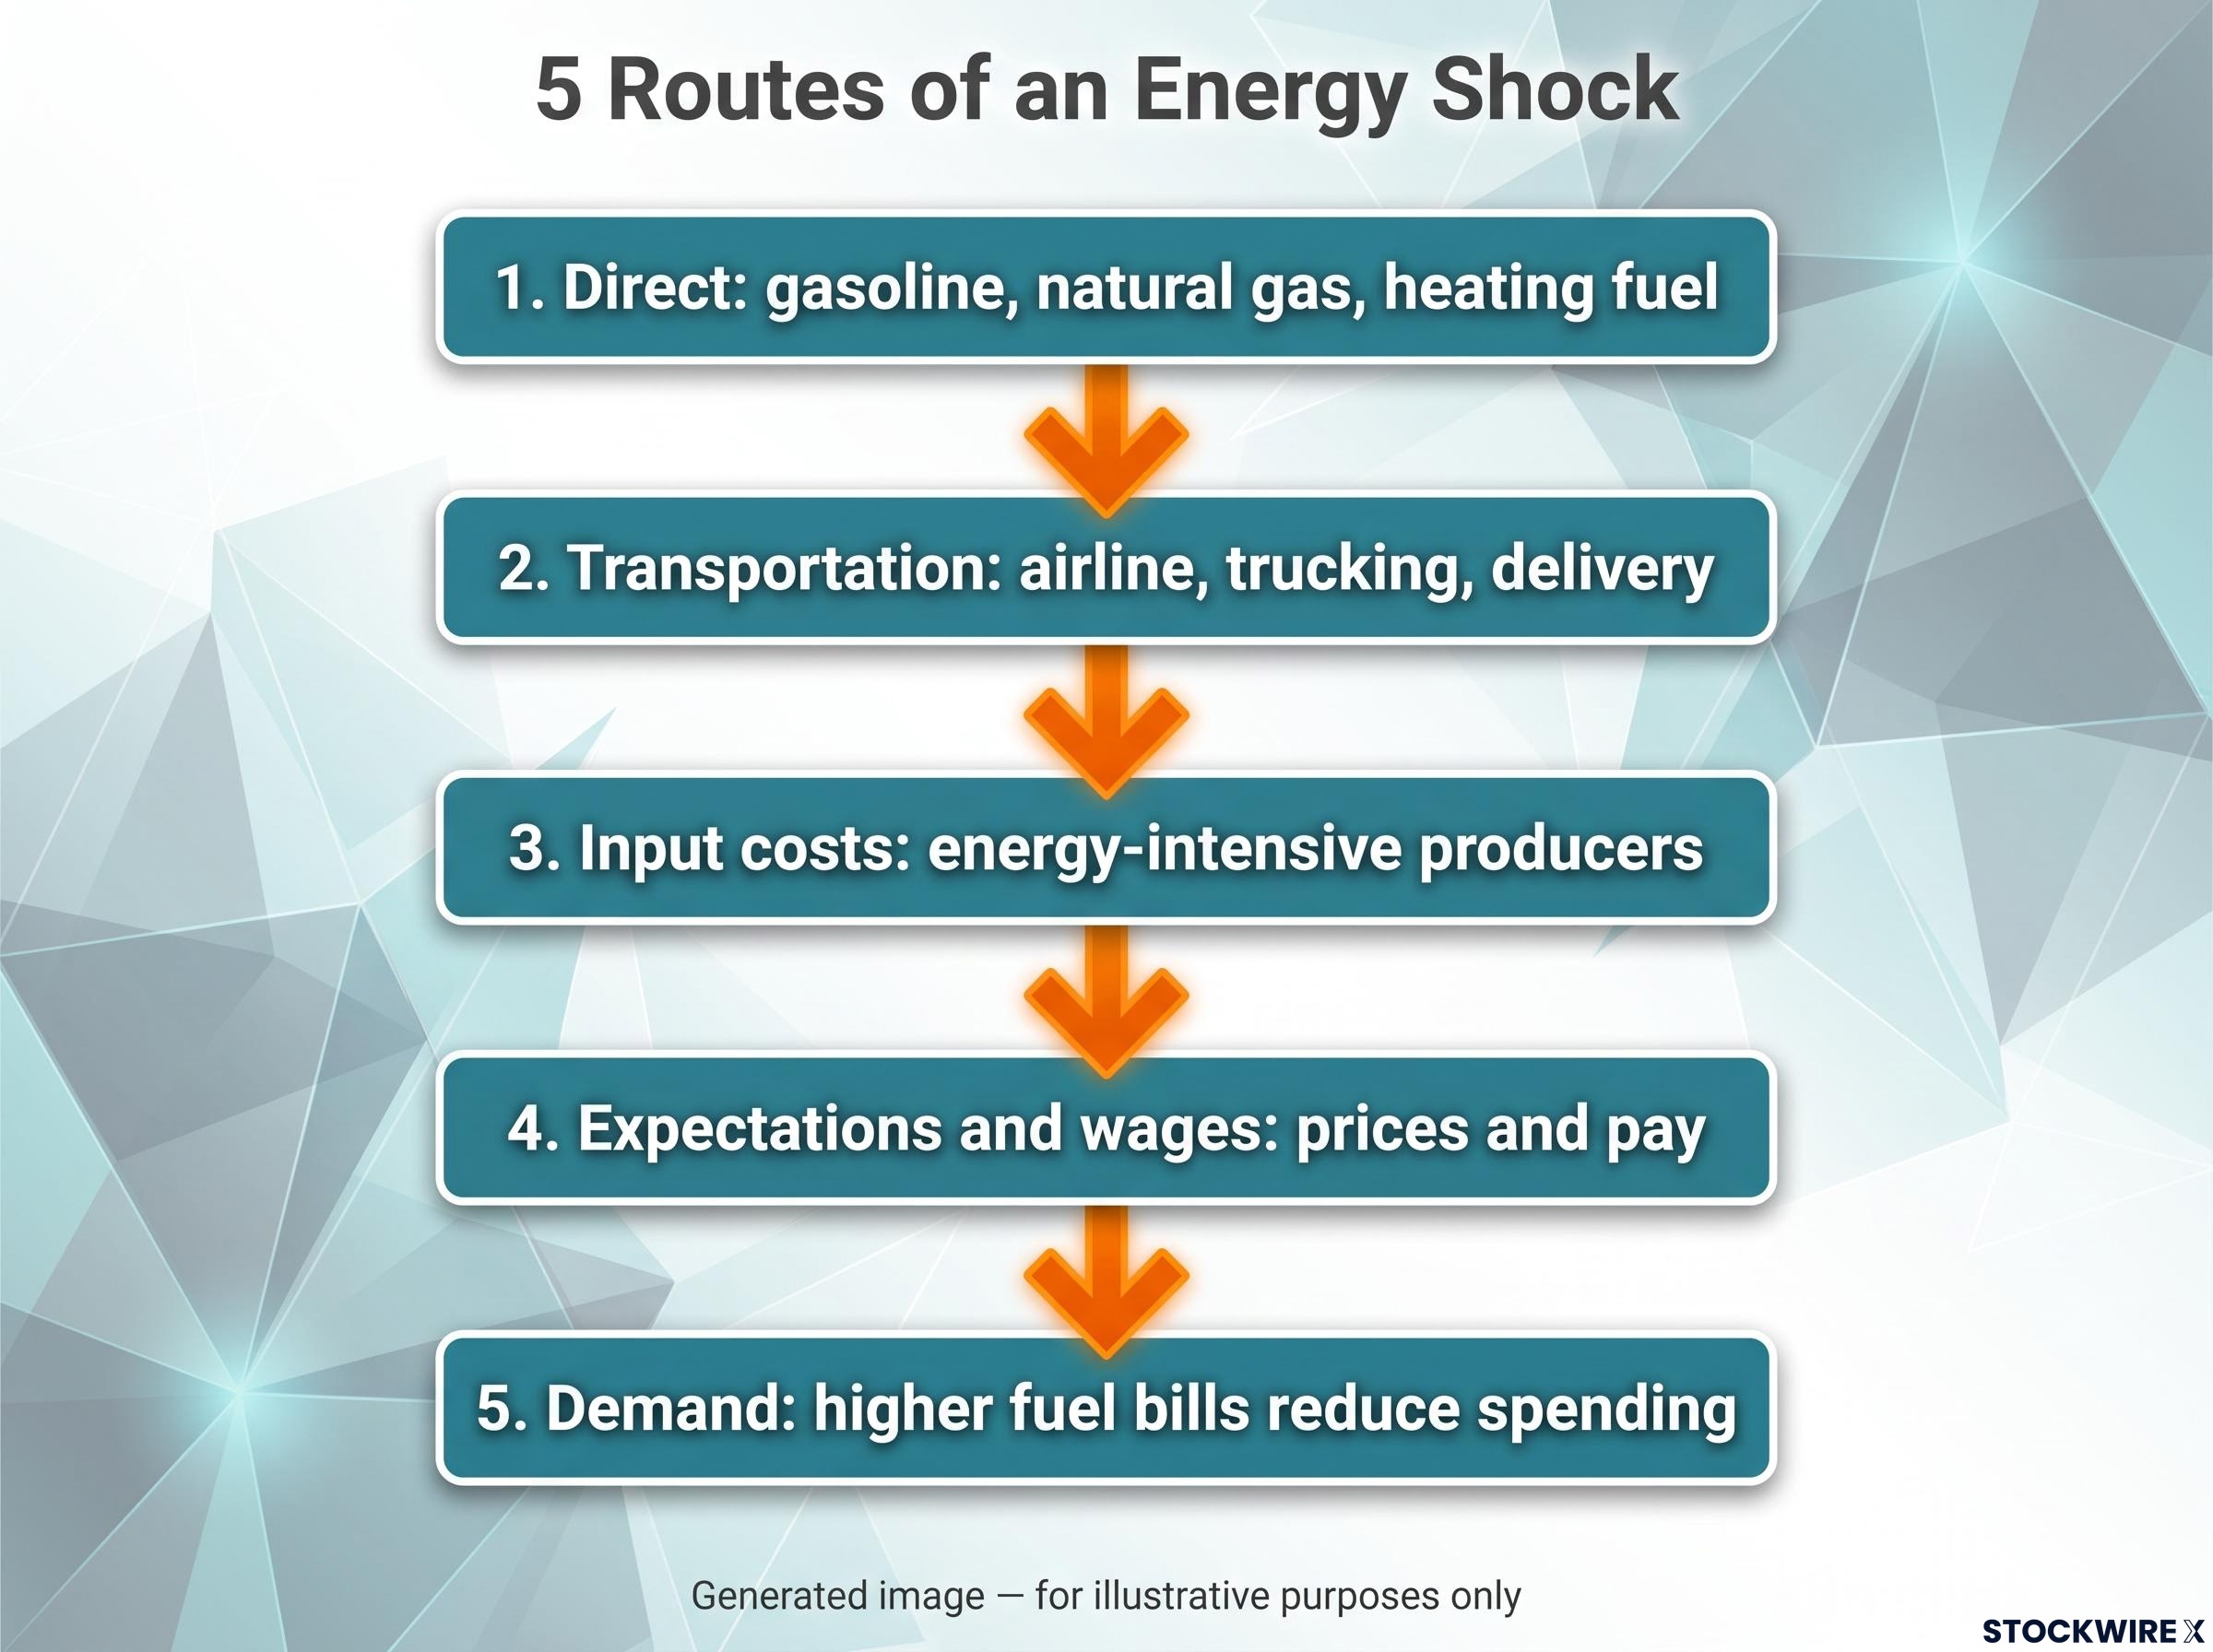
Knowing that core inflation is low today raises a further question: can a gasoline shock spread into everything else? It has five possible routes, and each one carries the shock a step further from the pump:
- Direct: gasoline, natural gas and heating fuel lift CPI immediately. This is happening now and accounts for most of the headline move.
- Transportation: airline, trucking and delivery costs rise. RBC flags transportation and airfares as the main exposure outside fuel.
- Input costs: energy-intensive producers raise their prices. So far, the evidence of this is limited.
- Expectations and wages: households and businesses start to expect higher inflation and build it into prices and pay. RBC warns that prolonged high oil prices could affect these expectations.
- Demand: higher fuel bills reduce spending power, which weakens demand and offsets some of the pressure. This channel is active.
The Bank’s own reading places the shock at the first link. Policymakers attributed headline inflation near 3% mainly to “persistently higher gasoline prices”, with core close to 2%.
Bank of Canada deliberations Policymakers saw little evidence of broad gasoline pass-through, though they judged that gasoline and diesel could stay elevated because of Middle East tensions and damage to refining capacity.
BMO’s Benjamin Reitzes has reportedly estimated that gasoline was on pace to rise at least 5% in September, though that figure has not been independently confirmed.
The fifth channel is where the labour market comes in. The 9 October Labour Force Survey showed employment down 68,000 in September after a 42,000 drop in August. Unemployment rose to 6.5% from 6.4%, and the employment rate fell 0.2 points to 60.6%.
Canadian job losses of this scale also moved currency markets, with USD/CAD rallying about 80 pips on a single day when weak Canadian hiring met a strong US report.
Weaker hiring leaves households with less capacity to absorb higher costs and leaves businesses with less room to pass them on. That is why the same energy shock worries the Bank less than it would in a tight labour market. To tell whether the shock is staying contained, watch transport prices, wage growth and inflation expectations surveys.
What does it mean for the Bank of Canada, the loonie and markets?
TD’s central case is that the Bank looks through the headline on 28 October. The Bank held its overnight target at 2.25% on 2 September, with the Bank Rate at 2.50% and the deposit rate at 2.20%. TD expects the October MPR to raise the Bank’s headline CPI forecasts without that leading to a hike.
The broader Bank of Canada rate outlook matters here because TD projects an extended hold at 2.25%, which frames why a single energy-driven headline is unlikely to change the Bank’s stance.
RBC calls the meeting live, meaning a move is possible, but does not expect a hike because weaker activity offsets higher energy prices. According to Reuters market reporting, money markets were not pricing an October hike, though some risk of a 25 basis point increase was priced for the final meeting of 2026. That reading has not been independently verified. A basis point is one hundredth of a percentage point.
Lessons from 2008 and 2022
In 2008, crude oil pushed CPI from 2.2% in May to 3.5% in August. The Bank projected core inflation below 2% and expected the headline to fade as the shock passed, and it did.
In 2022, energy and food inflation spread into core. Inflation peaked at 8.1%, and the Bank raised rates seven times for 400 basis points of tightening. The 1970s carry a starker warning: accommodating oil shocks while expectations slipped contributed to years of high inflation and unemployment.
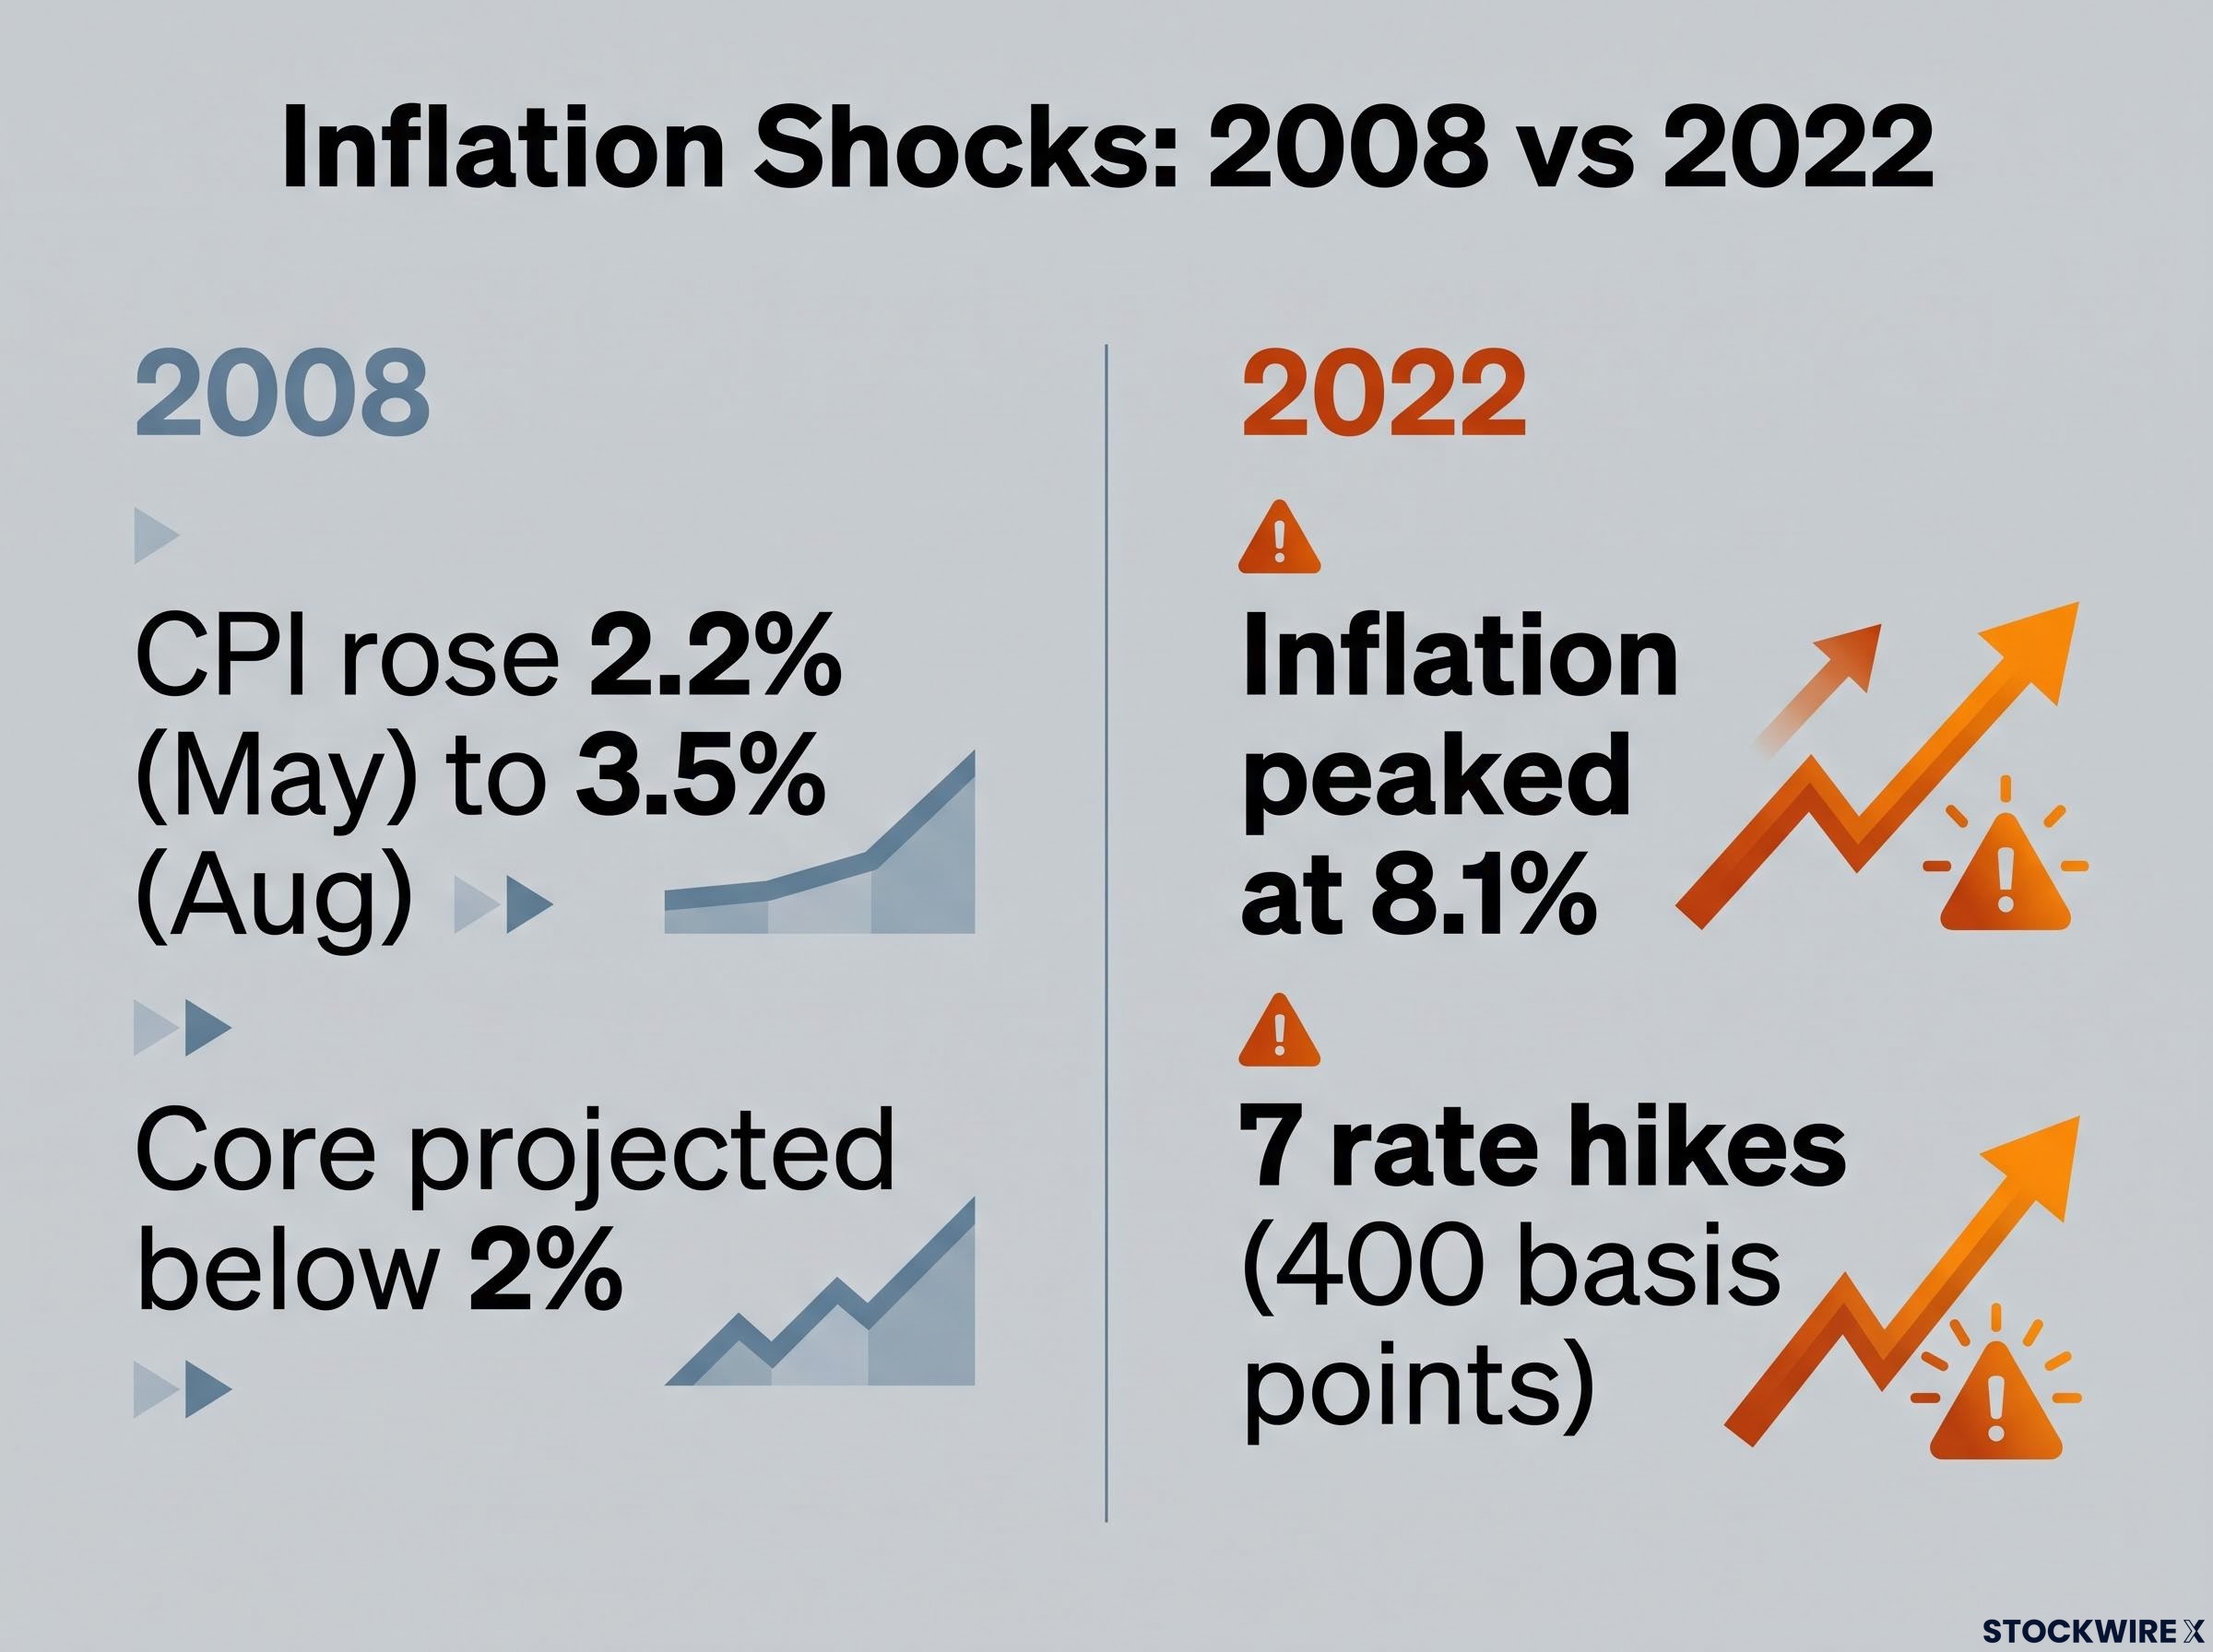
For now, 2026 looks more like 2008. That comparison holds only while gasoline stays out of transport, wages, services and expectations. If the shock persists and spreads, the Bank’s stance shifts from looking through it to responding.
| Scenario | Bank response | Likely market reaction |
|---|---|---|
| Core contained, energy-only headline | Looks through, holds | Lower front-end yields, modestly weaker CAD, support for rate-sensitive TSX sectors |
| Core broadens (second-round effects) | Less willing to dismiss the headline | Higher short-term yields, stronger CAD, pressure on real estate, utilities and high-dividend stocks |
| Expectations rise materially above 2% | Could tighten despite weak growth | Larger yield and CAD moves |
| Oil prices reverse | Hold becomes easier to justify | Headline falls quickly, with year-on-year effects possibly delayed |
The reaction is asymmetric. A benign core print would confirm the hold, but a firm core reading would move yields and the loonie far more than the headline could. On 19 October, check these three signals first:
- Trim and median: do they stay at or below 2%?
- Breadth: are price increases spreading beyond energy and transport?
- Expectations: are business or consumer surveys moving higher?
If you hold a mortgage or bonds, or own rate-sensitive Canadian stocks, these signals matter more to your position than the headline does.
Reading the release on October 19 without overreacting to the headline
Read the release in this order. Check trim and median first. Then look at breadth and the three-month rate, then expectations and labour data, and only then the headline. If core holds near 1.9% and jobs stay weak, the energy shock looks contained, much like 2008.
All of these figures remain forecasts until Statistics Canada publishes on Monday. The next checkpoint is 28 October, when the Bank’s decision and its revised MPR show whether policymakers still see gasoline as a temporary shock or are starting to treat it as a lasting one.
This article is for informational purposes only and should not be considered financial advice. Investors should conduct their own research and consult with financial professionals before making investment decisions. Past performance does not guarantee future results. Financial projections are subject to market conditions and various risk factors, and forward-looking statements are speculative and subject to change.