The People’s Bank of China (PBOC) set Thursday’s yuan midpoint at 6.7367 per US dollar. That was about 113 pips weaker for the yuan than the Reuters estimate of 6.7254, even though spot was trading near 6.705, stronger than the fix. If you assumed the PBOC yuan fix simply records where the market already sits, this gap shows otherwise.
A pip is the smallest standard price step in a currency quote. For USD/CNY, one pip is 0.0001, so 113 pips is a deliberate gap, not a rounding error.
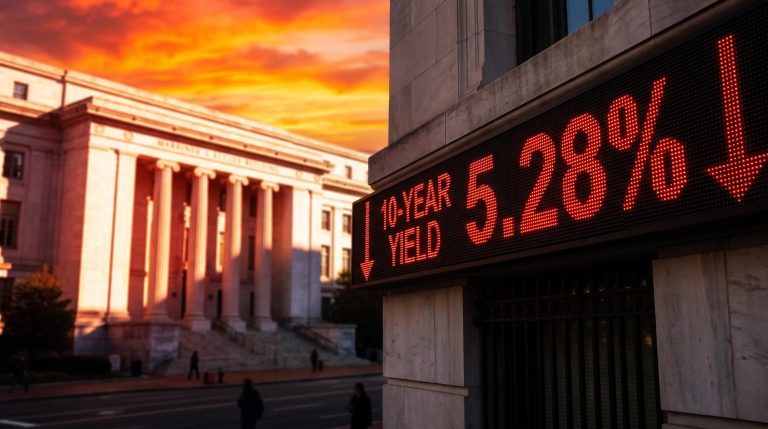
The timing matters. US 10-year yields are near their highest since 2002, and the US Dollar Index sits near an 18-month high. Each morning, Beijing sends a message about how much of that dollar strength it will let reach the yuan. If you treat the fix as a technical footnote, you miss a signal about Chinese policy, export competitiveness and capital flows.
Here is how to read the fix, who stands behind it, and what Thursday’s number signals for your exposure right now.
What the daily fix is and how the midpoint gets set
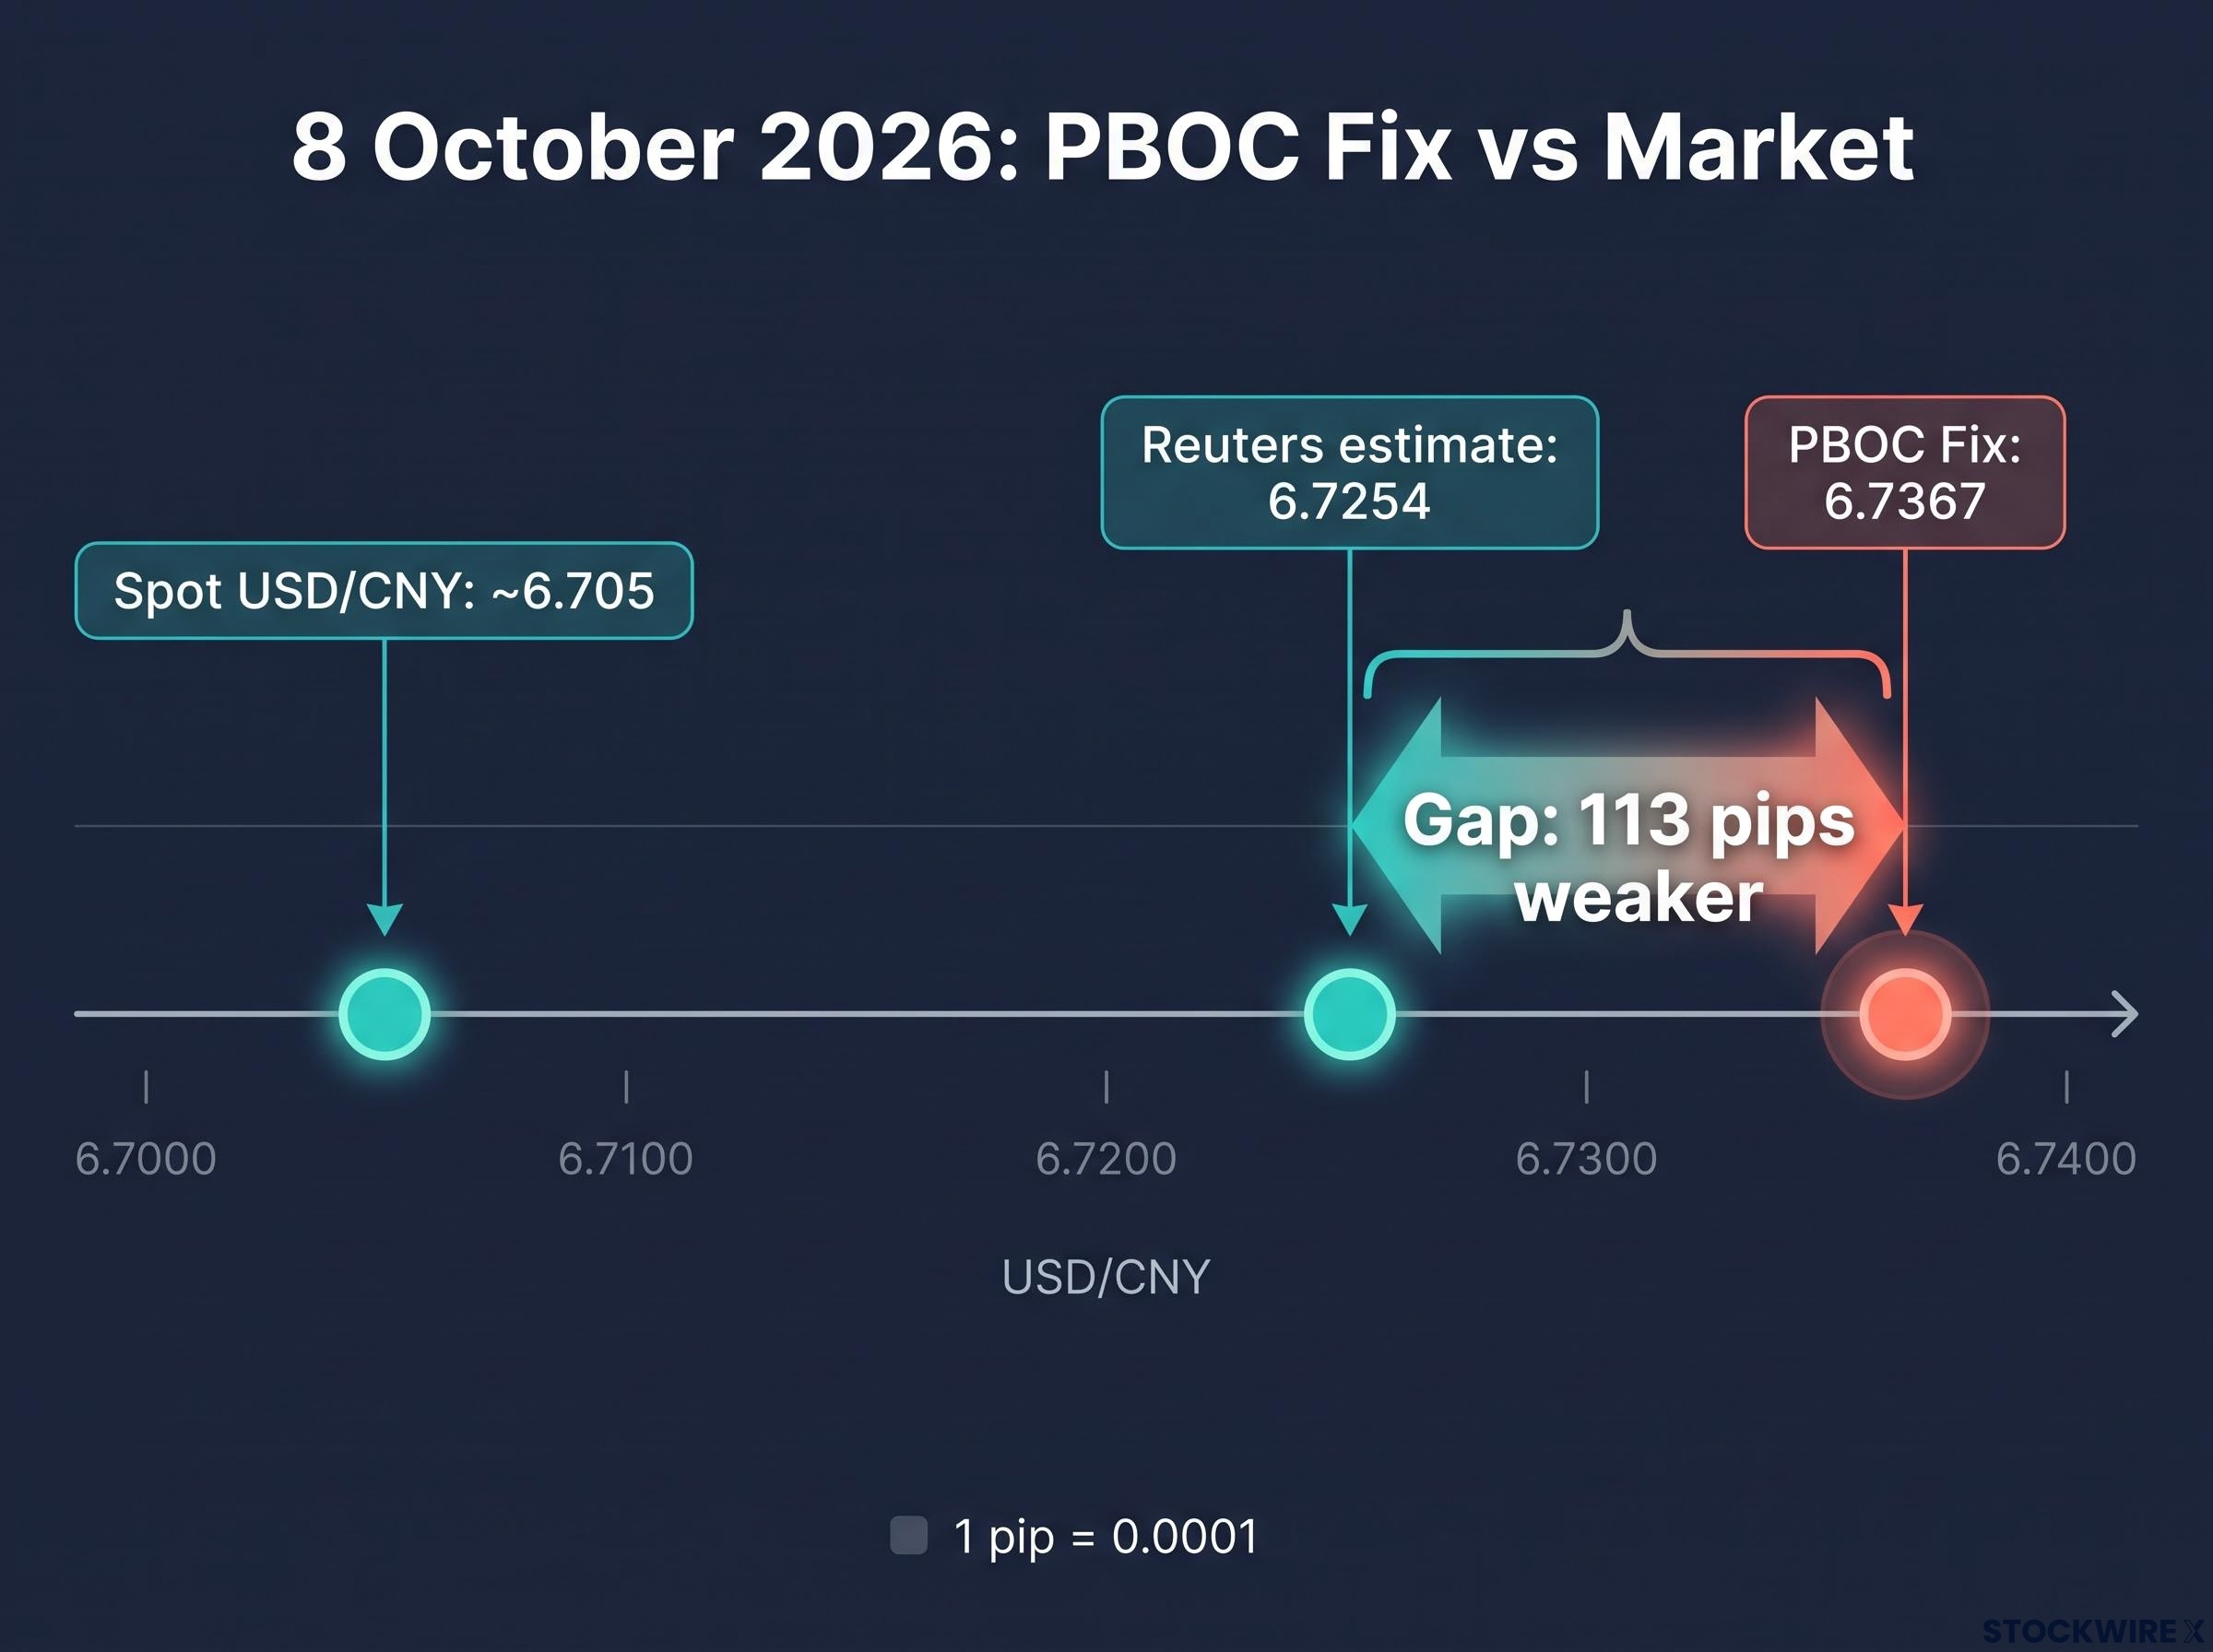
Start with the number on your screen: 6.7367. Every trading morning the PBOC publishes a USD/CNY midpoint, also called the central parity rate, and that figure guides the session ahead. It looks like a market price. It is actually built from three inputs:
- The previous onshore close. This is where the yuan finished trading in mainland China the day before.
- Overnight moves in the CFETS basket. The China Foreign Exchange Trade System (CFETS) basket is a weighted group of currencies the yuan is measured against. If those currencies move overnight, the fix adjusts.
- The counter-cyclical factor. This is a discretionary adjustment the PBOC can apply to lean against market momentum.
The first two inputs are formula. The third is judgement, and that is where policy intent enters. The stated aims, according to the PBOC and the International Monetary Fund (IMF), are to reflect supply and demand, keep markets orderly, avoid one-way speculative bets and support financial stability.
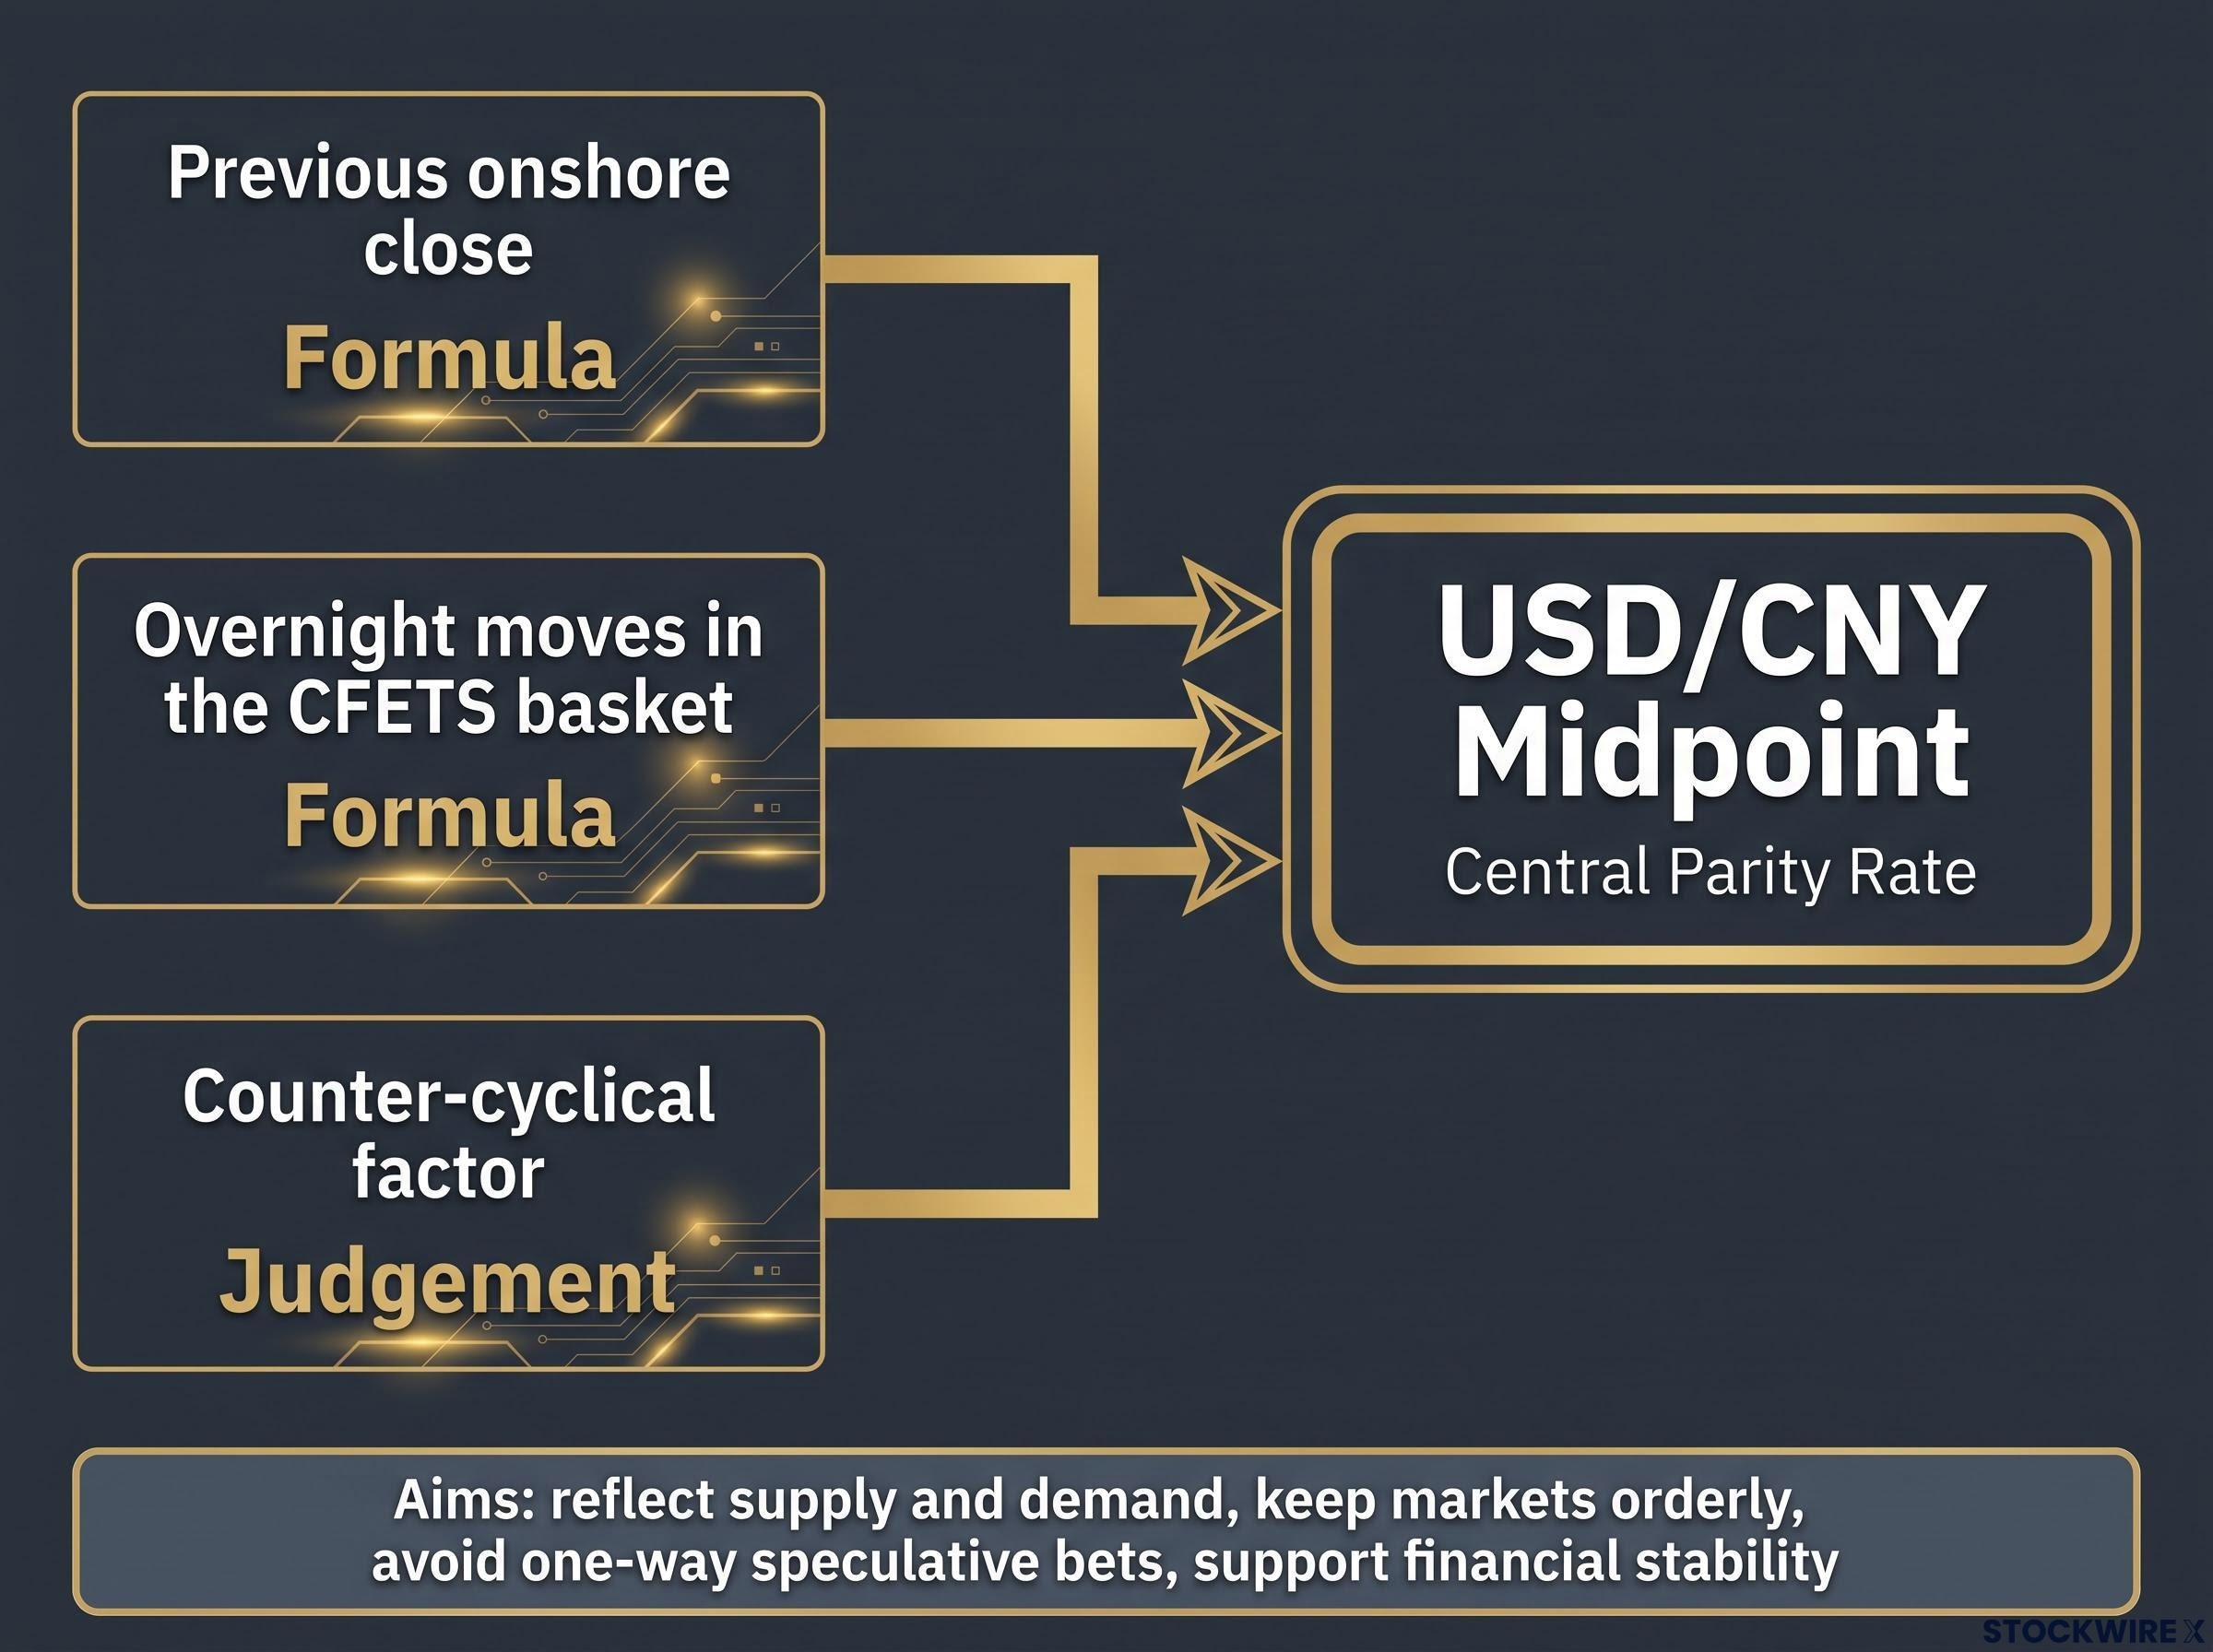
Here is how Thursday’s fix compares with the market’s model.
| Date/Item | Level | Gap vs Reuters estimate |
|---|---|---|
| Fix, 8 October 2026 | 6.7367 | About 113 pips weaker for the yuan |
| Prior fix, 7 October 2026 | 6.7351 | Not reported |
| Reuters estimate, 8 October 2026 | 6.7254 | Baseline |
| Spot USD/CNY | 6.7046-6.705 | Stronger than both fix and estimate |
The mechanism has stayed essentially unchanged through 2026. For you, that makes the fix the PBOC’s daily opening statement: any trade or exposure tied to the yuan starts from this anchor, not from spot alone.
How the ±2% band works
Spot is allowed to trade within 2% either side of the midpoint. In calm markets, it sits comfortably inside that corridor and the band barely matters.
You can see the fix as a daily routine, but how the fix is published each morning, with a hard 2% band around the midpoint, determines how far spot can wander before the PBOC steps in.
Under stress, or when traders all bet the same way, spot drifts toward the edges. That edge pressure is when you should expect louder signalling from the fix or direct intervention.
When big ASX news breaks, our subscribers know first
Why a weaker-than-expected fix is a message, not a mistake
Put the three numbers side by side. The model said 6.7254. The fix said 6.7367. The market said roughly 6.705.
The market and the model both pointed to a firmer yuan. The PBOC published something softer. That gap is the signal, and analysts read it with a simple rule of thumb:
- Fix stronger than model: the PBOC is resisting depreciation and wants to slow a falling yuan.
- Fix weaker than model: the PBOC is tolerating a softer yuan, or trying to moderate appreciation.
On Thursday, with spot stronger than the fix, the reading points to moderation. Beijing appears to be easing the brakes on a yuan that has been climbing toward multi-year highs, without pushing it into outright weakness.
This is a two-sided balancing act. A sharp fall risks capital outflows and instability. Too much strength hurts exporters and can attract inflows that reverse quickly.
Key takeaway The midpoint is both a technical anchor and a communication device. Where the PBOC places it relative to market estimates tells you which way it is leaning.
What this tells you is that the PBOC is currently leaning against a faster yuan rise rather than defending against weakness. If you hold export-sensitive or China-linked assets, that matters for how you price them.
The pattern may not be a one-off. A syndicated Reuters report on 21 September 2026 cited a fix of 6.7487, described as 536 pips weaker than the estimate, though this figure has not been independently confirmed.
Lessons from 2015 and 2022-2023
The signal can flip, and history shows how sharply. In August 2015, the PBOC changed the fixing mechanism and set the midpoint markedly weaker, effectively devaluing the yuan. Markets were caught off guard and a global risk-off move followed.
During the dollar strength of 2022-2023, reports suggest the opposite pattern: fixes stronger than models expected, alongside state-bank intervention, read as discomfort with rapid depreciation. That detail is not independently confirmed, and coverage of 2025 fixes was not found. The lesson for you is that the same tool can push in either direction depending on the regime.
For readers wanting to see fix signalling in a diplomatic context, our deep-dive into PBOC signalling around the Trump-Xi summit maps three post-November USD/CNH scenarios.
Who controls the PBOC, and which levers sit behind the fix?
So far you have read what the number says. The next question is who is speaking through it.
The PBOC is a state-owned central bank, and it is not autonomous. Real sway over its direction lies with the Chinese Communist Party (CCP) Committee Secretary, a figure put forward by the head of the State Council, and not with the governor. Pan Gongsheng currently holds both posts, which ties the bank’s technical and political leadership into one person.
The fix is one tool in a wider kit:
| Tool | What it does | Signal strength |
|---|---|---|
| Daily fix | Sets the USD/CNY midpoint and trading band | High visibility, daily |
| Seven-day reverse repo | Adjusts short-term funding for banks | Modest, frequent |
| Medium-term Lending Facility (MLF) | Provides medium-term funding to banks | Moderate |
| Reserve requirement ratio (RRR) | Sets the share of deposits banks must hold back; cuts release long-term liquidity | Often seen as stronger than small rate moves |
| Loan Prime Rate (LPR) | Benchmark rate for loans, mortgages and savings; can influence the renminbi | Often read as a coordinated policy move |
| FX intervention | State-owned banks reportedly sell dollars and buy yuan near band edges | Strong when paired with firmer fixes |
The banking system carrying out these policies is dominated by the state. China has 19 private banks, led by the digital lenders WeBank, backed by Tencent, and MYbank, backed by Ant Group.
The state-dominated banking system, where six giants hold roughly 44% of assets, is also why intervention and window guidance can be coordinated so quickly with the fix.
Because the fix, rates and intervention are coordinated, you should read them together. A single weak fix carries more weight if liquidity tools are moving the same way.
Independence: two readings
Many analysts see Chinese monetary and currency policy as closely coordinated with political and industrial priorities set by the Party and State Council. On this view, the LPR reflects administrative guidance and large state-bank behaviour as much as market forces.
Others point to increasingly rule-like frameworks, such as fixing formulas and macro-prudential tools, that resemble practice at other central banks. Both readings have support, and you will get the clearest picture by keeping each in mind.
How a hawkish Fed and a strong dollar squeeze the PBOC’s room to move
The fix does not move in a vacuum. It is one side of a tug-of-war with US interest rates.
At its 15-16 September meeting, the US Federal Open Market Committee (FOMC) raised the federal funds target range by 25 basis points to 3.75%-4.00%. The minutes, released on 7 October, were read as hawkish and reinforced bets on at least one more hike by year-end.
Yield watch The US 10-year Treasury yield briefly touched 5.349% on 5 October, its highest since 3 April 2002, according to CNBC.
The key backdrop indicators right now:
- US 10-year yield: around 5.28-5.34%
- US Dollar Index: about 102.2-102.3, the highest since March 2025
- USD/JPY: slipping below 158.00, with 160 the level traders are watching
- Gold: around US$4,100, near a two-month low
- UK 30-year gilt: above 6% on 1 October, the first time since early 1998
- Middle East tensions: reportedly lending the dollar further support
High US yields create a rate-differential risk. If the yuan weakens while US assets pay more, money can leave China. If the yuan gets too strong, exporters suffer. Wide gaps between the two countries’ rates raise real questions about how long any fixing strategy can hold.
Japan offers a parallel. Traders have been wary of pushing the yen past 160, amid warnings of possible coordinated Tokyo and Washington action, though reporting describes only verbal warnings, not confirmed intervention.
You should treat the fix as a gauge of how much dollar pressure Beijing will absorb, and watch it alongside Treasury yields rather than separately. Whether the current stance can last if yields keep climbing remains an open question.
These statements are speculative and subject to change based on market developments and policy decisions.
Reading tomorrow’s fix with the right expectations
You now have the frame: the fix is a daily signal, best read as the gap against the model estimate, then set against spot and US yields. A single number tells you little; the direction and persistence of that gap tell you a lot.
Three things are worth watching next:
- The next fix versus the Reuters estimate. A continued weaker-than-model gap confirms the PBOC is moderating yuan strength.
- The US 10-year yield. A push beyond 5.349% would test how much pressure Beijing is willing to absorb.
- USD/JPY near 160. Any official action in Tokyo could shift the wider Asian currency picture.
If all three move together, the signal deserves more weight in your decisions.
This article is for informational purposes only and should not be considered financial advice. Investors should conduct their own research and consult with financial professionals before making investment decisions. Past performance does not guarantee future results.
—