On a session when the major indices were printing fresh record highs, Nike was trading at prices last seen in 2013. Seagate shed double digits. Western Digital drifted toward a technical breakdown level that traders had been circling for weeks.
The broad rally was real. So were the landmines sitting underneath it.
Market breadth statistics and index closes can create a false sense of safety for anyone who holds individual stocks rather than the whole basket. The 2 October 2026 session made that tension visible in unusually stark terms: the same environment that lifted indices to records produced a multi-year collapse in one of America’s most recognised consumer brands and a sharp single-session loss in two names the AI storage narrative had elevated across 2026.
This piece is built as a diagnostic, not a recap. After reading it, you will know what separates a structural deterioration from a cyclical dip, how a single competitive catalyst can shatter an AI-narrative premium in hours, and what defined-risk options structures offer traders who want exposure to these inflection points without catastrophic downside if their timing is wrong.
How 80% disappears while the index keeps climbing
Nike beat on the top line. It beat on the bottom line. The market sold it anyway.
That contradiction is where the analysis has to start, because it is the single most counterintuitive feature of the whole move. Nike’s Q3 FY2026 report delivered revenue of $11.3 billion, ahead of consensus, and diluted EPS of $0.35, roughly 24% above what analysts had modelled. On a pure beat-the-number basis, this was a clean quarter.
Then came the parts that actually moved the stock. Gross margin contracted 130 basis points to 40.2%, driven by tariff-related cost increases, and management guided for a 2-4% revenue decline in the following quarter. The market treated the margin trajectory and the guidance as the only figures that mattered.
That reaction tells you something specific. When a stock falls on a double beat, it means the forward path has displaced the backward result as the thing investors are pricing, and that Nike’s credibility gap with the Street has widened to the point where beats alone no longer close it.
Nike’s Q3 earnings setup was complicated by the prior quarter’s adjusted EPS baseline, where a $0.52 per-share IEEPA tariff recovery benefit inflated the reported $0.72 figure and left underlying operational earnings power closer to $0.20, making the gross margin line and China constant-currency figure the only numbers that could shift conviction either way.
Here is the quarter at a glance.
| Metric | Q3 FY2026 Actual | Comparator |
|---|---|---|
| Revenue | $11.3 billion | Beat consensus |
| Diluted EPS | $0.35 | ~24% above expectations |
| Gross margin | 40.2% | Down 130 bps |
| Next-quarter guidance | -2% to -4% revenue | Revenue decline guided |
From earnings miss to thirteen-year low
The earnings reaction is a single data point. The multi-year chart is the story.
Here the sources diverge, and the divergence is worth flagging rather than smoothing over. The original Tasty Live market commentary describes Nike as having fallen roughly 80% over the prior five years. Finance Yahoo Markets coverage from 1 April 2026 cites a decline closer to 60% over its own five-year measurement window, alongside a year-to-date drop of 17% at that point. These are not contradictory. They reflect different start dates and different sessions, and both land on the same conclusion: a severe, sustained erosion.
Bloomberg’s 2 October 2026 coverage supplies the cleanest temporal anchor. Nike shares hit their lowest level since 2013. That framing reclassifies the situation entirely. This is not an earnings-day stumble; it is a thirteen-year round trip, and that is the context any buyer or seller has to weigh before touching the name.
When big ASX news breaks, our subscribers know first
Brand equity, competition, and the structural versus cyclical question
Every investor looking at a stock down this far is really asking one question: is this broken, or is this cheap? The honest answer is that the data does not yet settle it, and the strongest way to understand the debate is to build both cases at full strength.
Start with the bear case, because it carries real evidential weight. The structural headwinds analysts have identified are not speculative.
- Brand and product-cycle fatigue: core franchises have lost cultural momentum as fashion cycles shift.
- Competitive pressure: On and Hoka have taken share in performance running, while adidas presses in key categories, forcing heavier marketing spend and discounting.
- Inventory and channel legacy: prior periods of excess inventory and aggressive promotion are seen as having diluted brand equity, requiring a multi-year clean-up.
- China exposure: reliance on China for growth has become a liability as that market slows and consumer sentiment softens.
- Leadership and innovation critiques: some commentators point to slower innovation and over-reliance on a few marquee lines as self-inflicted erosion of premium positioning.
Now the bull case, which deserves equal analytical weight rather than a dismissive footnote.
- Nike retains enormous brand equity that newer entrants cannot replicate overnight.
- The restructuring programme targets $2.5 billion in savings and could restore profitability if executed.
- A successful product refresh or a genuine China recovery would change the competitive narrative quickly.
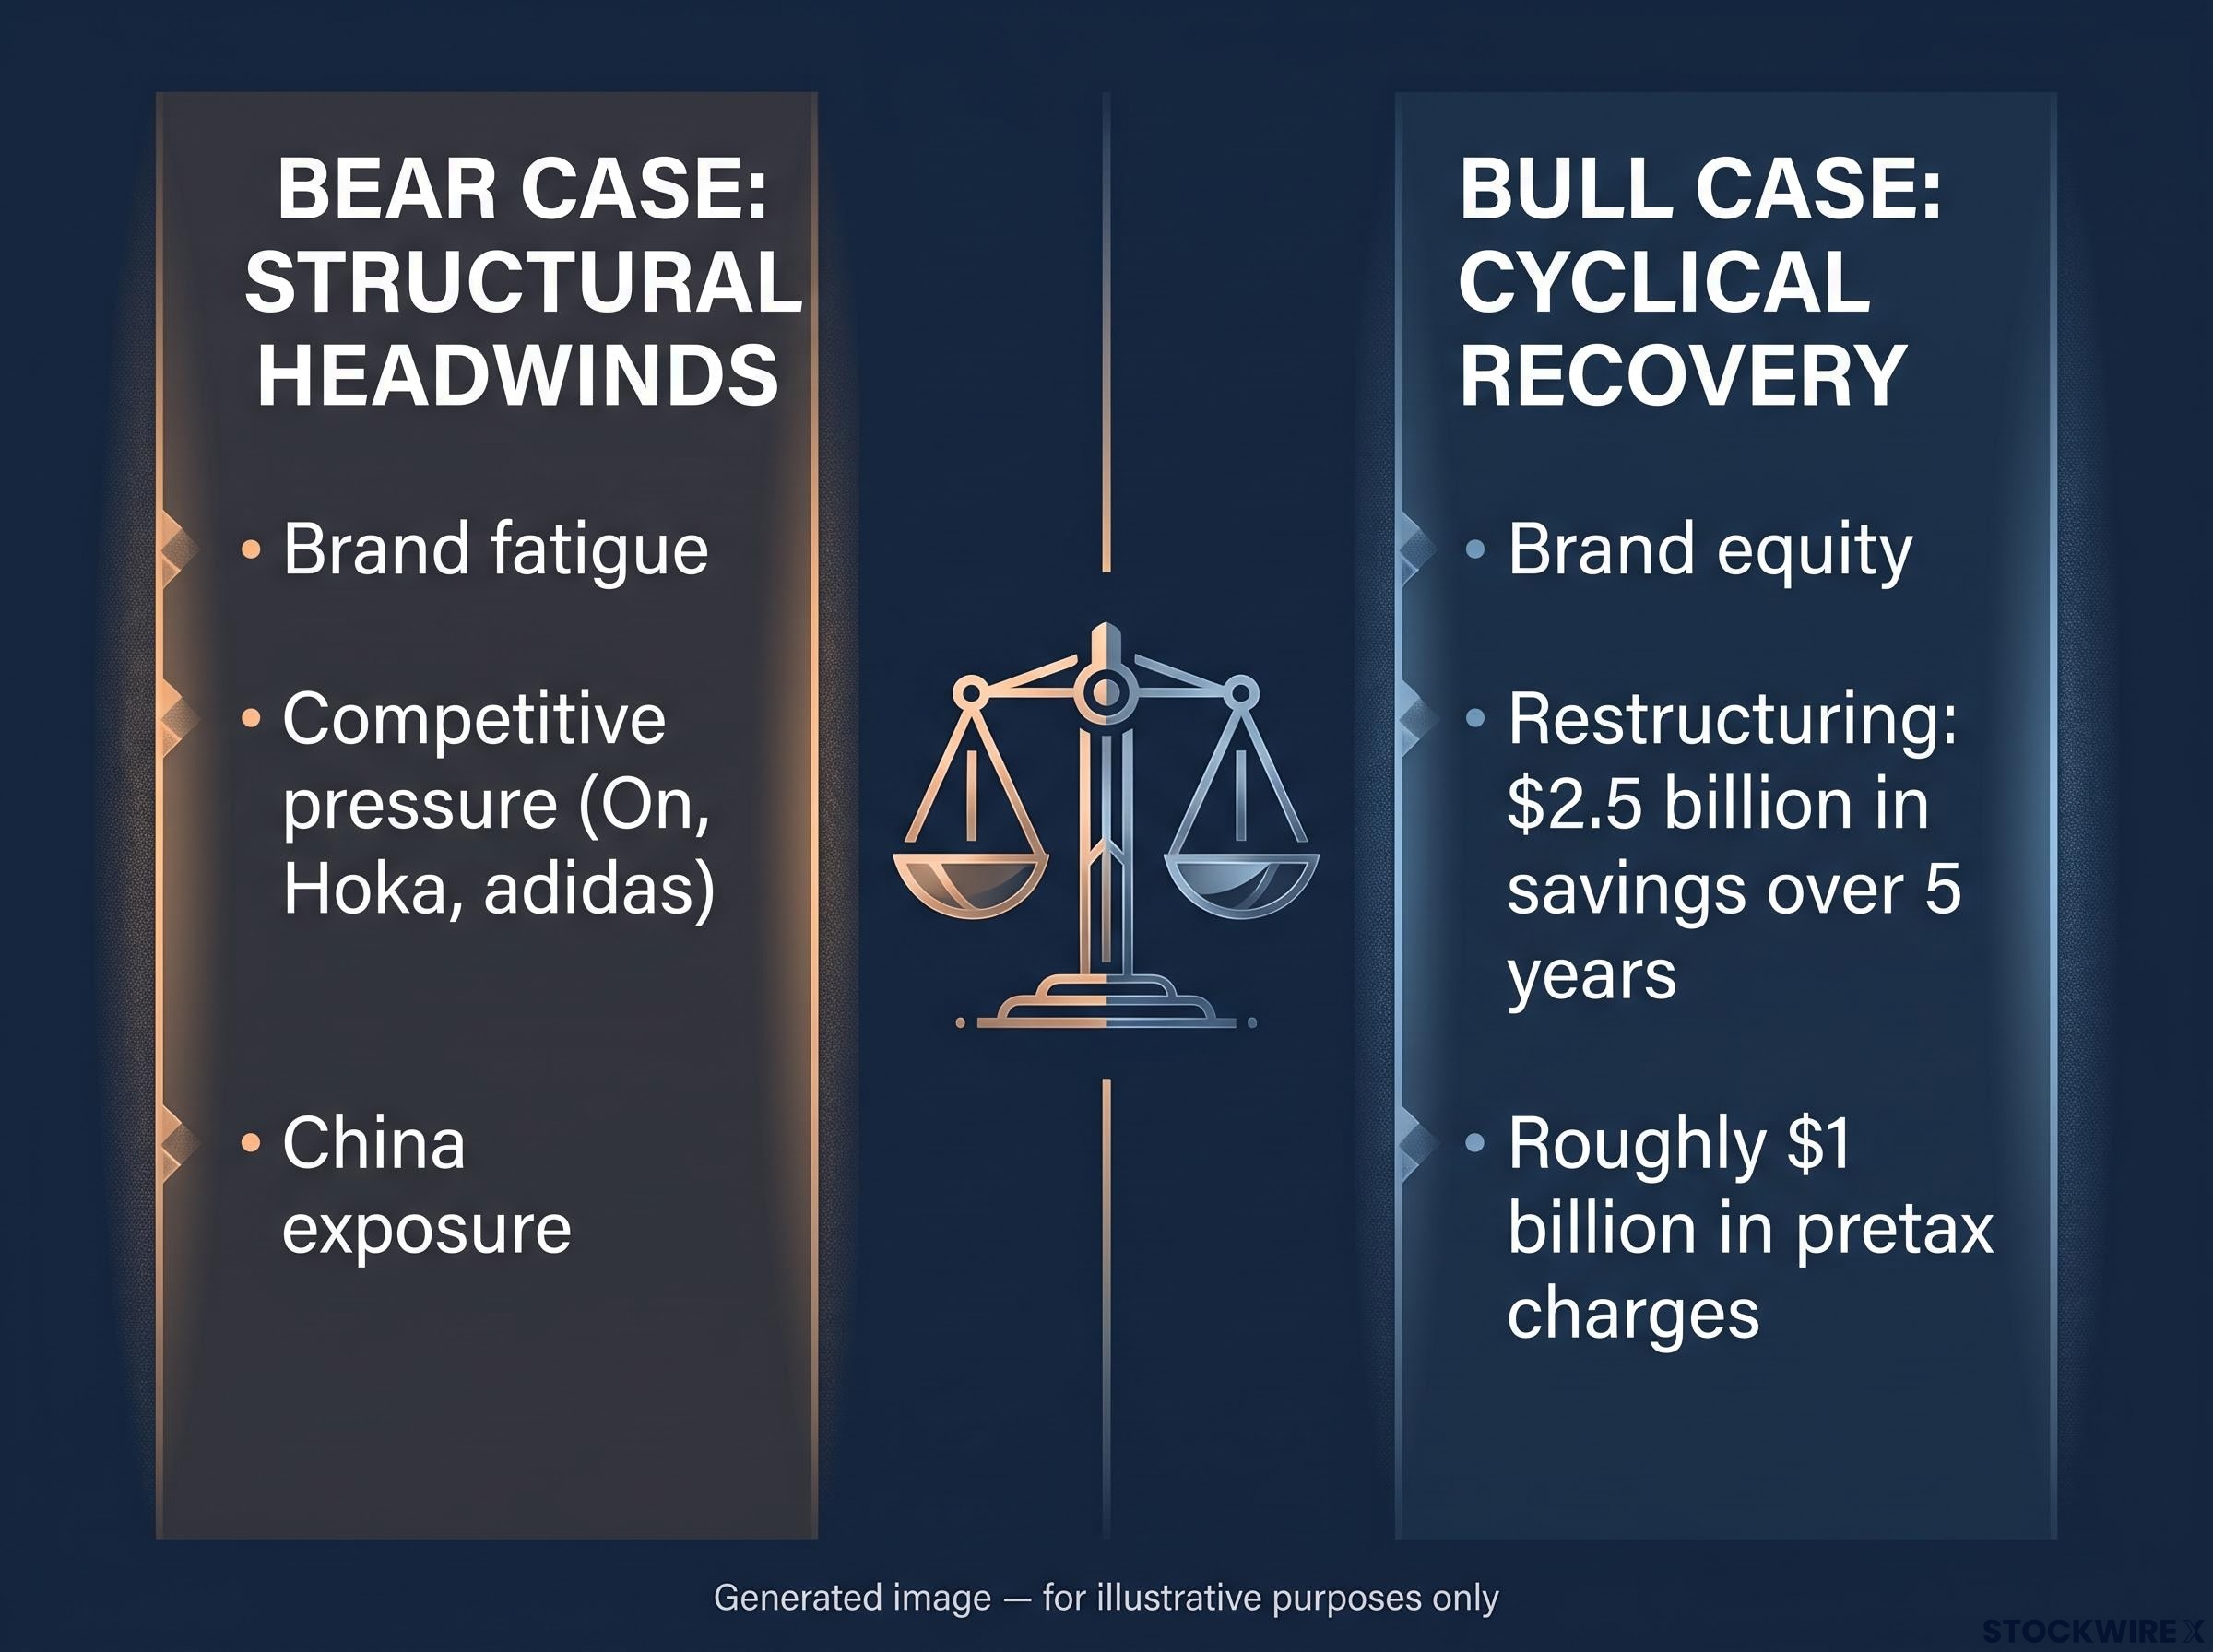
Restructuring target: $2.5 billion in savings over five years, against roughly $1 billion in pretax charges (Bloomberg, 2 October 2026).
That number is the hinge of the entire debate. The restructuring plan tells you that Nike’s own leadership has conceded the prior operating model is broken. Whether the $2.5 billion target is a credible floor under the business or a figure designed to buy time is precisely the question that separates the generational-buy thesis from the value-trap thesis.
Multi-name coverage referencing fiscal 2027 revenue decline expectations reinforces the bear reading rather than the bull one. Until the savings trajectory produces visible margin recovery, the structural camp holds the stronger hand on evidence. The point is not to pick a winner here; it is to recognise that the tension is live, and that any position taken in Nike is a bet on which thesis the next few quarters validate.
Toshiba’s ¥60 billion bet and what it means for Seagate and Western Digital
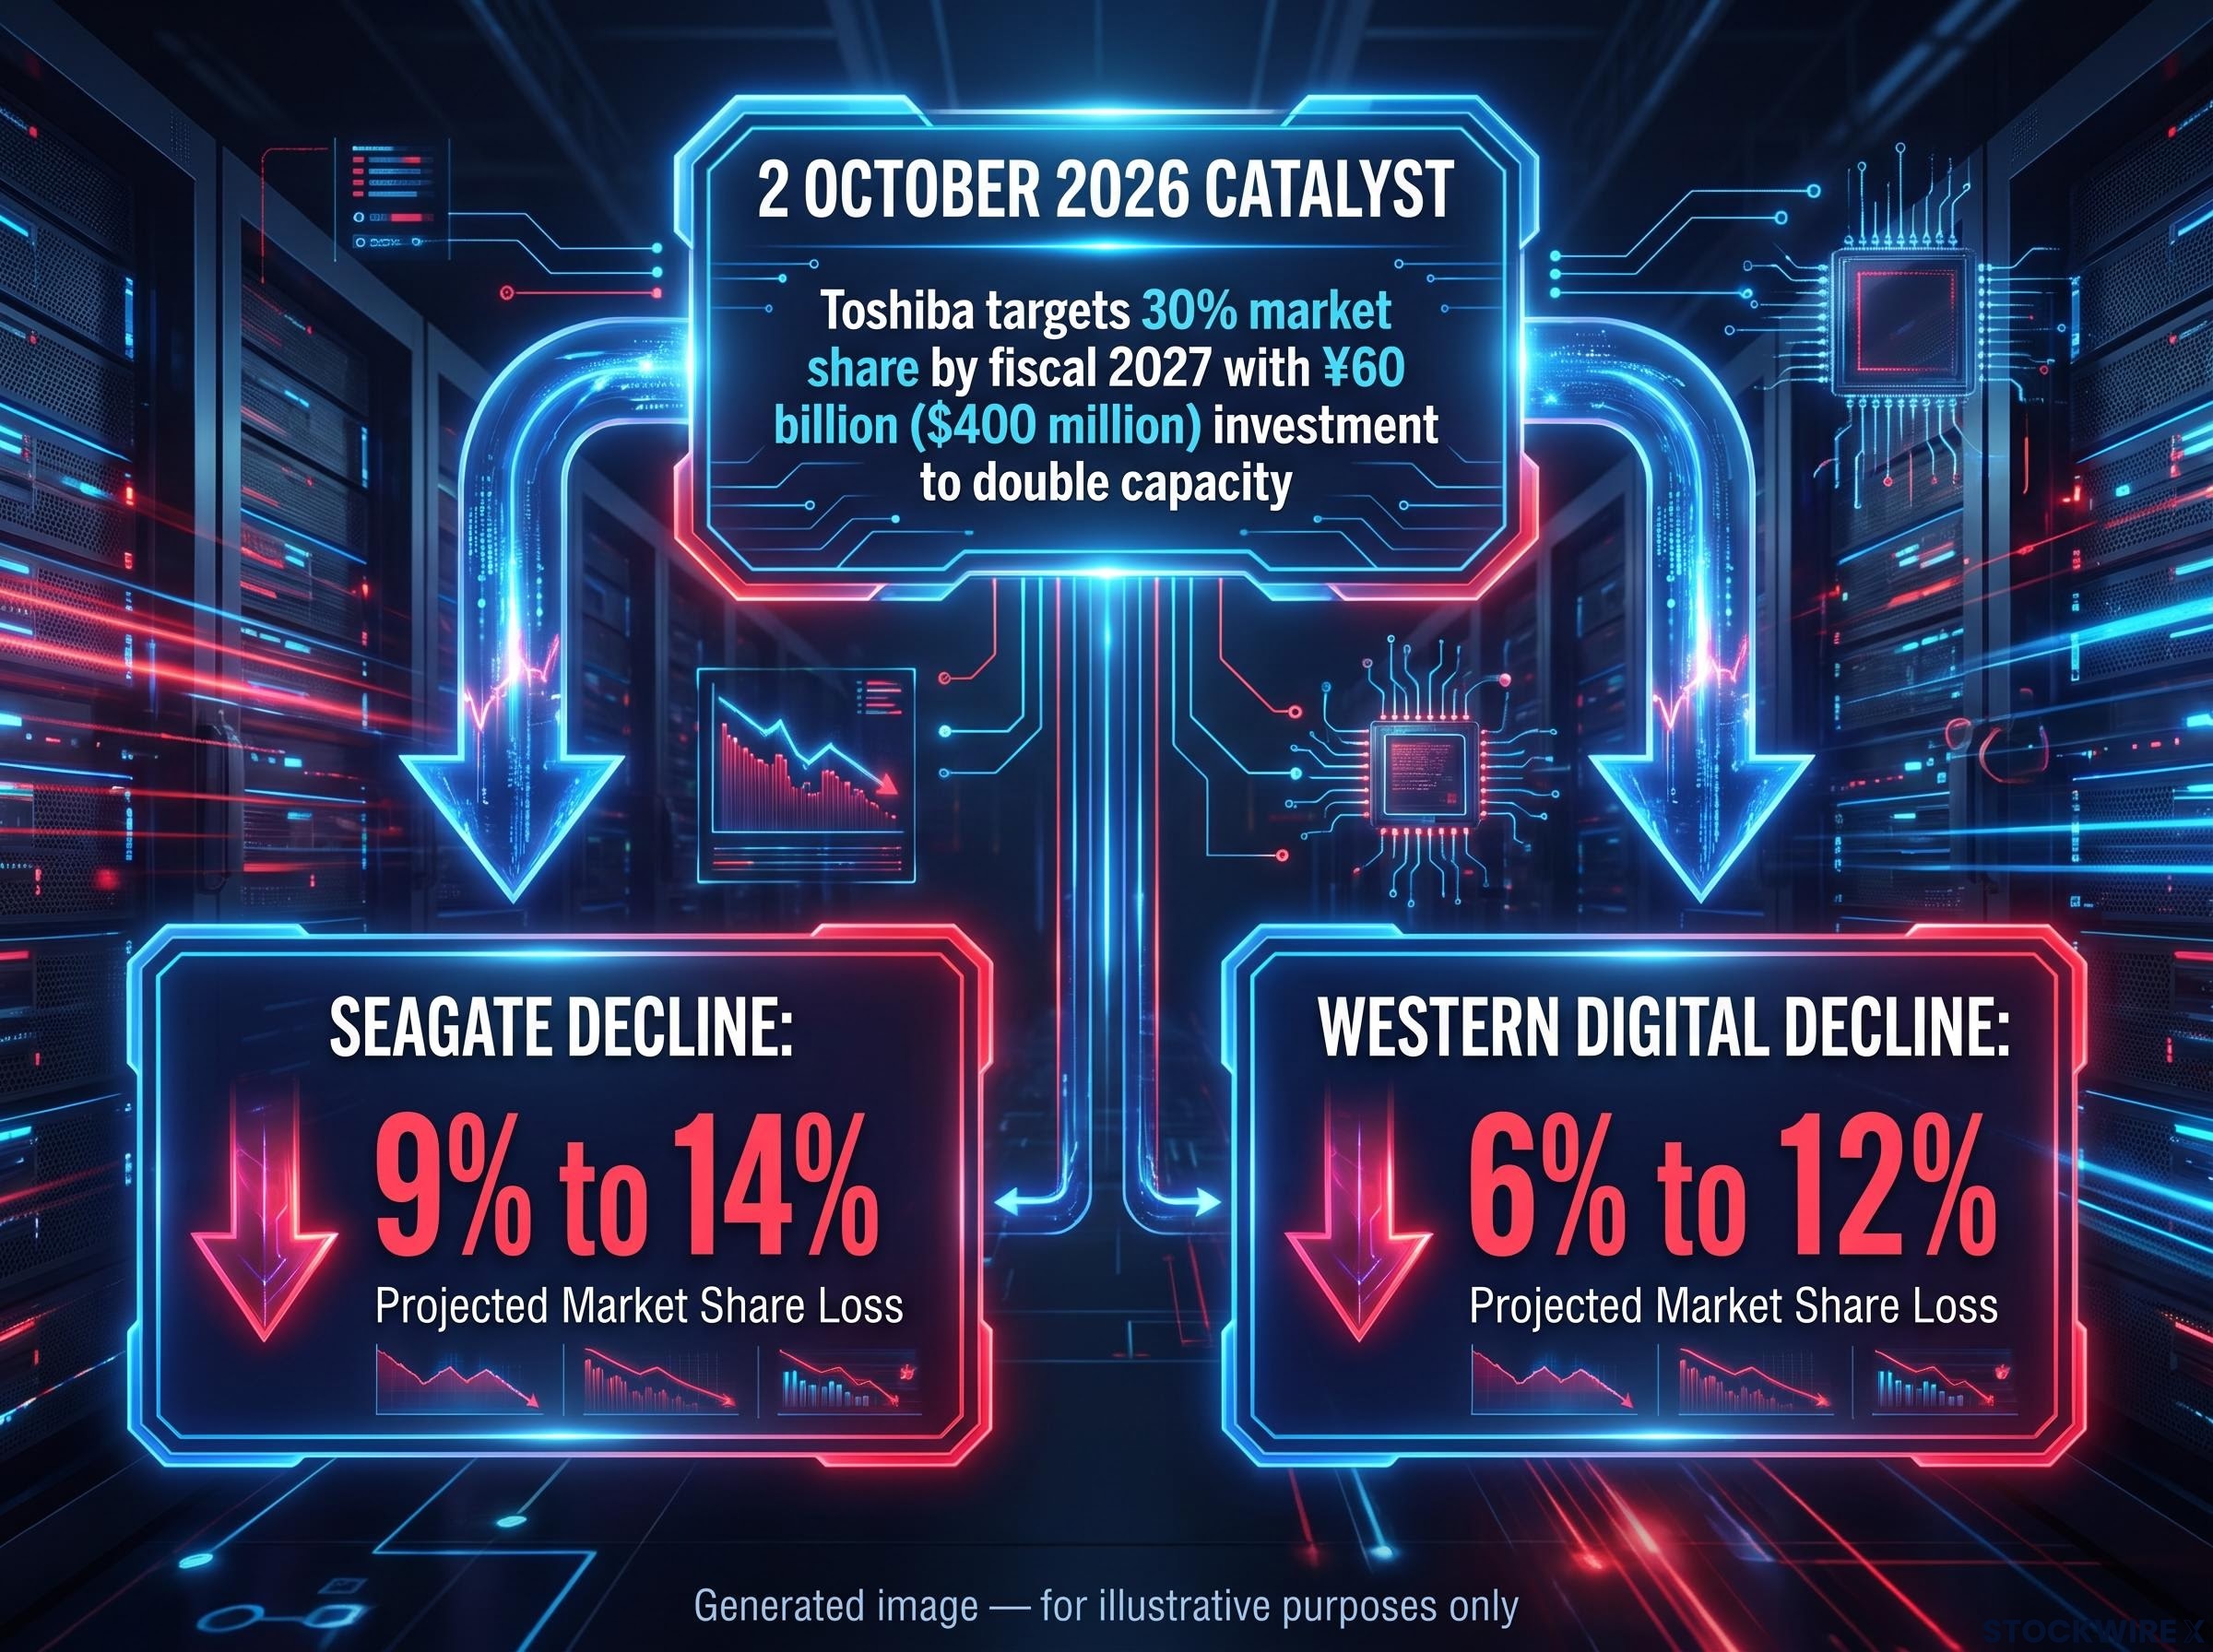
Toshiba is targeting roughly 30% market share by fiscal 2027, backed by a planned investment of approximately ¥60 billion (around $400 million) to double its hard disk drive production capacity.
That announcement, reported by Nikkei and carried across multiple outlets on 2 October 2026, was the inciting event. It reads like a capacity story. For Seagate and Western Digital, it functioned as a valuation reset.
The reason it hit so hard is specific to how these two names had been positioned. Both had been elevated through 2026 by the AI data-center storage narrative, which pushed valuations and investor expectations to levels that left almost no margin for any supply-side deterioration. A credible third competitor announcing it intends to double output and seize nearly a third of the market is exactly the kind of signal those expectations could not absorb.
The AI storage premium that elevated Seagate and Western Digital through 2026 was built on a supply picture that looked very different earlier in the year, when major hardware suppliers had sold out production capacity and enterprise hardware prices for high-capacity models had surged as much as 60% amid projections that demand would outstrip supply through the full calendar year.
The exact magnitude of the move depends on which source you read, and the discrepancy is large enough that it deserves transparency rather than a single blended figure.
| Source | Seagate decline | Seagate price | Western Digital decline | Western Digital price |
|---|---|---|---|---|
| Tasty Live commentary | ~14% | ~$123 | ~12% | ~$54 |
| 2 Oct 2026 research layer | ~10-11% | ~$847-$850 | ~7% | ~$429-$430 |
| GuruFocus (2 Oct 2026) | ~9% | Not stated | ~6% | Not stated |
The price-level gap almost certainly reflects different time periods between the original commentary and the later research layer. The direction of travel is identical across all three, and that is the point that matters.
This did not happen in a vacuum. A 2 July 2026 episode, in which memory and storage names sold off on supply-glut fears, offered earlier evidence of how fragile the group had become to any capacity-expansion signal. That July source is Perplexity-sourced and not independently confirmed, so treat it as context rather than hard data.
What the session declines tell you is blunt: the AI storage premium was not backed by durable pricing power. A single credible capacity announcement from one competitor was enough to reset the market’s assumption in hours. For anyone holding these names on the AI demand thesis, the risk picture has shifted. The question is no longer whether AI demand grows, but whether it grows fast enough to absorb new competitive supply at the margins the market had already priced in.
Defined-risk structures when a breakdown level is in play
Here is the practitioner’s dilemma in plain terms. You want directional exposure to a name that looks poised to break down, but you also need to survive being wrong about the timing. Outright shorts solve the first problem and create a second, potentially unlimited one.
Western Digital made this concrete. At the time of the Tasty Live commentary, it was approaching a potentially significant technical breakdown level, sitting close to a key support zone. That is the exact scenario where defined-risk structures earn their keep, and the commentary noted a participant adding defined-risk call butterfly positions in the storage names as a dollar-cost-averaging approach that kept total exposure contained.
Mechanically, a butterfly spread is long one option at a lower strike, short two options at a middle strike, and long one option at a higher strike. The trader is betting the stock gravitates toward that middle strike by expiration, whether that middle strike represents a support zone, a resistance level, or a post-breakdown drift target. The structure profits when the stock settles near the target and keeps the maximum loss fixed and known.
Butterfly spread mechanics become especially relevant at technical inflection points like the Western Digital breakdown level: a real NDX example shows a call butterfly entered for just $2.90 on a $5,000-wide structure, illustrating how the high-convexity, low-capital profile can express a directional thesis without requiring precision on the exact price target.
The advantages over an outright short follow a clear logic.
- Risk containment: maximum loss is capped at a known amount from the moment of entry, unlike a short position whose losses are theoretically unlimited if the stock spikes.
- Capital and margin efficiency: the structure requires less margin than an outright short, letting a trader express the view with a smaller outlay and no exposure to margin calls on extreme adverse moves.
- Known worst-case from entry: the downside is defined before the trade is placed, so a short squeeze or surprise headline cannot convert a manageable loss into a catastrophic one.
When outright shorts make more sense
Defined-risk is not automatically superior. Practitioner reasoning favours an outright short when conviction about structural deterioration is very high, when the name carries deep liquidity, and when the trader is genuinely comfortable with the volatility and margin demands of an uncapped position.
The distinction sharpens around catalysts. Earnings dates and technical inflection points elevate gap risk, the chance a stock jumps violently in one direction overnight. That gap risk is precisely what makes defined-risk structures most valuable relative to uncapped positions. The trade-offs are real, and honesty about them matters:
- Capped profit: gains cannot run beyond the targeted strike zone.
- Strike and timing precision: being directionally right but imprecise on price or timing can still produce a loss.
- Time decay: if the expected move arrives too slowly, the position erodes.
- Liquidity and execution cost: wider bid-ask spreads in less-liquid names reduce effective profitability.
The deeper lesson holds regardless of whether you ever trade an option. The most experienced traders around this breakdown level were not making uncapped directional bets. They were designing positions where being wrong about timing could not become a ruinous outcome, and that discipline is worth internalising on its own.
What index strength conceals, and what to watch next
On a session when major indices hit fresh record highs, Nike closed at its lowest level since 2013.
That single contrast is the durable lesson. Across 2026, broad index resilience has repeatedly masked severe idiosyncratic deterioration in individual names, and the 2 October 2026 session was among the sharpest illustrations yet. The index number on any given day is the least useful piece of information a stock picker holds. The real work lives in judging whether a given name’s deterioration is already priced in or still unfolding.
Index breadth divergence has been a recurring feature of the 2026 rally, with only 23% of S&P 500 constituents outperforming the benchmark in April despite a 98th-percentile monthly return, confirming that the gap between headline index performance and individual stock outcomes is not a single-session anomaly but a pattern that has compounded across the year.
For Nike, two variables decide the next move. Whether the $2.5 billion restructuring savings trajectory justifies the current price, and whether any product-cycle or China-recovery signal shifts the competitive picture.
For the storage names, two different variables matter. Whether AI data-center demand growth outpaces Toshiba’s fiscal 2027 capacity doubling, and whether further supply-side announcements from other competitors reset valuations again.
Keep this checklist in view:
- Does Nike’s restructuring produce visible margin recovery, or just charges?
- Does a product or China catalyst change the Nike narrative?
- Does AI storage demand absorb new supply before fiscal 2027?
- Do further capacity announcements reset storage valuations again?
This article is for informational purposes only and should not be considered financial advice. Investors should conduct their own research and consult with financial professionals before making investment decisions. Past performance does not guarantee future results, and forward-looking statements are speculative and subject to change based on market and company developments.