At 12:30 GMT today, a single data release will tell markets whether the most aggressive bond selloff in nearly two decades just found a reason to pause or a reason to deepen.
The September Nonfarm Payrolls report arrives with 10-year Treasury yields sitting at their highest level since 2007, a Federal Reserve rate hike probability above two-thirds priced into futures markets, and economists expecting job creation to come in at roughly half the August figure.
That confluence of a historically stressed bond market and a potentially soft labour print creates unusual two-way risk for investors across equities, fixed income, and the dollar.
This piece breaks down the consensus numbers, explains why this particular jobs report carries more market-moving weight than most, and maps out what each scenario, from a mild miss to a sharp undershoot, signals for the Fed’s next move. After reading, you will know which figures to watch at the moment of release and how to interpret what you see.
What the consensus numbers actually say
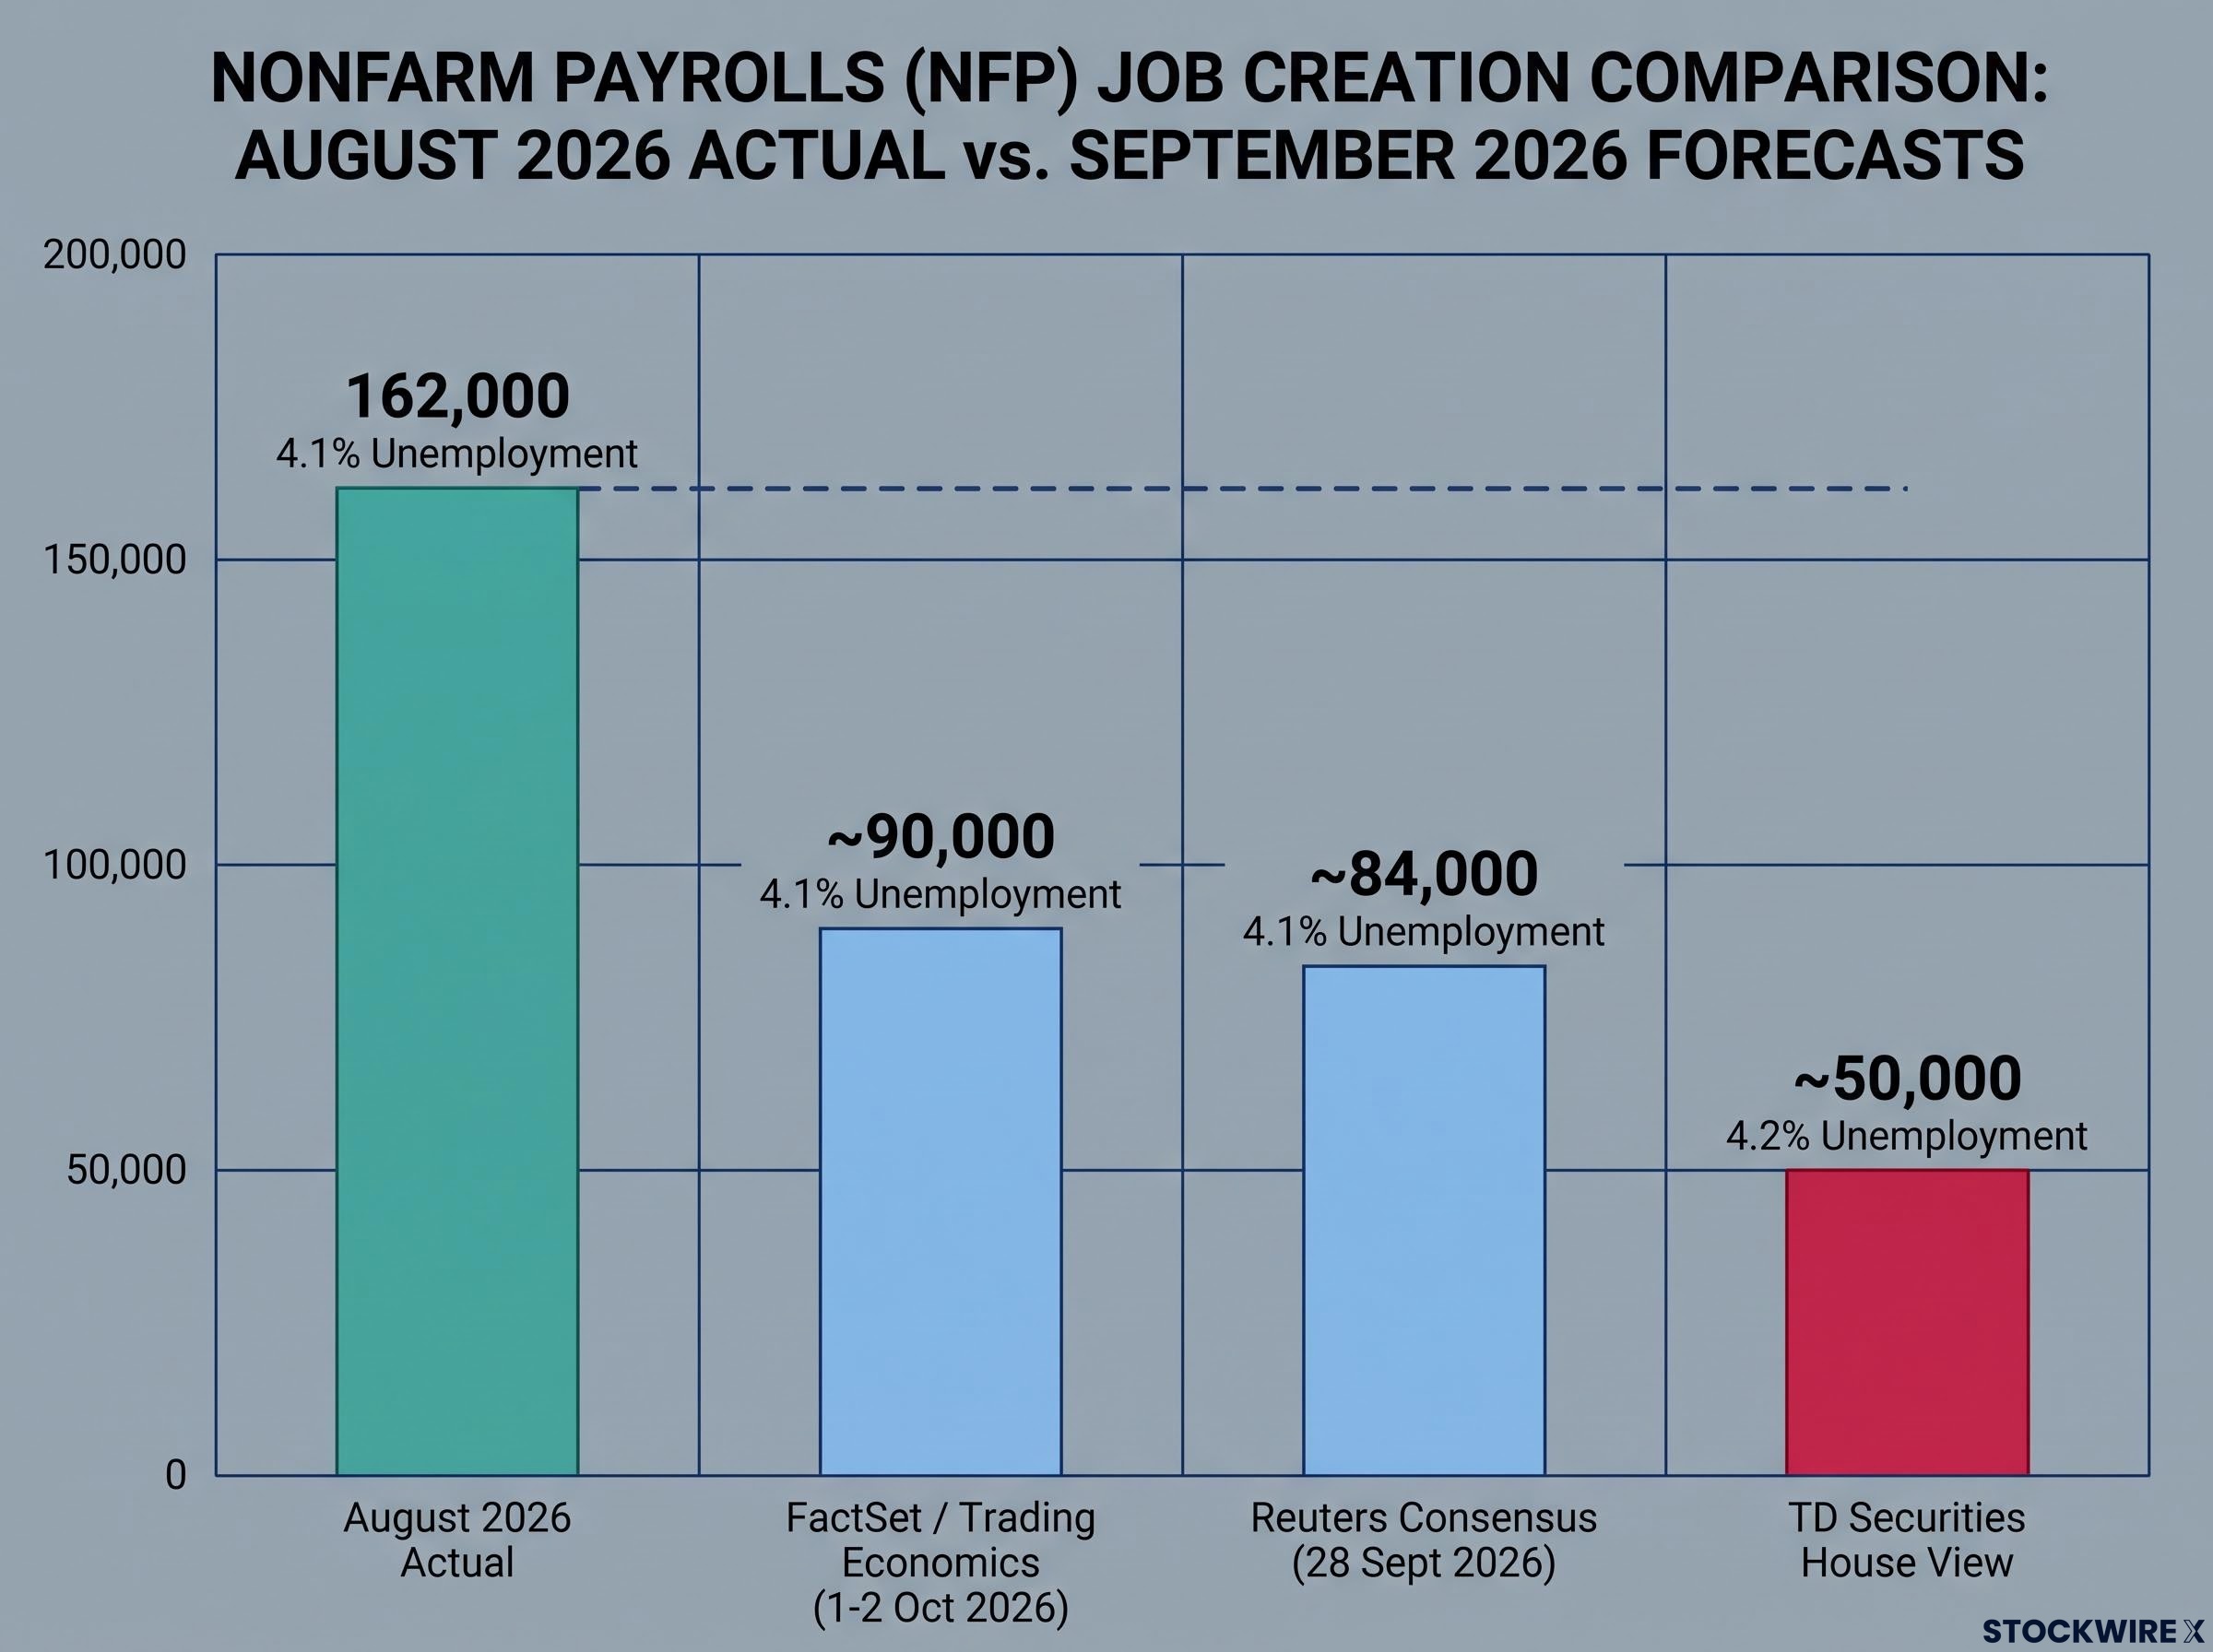
The expectation landscape for September is clear and noticeably subdued. The Reuters consensus, published 28 September 2026, projects around 84,000 nonfarm payrolls. Broader aggregators including FactSet and Trading Economics land slightly higher, converging on roughly 90,000 in previews dated 1-2 October 2026.
Then there is the outlier. TD Securities holds a house view of just 50,000 additions, with unemployment ticking up to 4.2%. That is a single-institution position, not consensus, but it sets the floor for how bearish credible forecasters are willing to get.
| Source | Forecast (NFP) | Unemployment Rate |
|---|---|---|
| Reuters consensus | ~84,000 | 4.1% |
| FactSet / Trading Economics | ~90,000 | 4.1% |
| TD Securities (house view) | ~50,000 | 4.2% |
| August 2026 (actual) | +162,000 | 4.1% |
The context row is where the tension lives.
The BLS Employment Situation release for August confirmed 162,000 nonfarm payroll additions and an unemployment rate of 4.1%, the baseline against which September’s expected near-halving of job creation will be measured.
The central comparison: August delivered 162,000 jobs. September is expected to deliver around 90,000. That is nearly half the hiring in a single month.
Two secondary figures will shape how the headline is read. Consensus has the unemployment rate holding steady at 4.1%, and average hourly earnings growth staying at 0.3% month-over-month.
The near-halving of expected job creation is not routine month-to-month noise. It positions this release as a potential turning point in the debate over whether the US labour market is finally cooling fast enough to matter for the Fed.
For you, the practical takeaway is calibration. A print near 90,000 is largely baked into current pricing. A print near 50,000 is not, and that gap is where the market reaction lives.
When big ASX news breaks, our subscribers know first
Why this jobs report lands in unusually hostile terrain
This report is not arriving into a calm market. It is arriving into one of the most stressed Treasury environments in a generation, and that backdrop amplifies every data point.
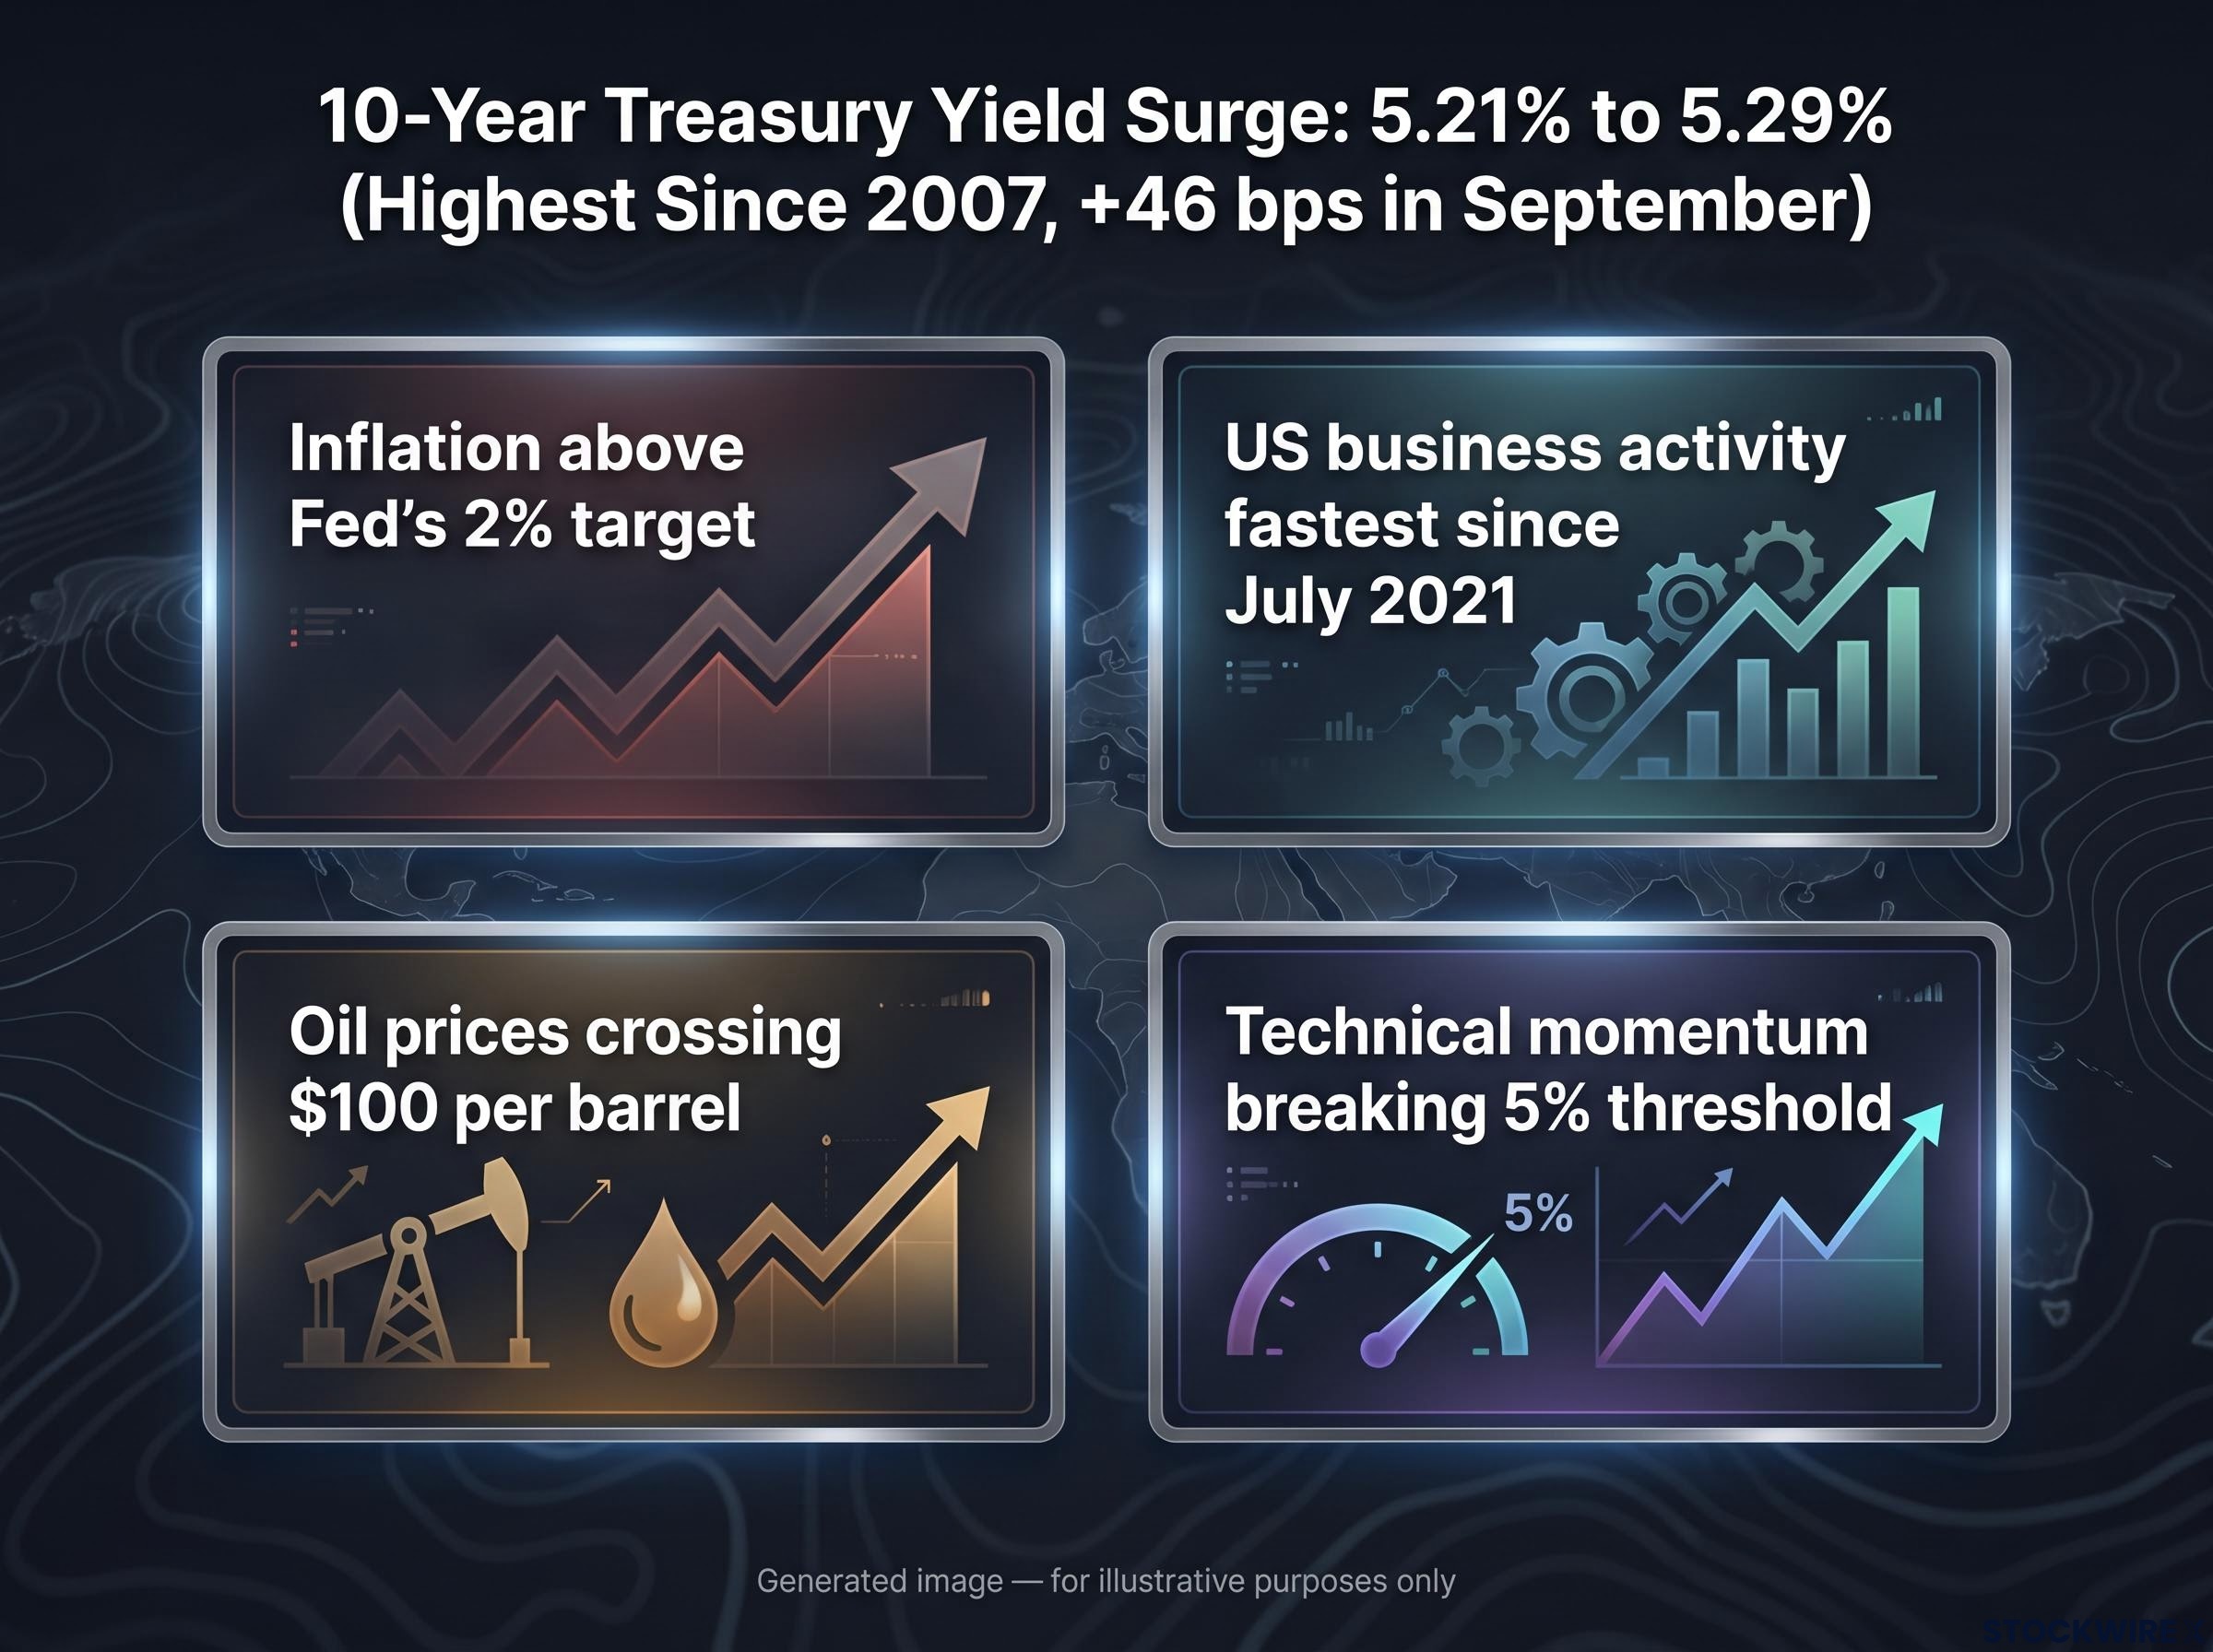
The 10-year Treasury yield has surged to a range of roughly 5.21% to 5.29% across late September and early October, its highest level since 2007, nearly 19 years. More telling than the level is the speed: the yield climbed around 46 basis points in September alone.
A move of that pace at these levels means the repricing is not theoretical. If you hold bonds or watch equity valuations, it is already landing in your portfolio, and today’s print is the next catalyst that either accelerates or interrupts it.
The asset class repricing triggered by 5% Treasury yields operates on different timelines across markets: equity multiples compress within days as discount rates rise, corporate credit spreads widen over weeks, and mortgage and consumer costs drag on the real economy over quarters, giving investors a clear transmission sequence to monitor alongside today’s print.
Several reinforcing forces are driving the surge:
- Inflation remaining above the Fed’s 2% target, keeping the case for restrictive policy alive
- US business activity accelerating at its fastest pace since July 2021, according to S&P Global PMI data
- Oil prices crossing $100 per barrel during the period, feeding fresh inflation expectations
- Technical momentum following the break of the psychologically important 5% threshold
The first three are fundamentals. The last is market mechanics, and it matters more than it looks.
The 5% threshold and what broke after it
Once the 10-year yield pushed through 5%, the move gained steam. According to CNBC analysis, that breach acted as a technical trigger, with stop-loss orders and momentum positioning intensifying the selloff beyond what the fundamentals alone justified.
That matters for how you read today’s data. When a market is carried partly by momentum rather than pure fundamentals, a negative surprise in the payrolls figure can unwind that positioning fast, producing a sharper reaction than the number itself would warrant.
In other words, the backdrop does not just set the scene. It loads the spring.
How the Fed reads a weak payrolls print against this backdrop
Here is where the analysis refuses to resolve cleanly, because Fed officials face a genuine tension rather than an obvious answer. Two competing frameworks are in play:
- Framework 1: A materially weak print, especially one closer to TD’s 50,000 than to the 90,000 consensus, shifts the dual-mandate balance toward employment concerns and weakens the case for an October hike.
- Framework 2: With inflation above target, business activity at multi-year highs, and yields already tightening financial conditions, one soft month may not move the needle enough to derail an October move.
Under the first reading, weaker labour data reduces the urgency of further tightening. The Fed is charged with both price stability and maximum employment, and a sharp cooling in hiring tilts the scales toward the employment side of that mandate.
The Fed’s dual mandate creates a genuine tension when employment and inflation signals point in opposite directions, and with inflation above target and unemployment already at 4.1%, the current configuration places price stability firmly as the dominant objective when the two sides of the mandate pull against each other.
The second reading pushes back. Much of the recent market action has been driven by inflation worries and surging yields, not labour data at all. In that frame, even a soft payrolls figure might not be enough to stop the Fed if the broader picture still looks like an economy running hot.
The clearest real-time expression of this tension sits in the futures market.
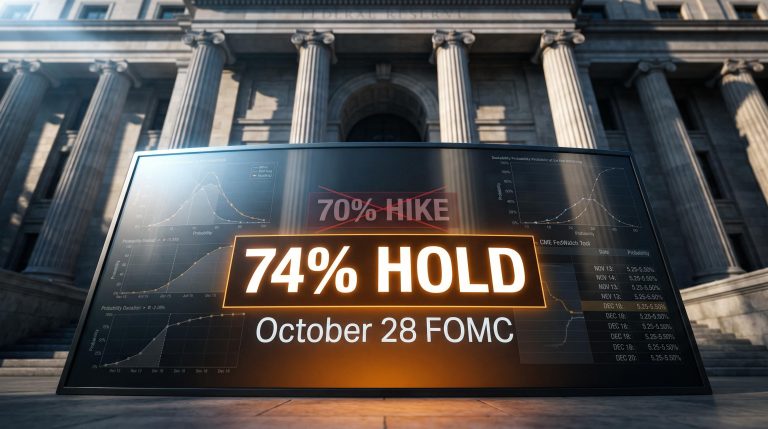
CME FedWatch: Market-implied odds of a 25-basis-point October hike peaked above 75% around 24 September 2026, before moderating to roughly 68% by 28 September.
That 68% reading heading into the release is the key signal. It means markets are genuinely uncertain, not committed, and the payrolls print will move that number materially in one direction or the other within minutes of release.
For you, if you hold rate-sensitive positions, this is not an academic debate. It determines whether the Fed has one more hike in this cycle, or whether September becomes the data point that opens a pause discussion.
What to watch the moment the data drops
When the numbers hit at 12:30 GMT, watch three figures in this order of priority:
- Headline NFP. The number that sets the narrative and moves markets first.
- Unemployment rate. Consensus holds it at 4.1%; a rise to 4.2% would corroborate a cooling story.
- Average hourly earnings. At 0.3% month-over-month, this is the inflation read inside the jobs report, and the Fed watches it closely.
Each figure carries a different signal, which is why the order matters. The headline moves the tape, but wages tell the Fed whether the labour market is still feeding inflation.
The mechanics of reading the payrolls report extend well beyond the headline number; revisions to the prior two months of data routinely reshape the narrative within minutes of release, yet most investors never look past the first figure that crosses the wire.
Three scenario thresholds frame the outcomes:
- At or above ~90,000: Largely confirms the priced-in narrative. Limited surprise.
- Near 50,000 or below: A genuine shock that could meaningfully lower October hike odds.
- Between 50,000 and 84,000: Contested territory, where the reaction depends on the wage and unemployment figures alongside it.
| Scenario | Headline NFP Range | Implied Fed Signal | Likely Market Reaction |
|---|---|---|---|
| In line / firm | ~90,000 or above | Hike case intact | Muted; mostly priced in |
| Soft shock | ~50,000 or below | Pause discussion opens | Yields may unwind sharply |
| Contested | 50,000-84,000 | Depends on wages, unemployment | Two-way, data-dependent |
Before you react to any of it, hold the caveats in mind. Initial payrolls estimates are routinely revised by tens of thousands of jobs as the Bureau of Labor Statistics gathers more complete data, so the first print is rarely the final word.
September also carries known seasonal quirks, with education-sector timing and leisure and hospitality patterns both feeding month-to-month volatility. A sector-specific shock such as a major strike can depress the headline without signalling broad labour market deterioration.
None of that is a reason to dismiss the report. It is a reminder that the Fed will not change course on a single print, and neither should you reconfigure a portfolio around one number.
One report, one data point, and a Fed that will take weeks to decide
Today’s payrolls figure is a high-stakes input, but it is not a verdict. The Fed’s October decision will also weigh subsequent inflation releases, the trajectory of yields, and any sign that the pace of the bond selloff is creating financial stability stress.
History offers a range of outcomes to hold open. In late 2018, the combination of rising yields, a strong dollar, and equity volatility helped push the Fed from further hikes toward a pause. In the post-2021 cycle, the Fed pressed ahead with tightening despite similar pressures, prioritising the restoration of price stability.
The current configuration, with yields at 2007-era highs and inflation still above the 2% target, sits closer to the post-2021 experience, though that 46-basis-point monthly move introduces the kind of market-stress risk the Fed cannot ignore.
Between now and the October FOMC meeting, watch:
- The next CPI inflation release
- Signs of stress in credit markets and broader financial stability
- Any Fed communications, including speeches and meeting minutes
Whether today’s print lands as soft confirmation or genuine shock, the October decision is not made today. The next two to three weeks of data will matter at least as much as what prints at 12:30 GMT, which is why a calibrated posture beats a reactive one.
For investors wanting to understand why each data release now carries far more pricing weight than it did under previous Fed regimes, our full explainer on the end of Fed forward guidance covers how the removal of rate path signals forces markets to absorb shocks like today’s payrolls print without an official buffer.
This article is for informational purposes only and should not be considered financial advice. Investors should conduct their own research and consult with financial professionals before making investment decisions. Past performance does not guarantee future results, and these statements are speculative and subject to change based on market developments.