FLT Share Price vs. 90% Revenue Growth: Analysing the Gap
29 mins ago


Brent crude fell nearly 5% at Monday’s open on 25 May 2026, slipping below $100 per barrel on hopes of a US-Iran peace deal. That move may already be unwinding. Negotiations mediated by Oman and Qatar have stalled badly. Reuters reporting from 22-23 May characterised the talks as “near collapse,” with a sequencing impasse at the centre: Iran demands asset releases and sanctions removal before taking any nuclear steps, while Washington insists on verifiable constraints first. Neither side has offered a credible bridging mechanism. This analysis maps the transmission channels through which a formal collapse of these talks would move oil, sovereign bonds, and equities, and identifies why current investor positioning makes markets more vulnerable to that outcome than headline sentiment suggests.
The roughly 5% single-session oil decline on 25 May is not neutral data. It is an embedded forecast: the market priced in a deal that has not been struck, and the distance between that optimism and a collapse scenario is not a modest correction. It is a potential repricing event that multiple major bank research teams have modelled with specific numbers.
As of Reuters’ 24 May market wrap, Brent crude futures sat at approximately $99 per barrel and WTI at approximately $95 per barrel, both down roughly 5% on the week. Those levels already reflect deal optimism. A reversal of that optimism would not simply restore the prior week’s prices; it would add a fresh risk premium on top.
The roughly 5% decline on 25 May follows an earlier, larger move on 7 May when Brent dropped from $116.55 to approximately $99, an episode that analysts characterised as a probability repricing event rather than any genuine supply recovery, given that the Strait of Hormuz remained physically closed throughout the session.
The Strait of Hormuz makes this asymmetry structural. A significant share of the world’s seaborne crude and condensate passes through the strait, meaning any genuine shipping threat represents a first-order supply shock that strategic petroleum reserves can only partially and temporarily offset.
The International Energy Agency has acknowledged that a major Strait of Hormuz disruption could have “severe consequences” for global supply and prices, noting that spare capacity and strategic reserves provide only partial offset.
The gap between current sub-$100 Brent and the worst-case analyst scenarios illustrates the full scope of downside risk if deal optimism proves unfounded.
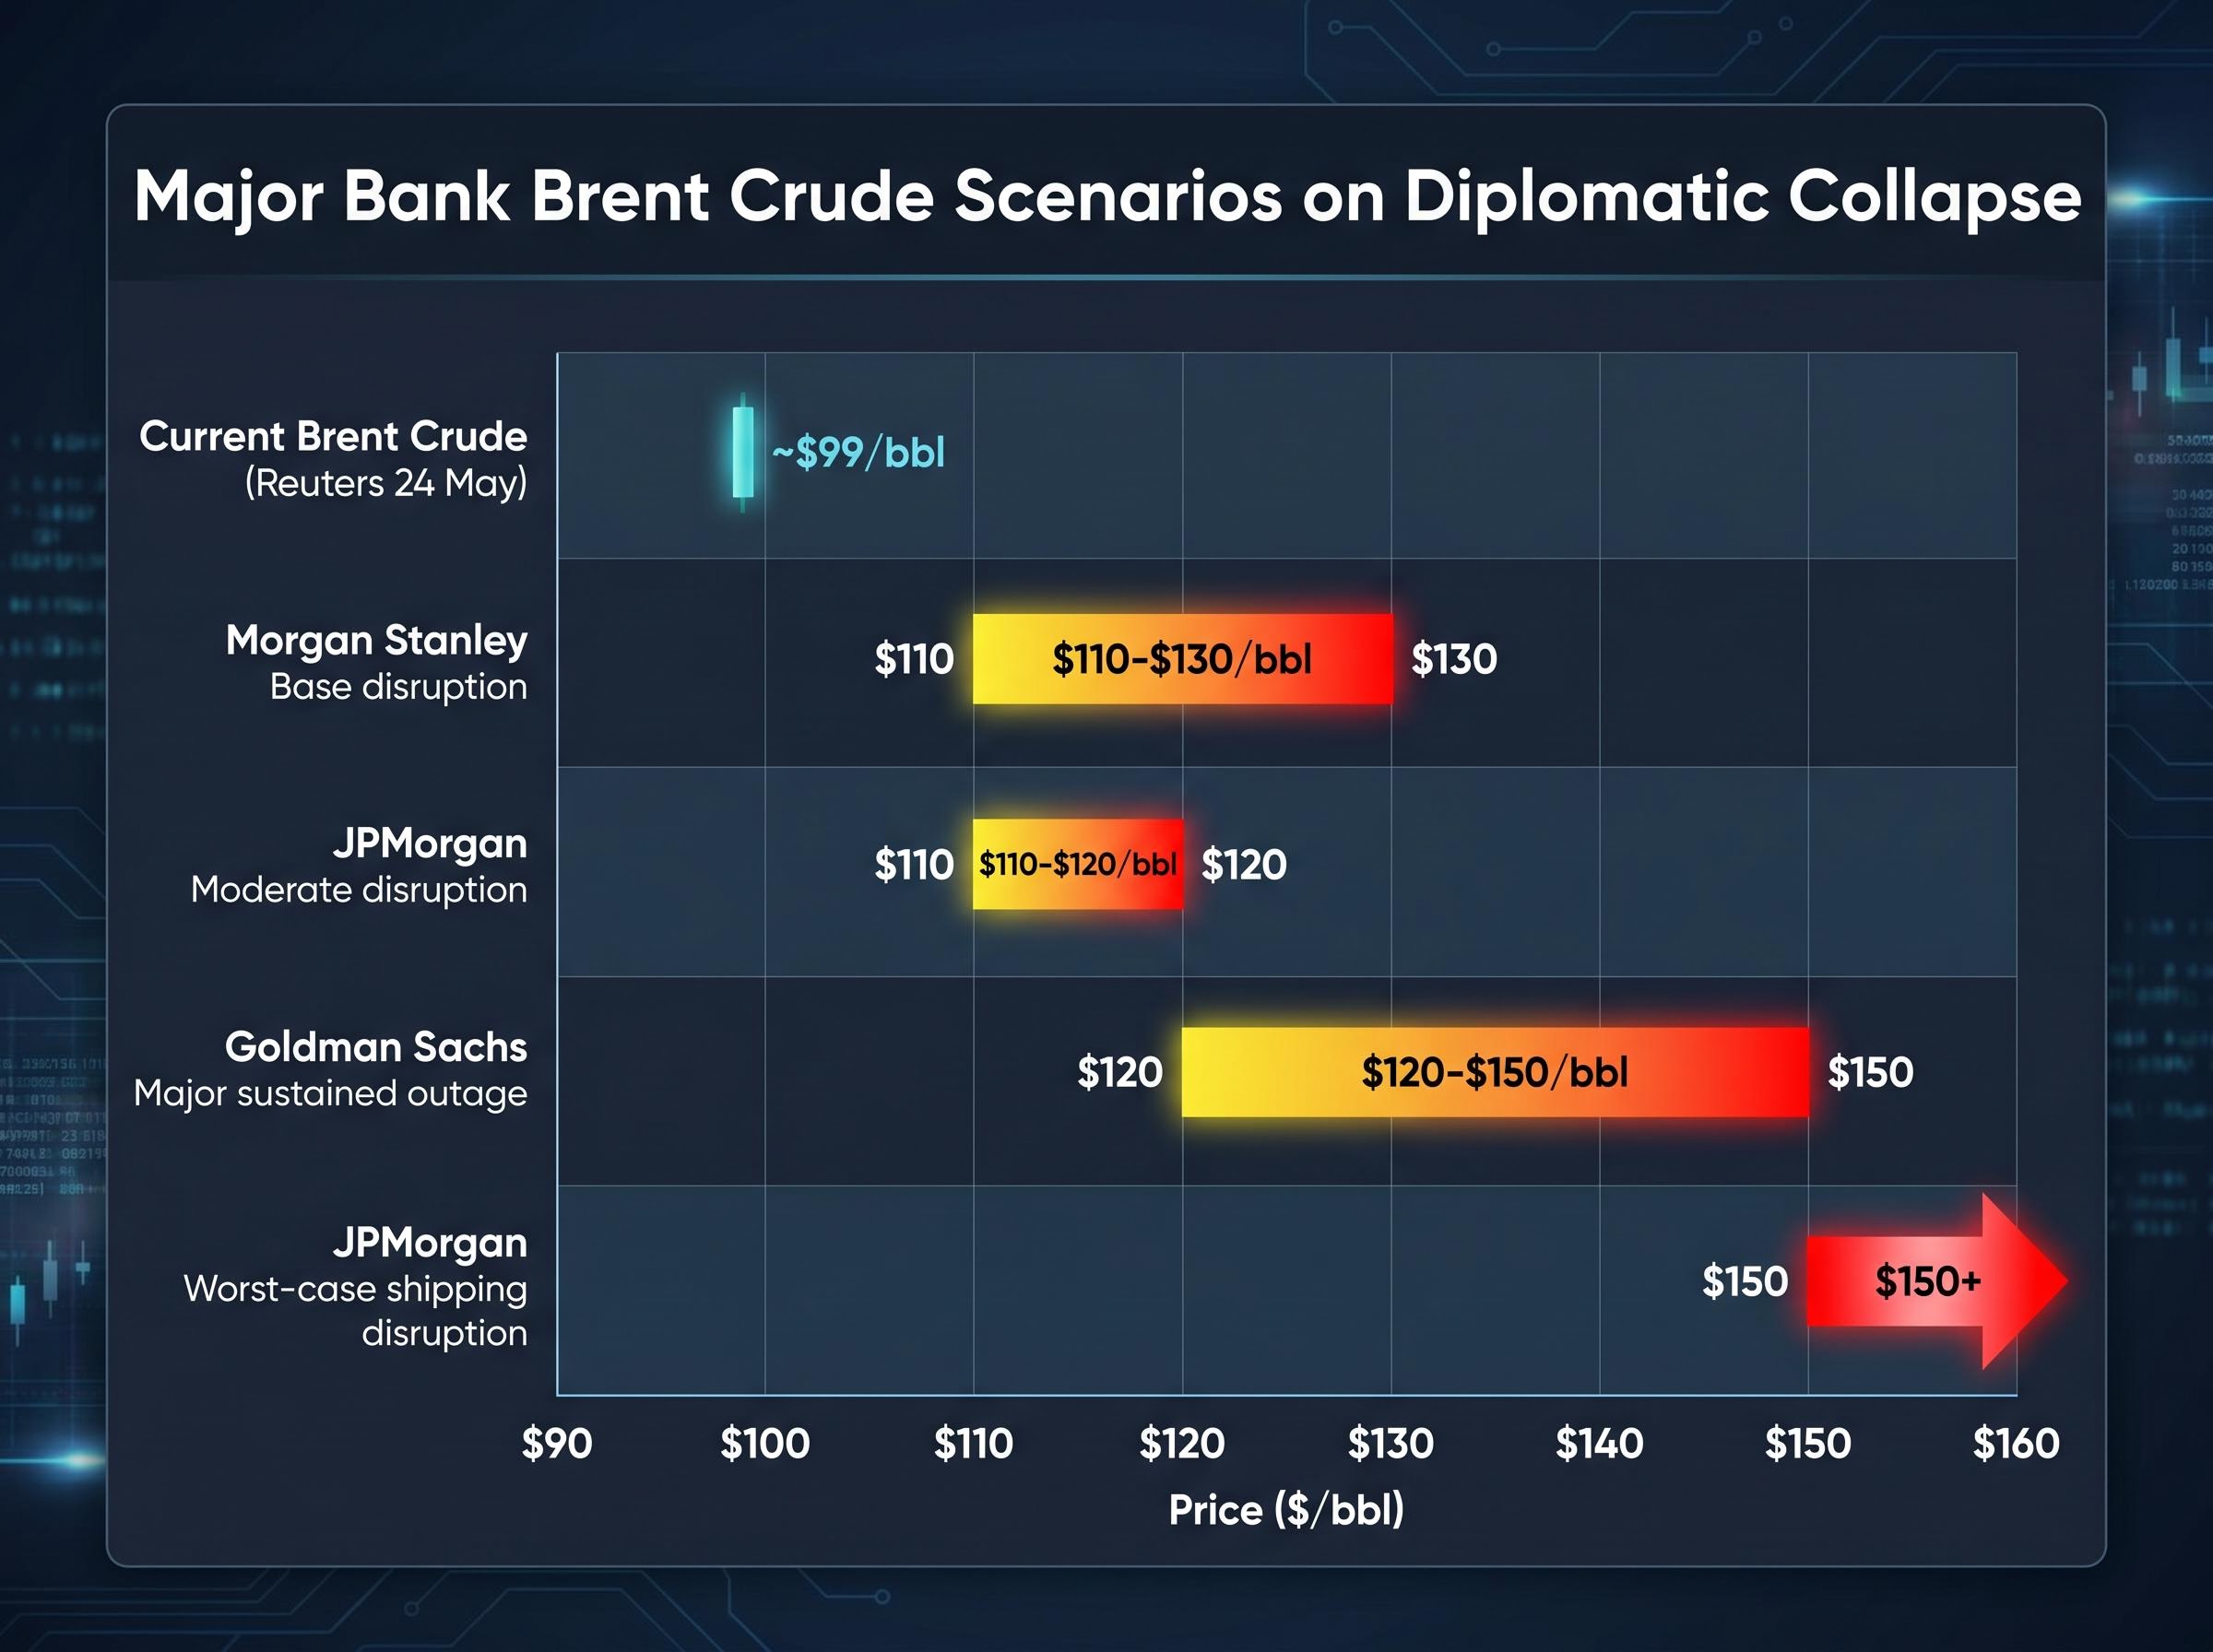
| Institution | Scenario Type | Brent Price Range | Key Condition |
|---|---|---|---|
| Goldman Sachs (Daan Struyven team) | Major sustained outage | $120-150/bbl | Limited offset from reserves |
| JPMorgan (Natasha Kaneva team) | Worst-case shipping disruption | $150/bbl+ | Physical flow interruption |
| JPMorgan (Natasha Kaneva team) | Moderate disruption | $110-120/bbl | Partial strategic stock offset |
| Morgan Stanley | Base disruption | $110-130/bbl | Front-loaded risk premium |
Oil is not just an energy commodity in this context. It is the transmission mechanism through which a geopolitical failure becomes an inflation event.
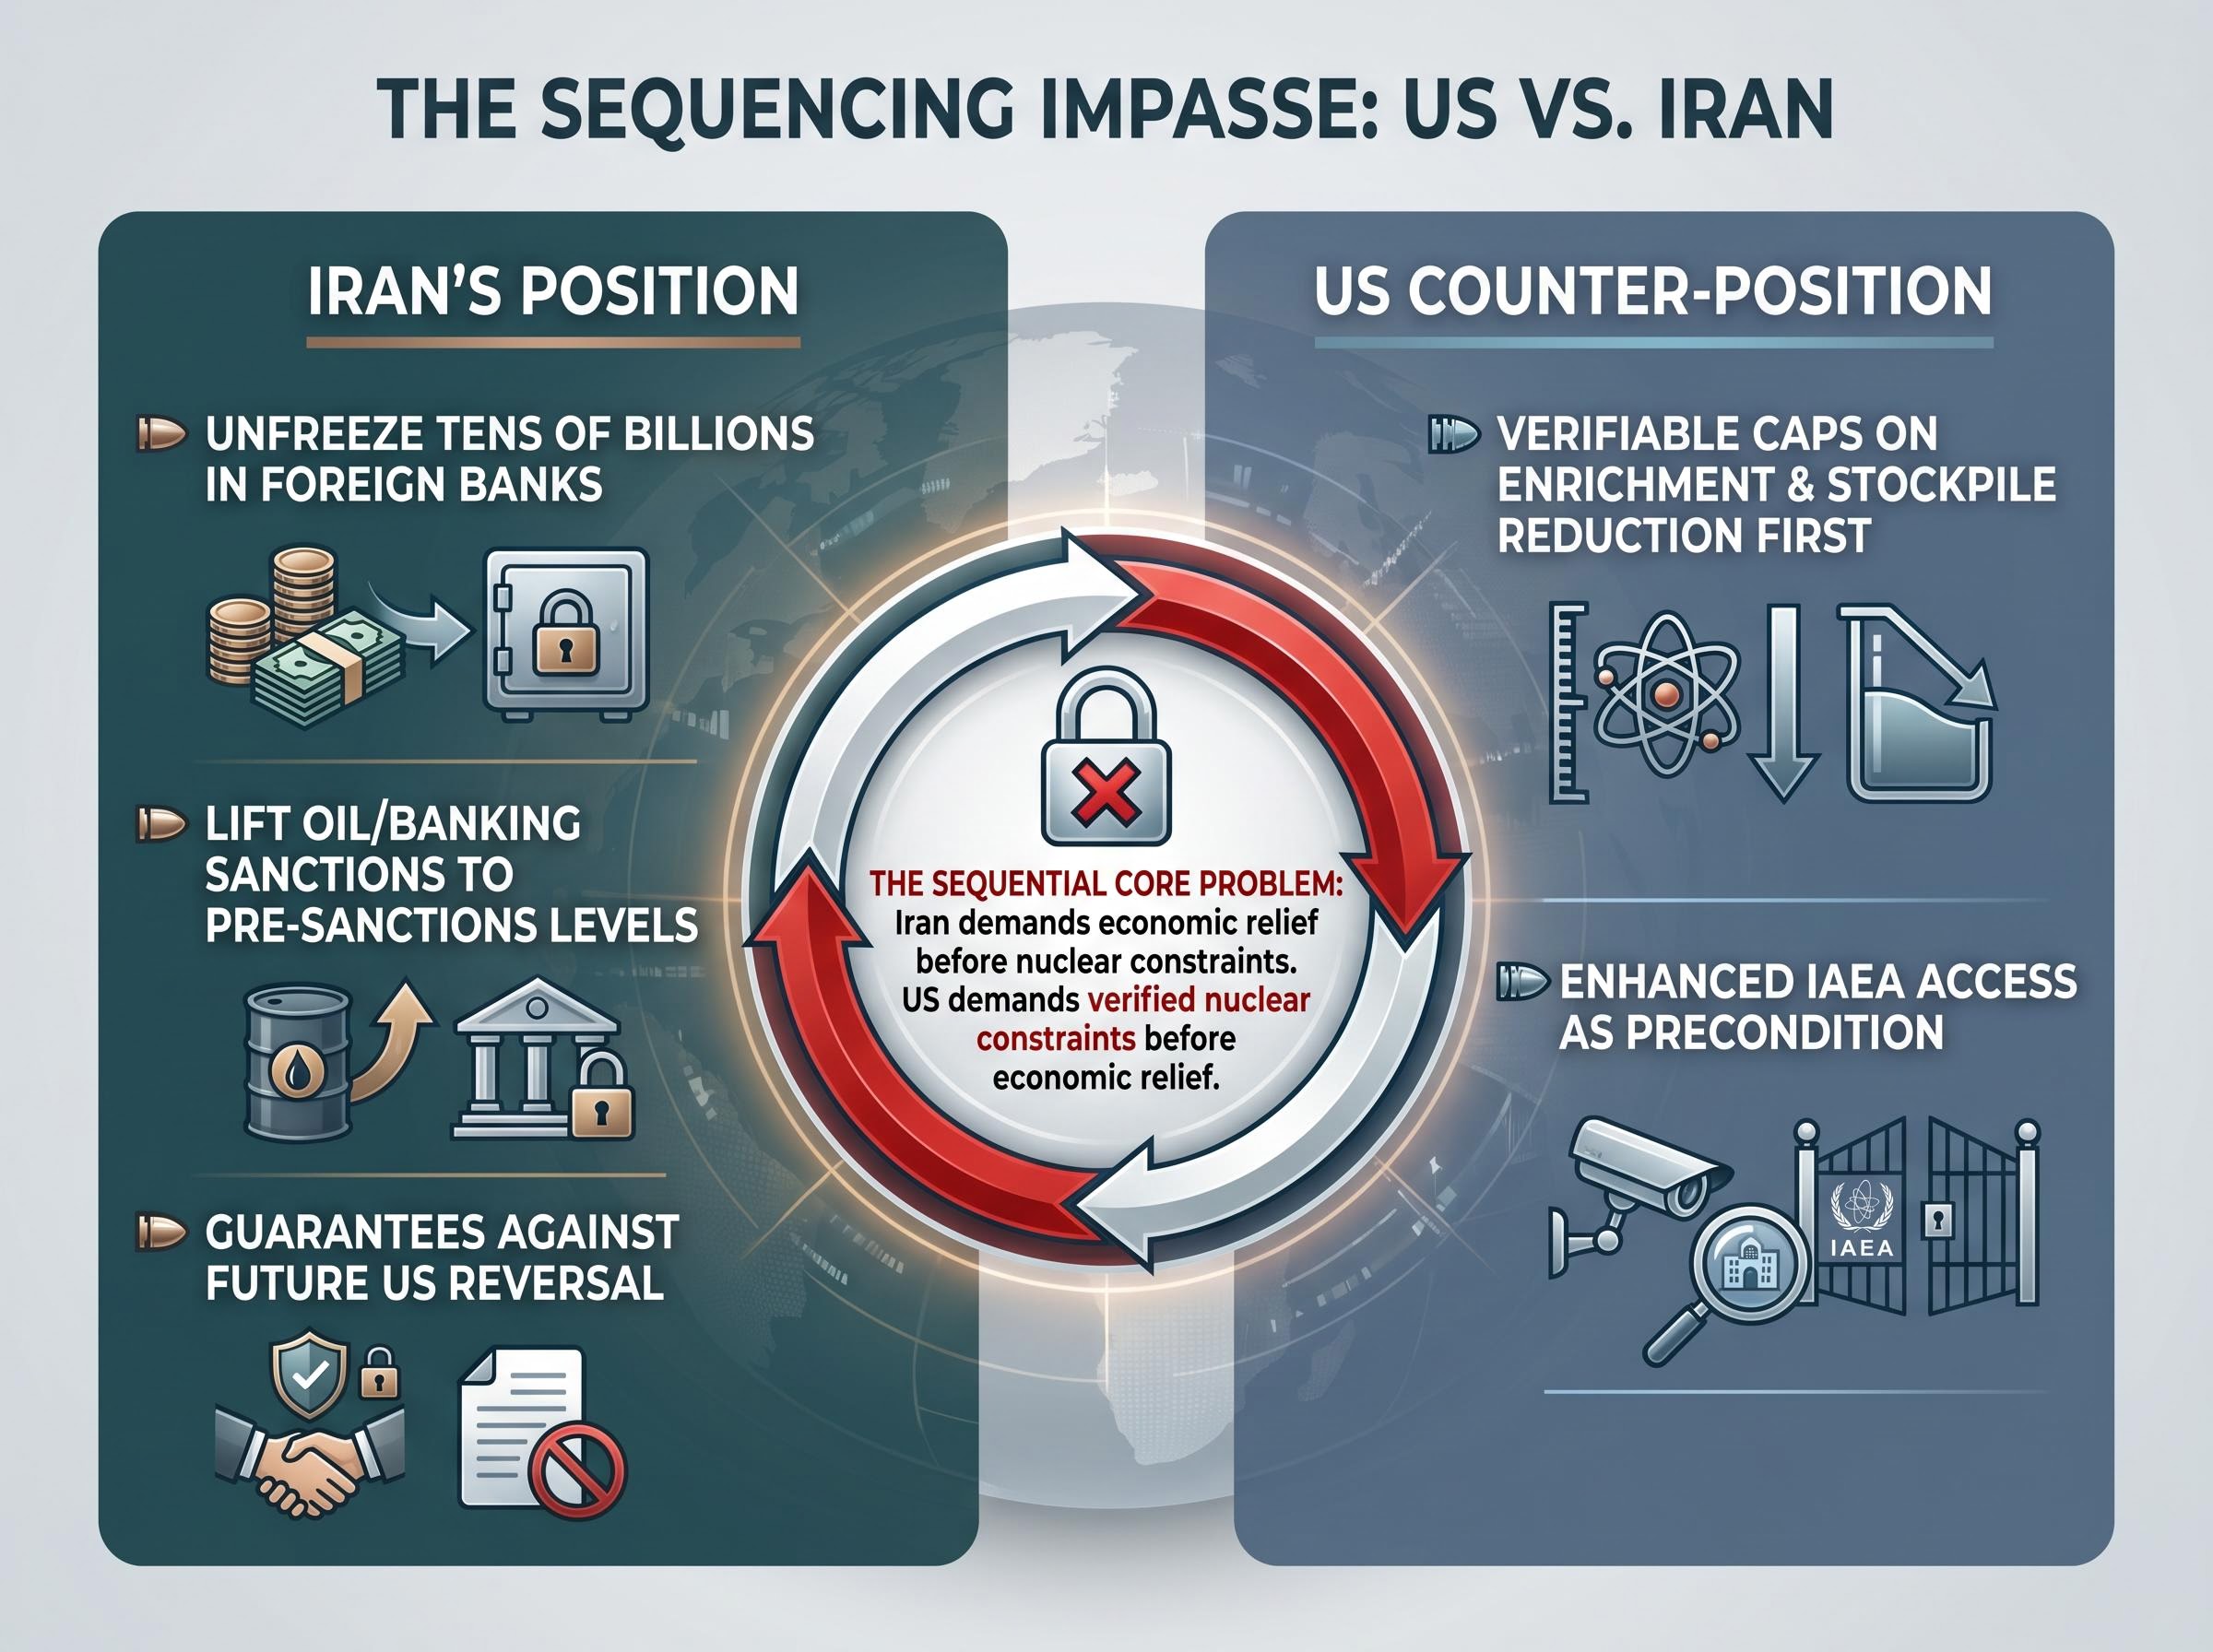
The stalemate between Washington and Tehran is not a negotiating gap that a clever diplomat can split down the middle. It is a structural deadlock with no natural compromise point, and understanding why requires examining what each side is actually demanding.
According to Reuters reporting from March-May 2026, Iran’s core demands include:
The core problem is sequential, not quantitative. Iran will not constrain its nuclear programme until it receives economic relief. The US will not provide economic relief until nuclear constraints are verified. Each side’s precondition is the other side’s concession.
The EU and E3 (France, Germany, the United Kingdom) have proposed an interim “freeze-for-freeze” arrangement: limited sanctions relief in exchange for an enrichment freeze. Tehran has not accepted it. European diplomats told Reuters and the Financial Times in 2025-2026 that the window for reviving or updating the 2015 Joint Comprehensive Plan of Action (JCPOA) is closing.
Iran’s nuclear advances since 2019 compound the difficulty further. Any new agreement would require updated technical parameters, including dealing with enrichment levels and stockpile volumes that did not exist when the original deal was struck. Investors who grasp the structural nature of this impasse can assess the probability of resolution with greater precision than those tracking headline-driven optimism alone.
IAEA verification reporting on Iran’s enrichment documents the specific stockpile volumes and enrichment levels that any new agreement would need to address, confirming that the technical baseline has shifted substantially since 2015 and that updated parameters would be required for any successor framework.
The bond market is not starting from a neutral position. The US 10-year Treasury yield has already broken above 4.5%, and the 30-year reached 5.18%, its highest since 2007. A geopolitical oil shock would land on a market that is already pricing persistent inflation and deteriorating consumer expectations.
Goldman Sachs rates strategist Praveen Korapaty and colleagues have noted that in episodes of acute Middle East escalation, the immediate reaction is typically a flight to Treasuries, pulling yields lower, particularly at the long end. Risk-off dominates the first phase.
JPMorgan strategists have argued, however, that with global inflation already elevated, a new oil-driven price shock could limit the depth and duration of any Treasury rally. The inflationary impulse and higher term premium can keep long yields from falling as much as in past crises.
The cross-asset transmission from deal optimism has already played out once at scale: on the session when President Trump described talks as entering their concluding phase, WTI fell nearly 5% to $99.08, the 30-year Treasury yield retreated from a 19-year high of 5.19%, and the Global Jets ETF surged 6.57% while the S&P 500 Energy sector fell 2.59%, providing a concrete template for what a full reversal of that move would look like.
If oil remains significantly higher, the inflationary shock takes over. Sustained high energy prices lift inflation expectations, potentially pushing nominal yields higher as central banks stay restrictive or tighten further.
The consumer sentiment data already reflects this pressure. The University of Michigan’s May 2026 final reading is worth noting:
Consumer sentiment fell to 44.8, below the consensus of 48.2 and just under the prior record low set in June 2022. One-year inflation expectations reached 4.8%, with longer-run expectations at 3.9%, up from 3.5%.
Some 57% of consumers reported elevated prices negatively affecting personal finances, up from 50% the prior month. An oil spike into the $120-150 range would accelerate a trend already in motion.
Fed funds futures are pricing more than 22 basis points of rate increases through year-end, with roughly 60% probability of a hike at the October meeting. Bond investors face a structural conflict: the safe-haven bid from a geopolitical shock competes directly with the inflationary consequences of the same shock. For equity investors, a scenario where yields do not fall, or rise further, eliminates the traditional defensive value of Treasuries as a portfolio hedge.
The positioning backdrop heading into this binary event is unusually exposed. Cash is low, equity allocations are elevated, and defensive positioning is minimal, despite widespread acknowledgment of geopolitical risk.
Three signals make the vulnerability specific:
Cash allocations at 3.9% triggered Bank of America’s contrarian sell signal, the lowest level since February 2024, at precisely the moment a binary geopolitical outcome could force a repricing.
EPFR data shows ongoing inflows into US equity funds in early-to-mid 2026, consistent with the S&P 500 trading approximately 0.3% below its record close set on 14 May. The index logged its eighth consecutive weekly advance through 23 May. Weekly performance figures tell the story: Dow Jones +2.13%, S&P 500 +0.88%, Nasdaq +0.45%, Russell 2000 +2.72%.
A market that has rallied for eight consecutive weeks on AI optimism and a tentative geopolitical peace premium is not well-positioned to absorb a binary negative outcome from the Iran talks. Low cash, high equity allocations, and compressed volatility create the conditions for a larger-than-expected drawdown if the diplomatic situation deteriorates sharply.
Historical oil shock episodes provide a sobering baseline: every prior instance of Brent crossing $100 per barrel, in 2008, 2011, and 2022, produced S&P 500 returns well below the index’s long-run average of approximately 10% over the following 12 months, a pattern that matters when positioning enters the kind of risk-on configuration currently evident in fund manager surveys.
Goldman Sachs has observed that the two-month correlation between US equities and 10-year Treasury yields has turned its most negative since the late 1990s. When equities and bonds move in the same direction, the traditional 60/40 portfolio loses its diversification benefit. In the scenario being modelled here, where an oil shock could push yields higher rather than lower, Treasuries may not provide the offset investors expect.
If Brent spikes toward $120-150, energy sector earnings revise materially higher, partially offsetting losses in rate-sensitive and growth parts of the portfolio. Goldman’s prime brokerage data indicates some increased institutional interest in energy equities as an inflation and geopolitical hedge when oil prices moved higher in recent months.
Three structural signals support this logic:
Flash PMI input costs reached their highest level since late 2022, with selling price inflation at its highest since August 2022. These cost pressures are already feeding through the corporate sector.
The caveat is important: energy equities are not a clean safe-haven. If an oil shock is large enough to trigger recession fears, energy names sell off with the broader market. The hedge is partial and imperfect. But in an environment where the traditional equity-bond diversification relationship has broken down, energy is one of the few asset classes that moves in the right direction under the scenario being analysed.
The VIX trading at 17.26 alongside year-to-date high Treasury yields and a 28% probability of a December 2026 rate hike represents a specific form of equity complacency in the face of rising yields, where volatility pricing has not yet caught up with the macro risks the rates market is already reflecting.
The oil decline at Monday’s open priced in a deal that does not yet exist. If a deal materialises, it merely confirms what current prices already reflect. If the talks collapse, the reversal carries the recent decline plus a fresh risk premium, with analyst scenarios ranging from $110 to above $150 per barrel.
Low cash allocations, high equity weightings, and eight consecutive weeks of gains mean investors are not positioned defensively for a binary negative outcome. The sequencing impasse between Washington and Tehran has no obvious halfway house, and European diplomats have suggested the window for a resolution is closing.
The question for the weeks ahead is whether that window can be kept open, or whether markets will need to reprice for the downside they have chosen, for now, to ignore.
This article is for informational purposes only and should not be considered financial advice. Investors should conduct their own research and consult with financial professionals before making investment decisions. Forward-looking statements regarding oil price scenarios and market outcomes are speculative and subject to change based on diplomatic developments, market conditions, and various risk factors.
The sequencing impasse refers to a structural deadlock where Iran demands sanctions relief and asset releases before constraining its nuclear programme, while the US insists on verifiable nuclear limits before providing any economic relief. Each side's precondition is effectively the other side's concession, leaving no natural compromise point.
A collapse would reverse the roughly 5% deal-optimism decline that pushed Brent below $100 per barrel, adding a fresh geopolitical risk premium on top of prior levels. Major bank scenario projections range from $110-120 per barrel in moderate disruption cases to above $150 per barrel in worst-case Strait of Hormuz disruption scenarios.
Bank of America's May 2026 Fund Manager Survey showed average cash allocations dropped to 3.9%, triggering a contrarian sell signal, while the S&P 500 had logged eight consecutive weekly gains with equity allocations elevated. Low cash, high equity weightings, and compressed volatility create conditions for a larger-than-expected drawdown if the diplomatic situation deteriorates.
If Brent spikes toward $120-150 per barrel, energy sector earnings revise materially higher, partially offsetting losses in rate-sensitive and growth parts of a portfolio. This hedge is especially relevant now because the negative correlation between US equities and Treasury yields has weakened the traditional 60/40 diversification benefit, making energy one of the few asset classes that rises in a disruption scenario.
A geopolitical oil shock landing on an already-stressed bond market could limit the depth of any flight-to-safety Treasury rally, as inflationary consequences and higher term premium compete with the safe-haven bid. The University of Michigan's May 2026 survey already recorded one-year inflation expectations at 4.8%, and a sustained oil spike into the $120-150 range would accelerate that trend while keeping the Federal Reserve in a restrictive stance.