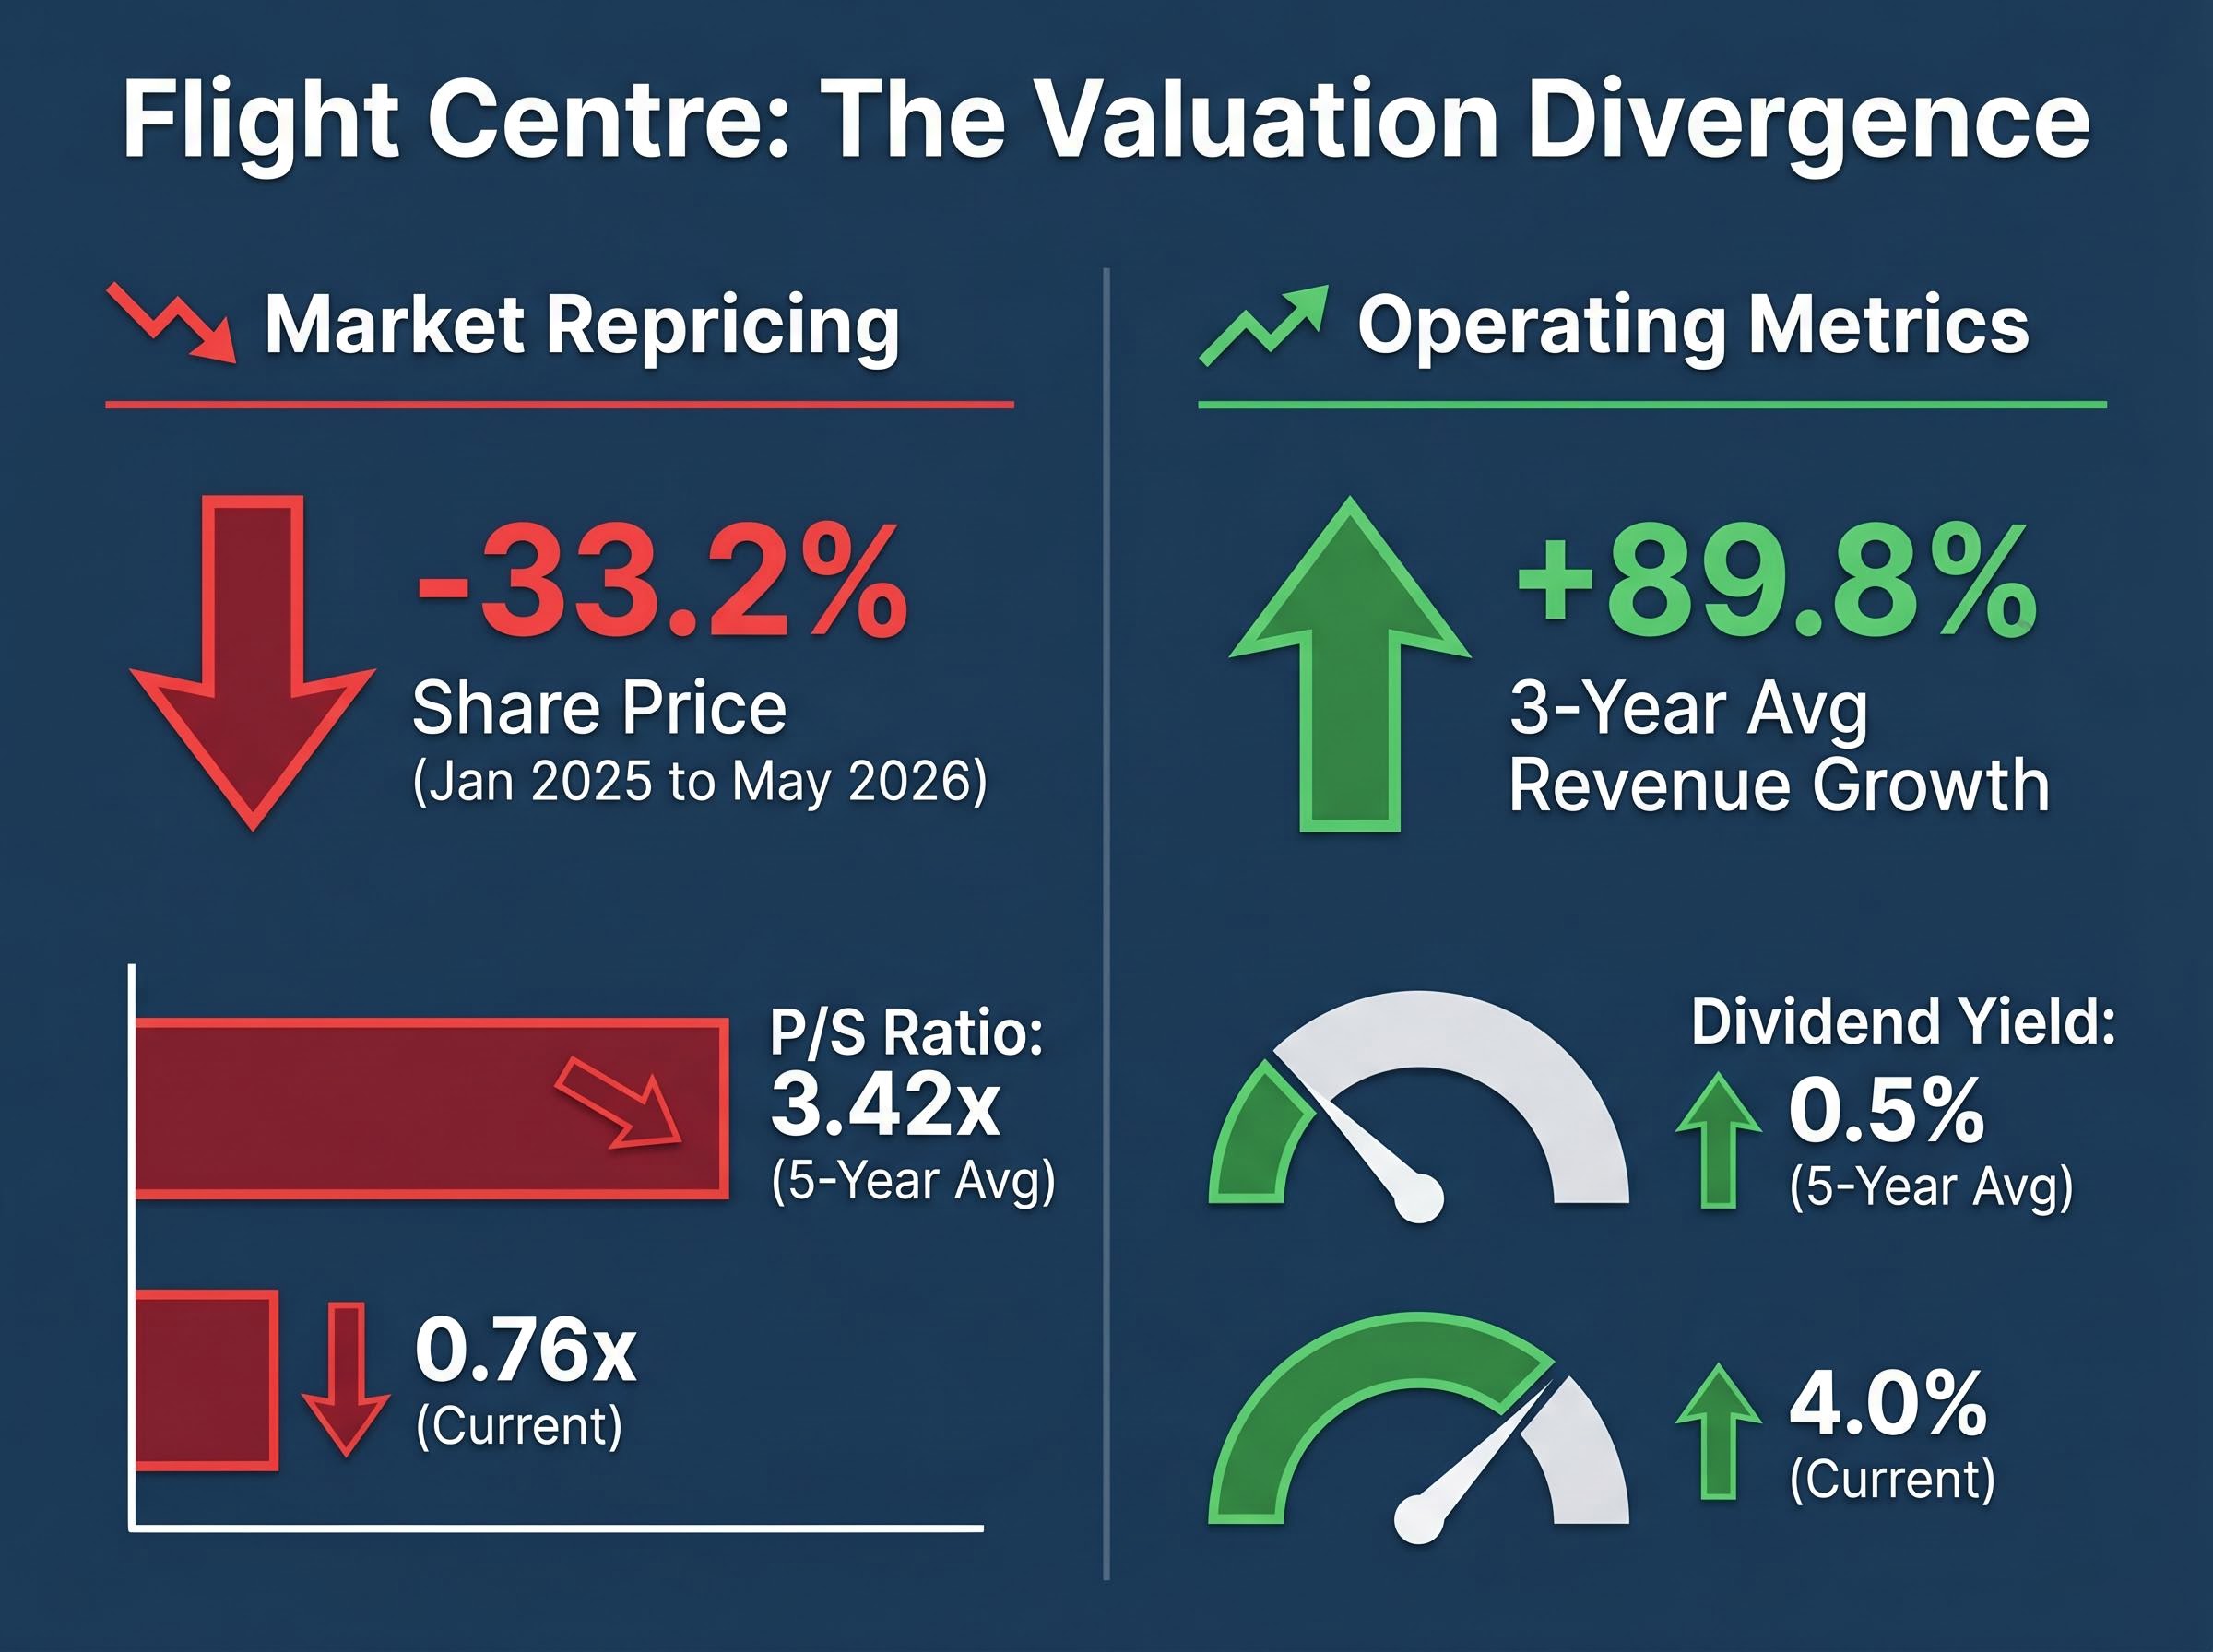
Flight Centre shares closed at A$14.40 on 23 May 2026, a price every tracked analyst considers too low. Yet the stock has shed roughly a third of its value since January 2025, falling 33.2% while the company’s three-year average annual revenue growth sits at 89.8% and its dividend yield has jumped eightfold from a five-year average of 0.5% to 4.0%. That tension, between a share price moving in one direction and operating metrics moving in the other, is the starting point for this analysis. What follows walks through the specific valuation signals driving the apparent mispricing, explains what those metrics actually measure for a travel business, and outlines the competitive and macro risks that would need to be weighed before drawing any investment conclusion.
Why FLT shares have lost a third of their value since January 2025
The decline is stark: 33.2% from January 2025 to late May 2026, leaving Flight Centre with a market capitalisation of approximately A$2.9 billion. The scale of the sell-off raises an uncomfortable question. If revenue is growing at nearly 90% per year on average, what exactly is the market pricing in?
The answer sits at least partly outside the company itself. Three overlapping forces have weighed on the stock:
The rate cycle mechanics that compress household disposable incomes operate through a distinct transmission path for consumer discretionary businesses: higher mortgage repayments reduce wallet share for non-essential spending before any deterioration in employment occurs, meaning earnings pressure arrives well ahead of the labour market signals that typically trigger broader market concern.
- The rate environment: The RBA held the cash rate at 4.35% at its 7 February 2025 meeting, confirming that monetary relief for consumer-facing businesses would be slower than many had anticipated.
- A sector-wide de-rating: The S&P/ASX 200 Consumer Discretionary Index (ASX: XDJ) returned just 0.62% annualised over the five years to May 2026, compared with 4.07% for the broader ASX 200.
- Sentiment toward cyclical travel stocks: The ABS confirmed subdued real household consumption into early 2025, placing discretionary spending categories under sustained pressure.
The XDJ’s five-year annualised return of 0.62% versus the ASX 200’s 4.07% highlights that FLT’s underperformance reflects a broader consumer discretionary de-rating, not a company-specific collapse.
Whether the recovery thesis rests on a macro turn or a company-specific catalyst matters. For FLT, the evidence points largely toward the former.
When big ASX news breaks, our subscribers know first
What Flight Centre’s revenue growth actually looks like beneath the sell-off
The headline number is hard to ignore: 89.8% average annual revenue growth over three years, delivered through a period of elevated interest rates and constrained consumer spending. That figure directly contradicts the sector’s perceived sensitivity to borrowing costs.
The H1 FY25 trading update, released on 20 February 2025, confirmed underlying profit before tax was tracking ahead of the prior corresponding period, with both leisure and corporate segments contributing. Corporate travel transaction values had already surpassed pre-COVID levels as of the FY24 results released on 28 August 2024.
The nine months to March 2026 produced record total transaction value of $19.5 billion alongside 23% corporate profit growth, with the corporate division delivering that earnings expansion on TTV growth of only 4%, a combination that points to genuine operating leverage rather than revenue inflation.
What does revenue actually measure for a travel agency?
Before interpreting FLT’s price-to-sales ratio, readers need to understand what “revenue” means for a business that intermediates travel rather than producing a physical product:
- Total transaction value (TTV): The full dollar value of flights, hotels, and packages booked through FLT’s platforms. This flows through the company’s books but is not all retained.
- Reported revenue: Primarily commissions, fees, and service charges earned on those bookings. This is the figure used in valuation ratios.
- Underlying profit: What remains after operating costs are deducted from reported revenue.
This distinction matters. FLT’s price-to-sales ratio will always appear lower than that of a retailer where revenue equals the full sale price. Comparing P/S across different business models without adjusting for this difference can mislead.
Understanding the price-to-sales compression and what it signals
Flight Centre’s current price-to-sales ratio sits at 0.76x. The five-year average is 3.42x. The current multiple is less than a quarter of the historical norm.
Two forces can compress a P/S ratio: a falling share price or rising sales. In FLT’s case, both have contributed, but the price decline has played the dominant role. Revenue has grown rapidly; the market has repriced the stock downward faster.
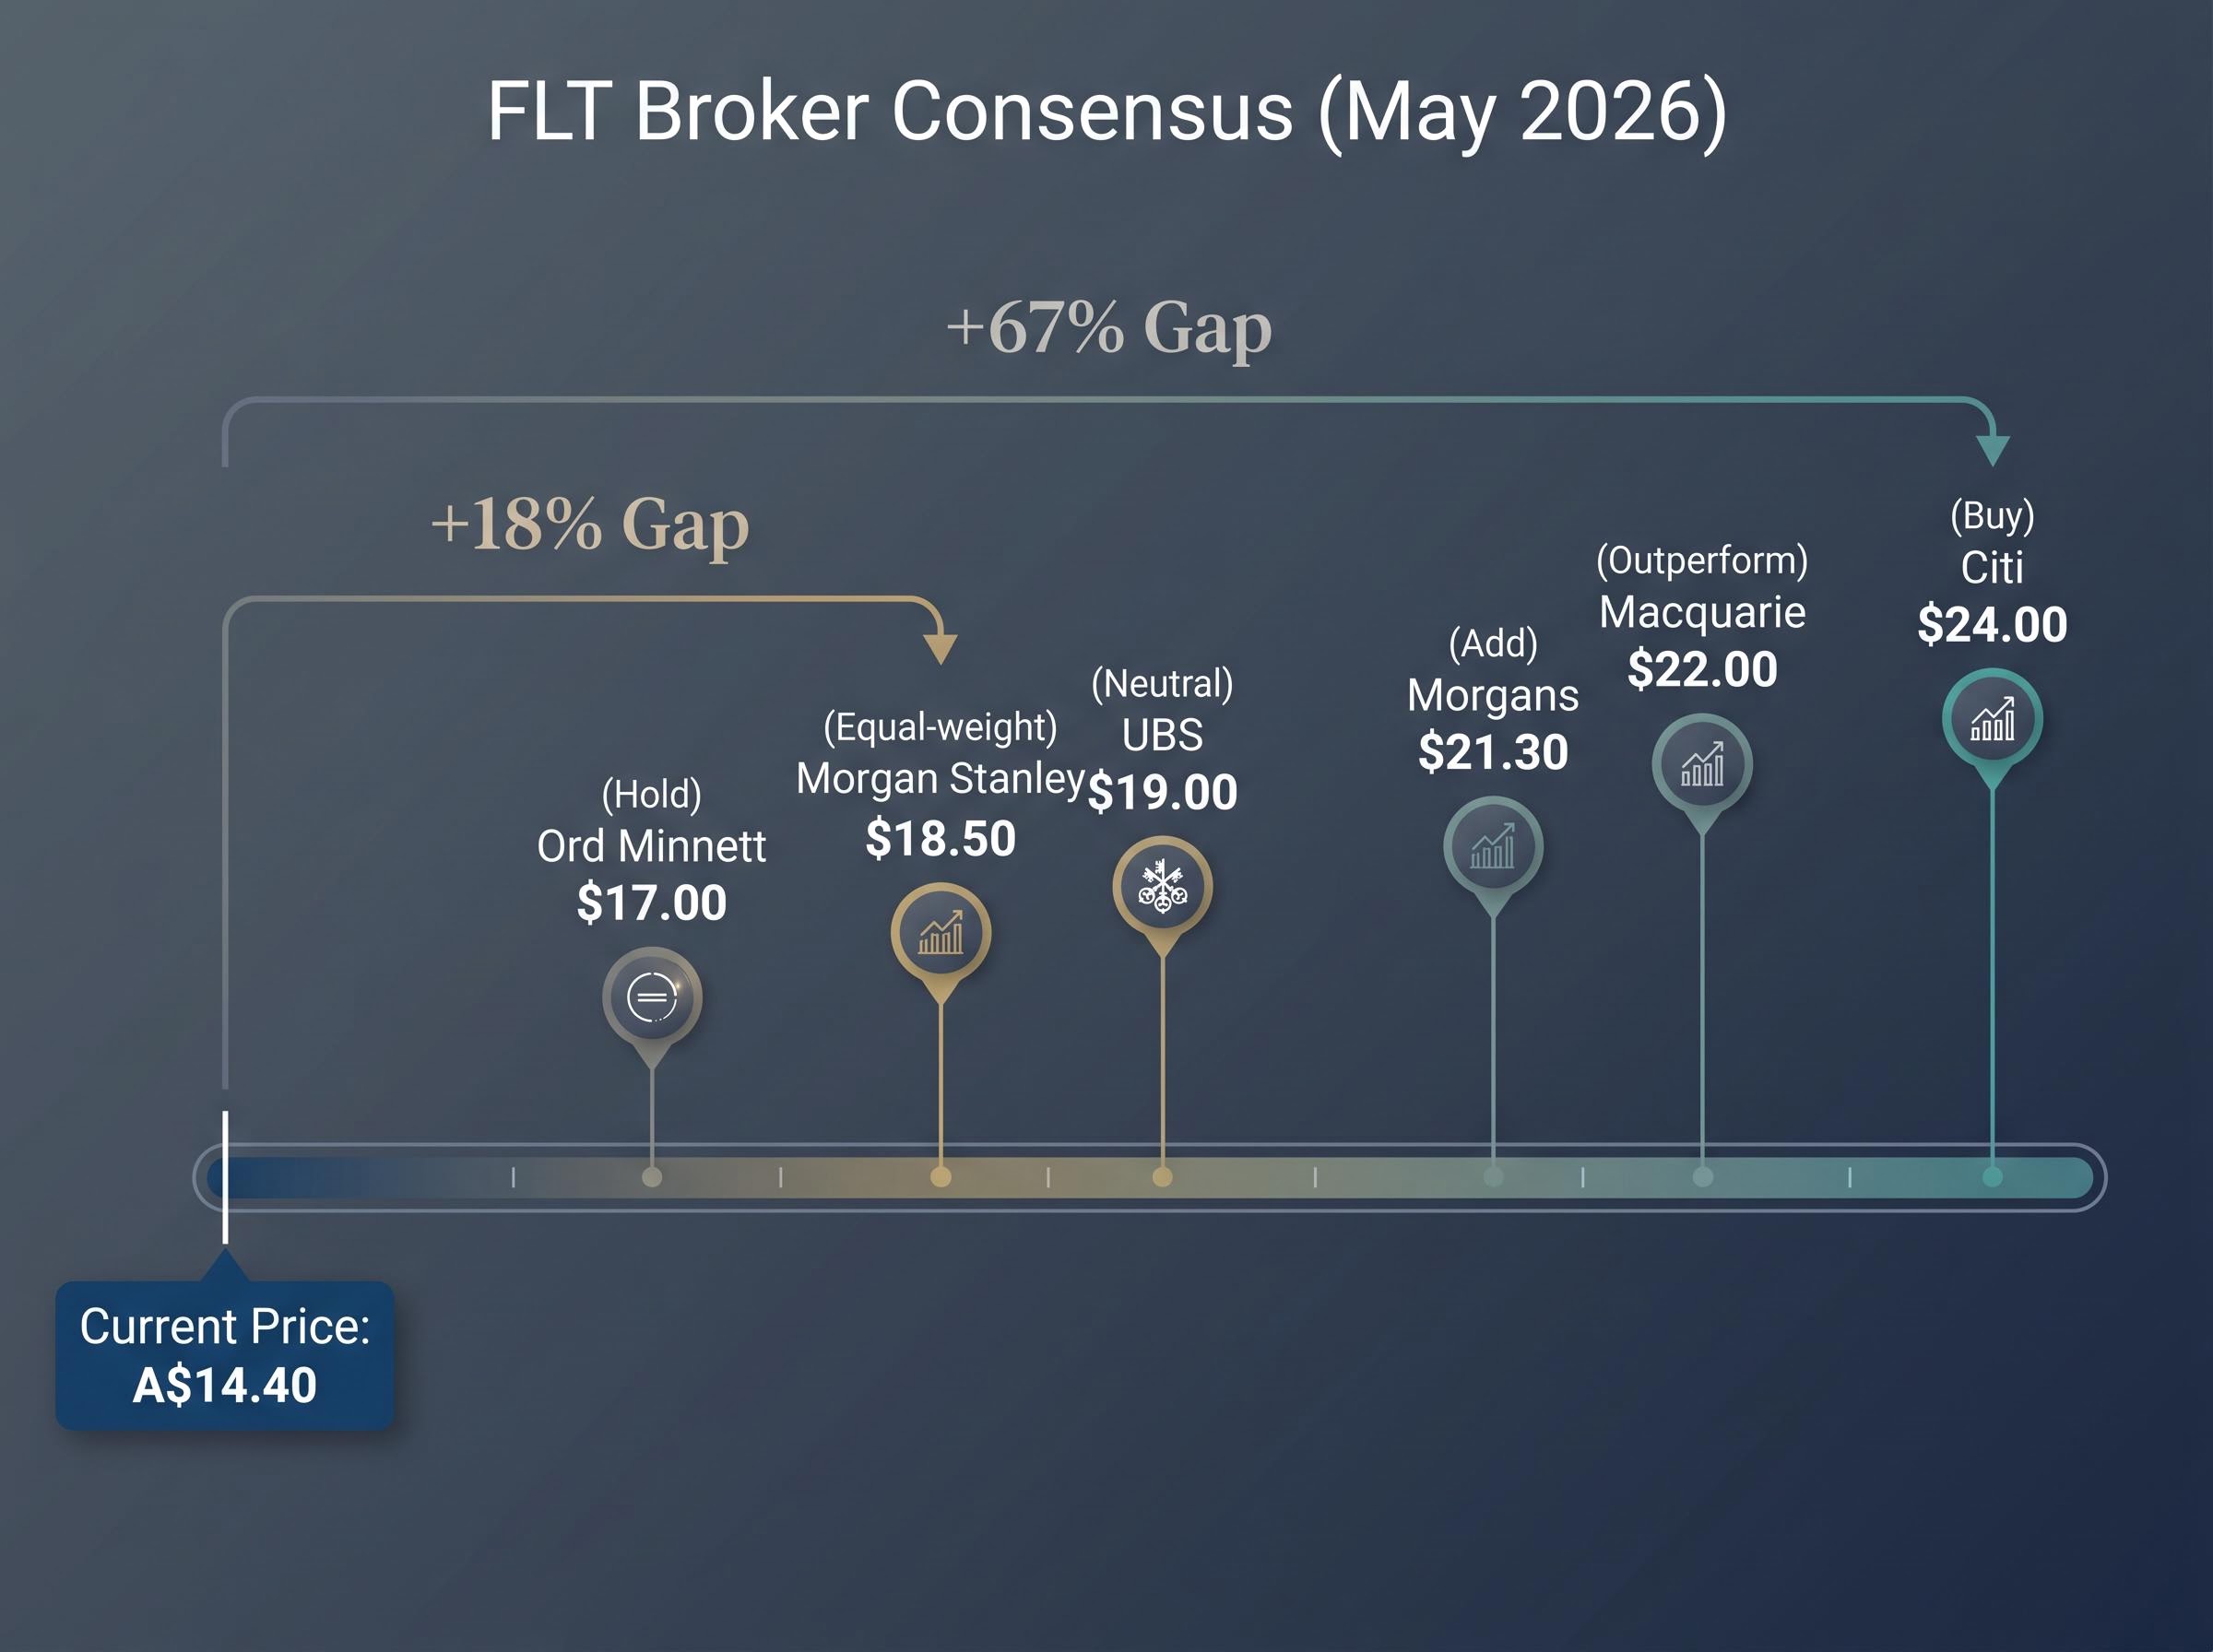
The broker community provides one frame for what professional investors believe fair value looks like. Every tracked analyst has a 12-month target above A$14.40.
| Broker | Rating | 12-Month Target (A$) |
|---|---|---|
| Citi | Buy | $24.00 |
| Macquarie | Outperform | $22.00 |
| Morgans | Add | $21.30 |
| UBS | Neutral | $19.00 |
| Morgan Stanley | Equal-weight | $18.50 |
| Ord Minnett | Hold | $17.00 |
Shaw and Partners noted in February 2026 that FLT’s valuation “embeds a mild recession scenario,” trading at a discount to Corporate Travel Management (ASX: CTD) on EV/EBITDA and at a substantial discount to its own historical price-to-sales average.
The gap between the current price and the lowest broker target (A$17.00, Ord Minnett) is 18%. The gap to the highest (A$24.00, Citi) is 67%. Whether that gap represents an opportunity depends entirely on what happens to the earnings base that underpins these targets.
The dividend yield signal and what it tells income investors
FLT’s dividend yield has risen to approximately 4.0%, up from a five-year average of 0.5%. That eightfold increase reflects both the lower share price and the company’s return to regular dividend payments following the COVID-era suspension.
CommSec analysts described FLT in March 2026 as “one of the better-yielding names in a sector traditionally light on income.”
Management reinforced the income thesis at the FY24 results on 28 August 2024, emphasising “disciplined capital allocation” and positioning the return to regular dividends as a strategic priority.
FLT’s FY24 results confirmed corporate travel TTV reached a record AU$12.1 billion, sitting 35 percent above FY19 pre-COVID levels, providing the earnings foundation that underpins management’s commitment to a regular dividend programme.
The yield warrants interrogation, not just celebration. A yield this far above its historical norm can signal genuine value creation or it can flag the market’s doubt about sustainability.
Signals in favour of the yield thesis:
- Corporate revenue has surpassed pre-COVID levels, supporting cash generation
- Management has explicitly committed to a regular dividend programme
- The yield compares favourably to most ASX consumer discretionary peers
Signals that warrant caution:
- Travel company dividends are directly tied to earnings cyclicality
- Ord Minnett explicitly warned against extrapolating post-COVID growth rates
- A macro deterioration could compress earnings quickly, putting the payout under pressure
For income-oriented investors, holding both sides of this equation simultaneously is the honest analytical position.
The risks that explain why the market has not already closed the valuation gap
If the valuation metrics look this compelling, a fair question follows: why have sophisticated investors not simply bought the gap shut? Three principal risk categories provide the answer:
- Corporate travel competition from CTD: Corporate Travel Management upgraded its FY25 underlying EBITDA guidance on 19 February 2025, citing strength in North American and European markets. CTD is directly targeting FLT’s highest-margin segment.
- Leisure segment structural shift to online platforms: Webjet reported continued B2C growth at its FY results on 15 May 2025. The AFR reported in September 2025 that Booking.com and Expedia increased Australian marketing spend through the year, intensifying pressure on FLT’s leisure business.
- Macro sensitivity and incomplete margin recovery: Morgan Stanley (Equal-weight, A$18.50) flags execution risk on FLT’s structural cost-out and online transition. UBS (Neutral, A$19.00) notes margins remain below pre-COVID levels.
CTD’s remediation timeline and planned ASX reinstatement in Q2 2026 add a layer of uncertainty to competitive forecasts: a company returning to full market visibility after a compliance-driven trading suspension may attract institutional attention that was previously withheld, potentially affecting how capital flows between the two dominant ASX corporate travel operators.
Where corporate travel competition is most acute
The mid-market SME corporate segment is the specific battleground. Both FCM and Corporate Traveller compete directly with CTD’s expanded North American and European operations for the same client base.
FLT’s management emphasised high customer retention and new account wins in FCM at the H1 FY25 update. CTD’s guidance upgrade represents the competing data point. Both claims cannot be fully reconciled from the outside; the competitive outcome will become clearer over coming reporting periods.
One metric is never enough: how to think about FLT’s investment case properly
Price-to-sales is a useful but incomplete signal. It measures revenue against market capitalisation but says nothing about margin quality, capital structure, or whether the revenue base is defensible. For a cyclical business, these omissions are material.
More comprehensive valuation methods, such as discounted cash flow and dividend discount models, force the analyst to make explicit assumptions about future earnings and discount rates rather than simply extrapolating history. The discipline of stating those assumptions is where the analytical value sits.
The analyst community’s overall posture is instructive: two Buy/Add ratings, one Outperform, two Neutral/Hold, and one Equal-weight. All six have targets above A$14.40. That unanimity on direction, paired with wide dispersion on magnitude (A$17.00 to A$24.00), reflects genuine uncertainty about the assumptions.
Nathan Bell of Intelligent Investor characterised FLT in October 2025 as “cheap on cyclical metrics but structurally more competitive than a decade ago,” concluding the stock “suits contrarian, long-term investors but not conservative income seekers.”
Investor framing: Nathan Bell, Intelligent Investor, described FLT as suitable for “contrarian, long-term investors but not conservative income seekers,” a characterisation that captures the risk profile embedded in the current valuation.
Before acting on any single valuation metric, an investor should be able to answer four questions:
- Is the revenue base sustainable, or is it still inflated by post-COVID normalisation?
- Are margins expanding toward pre-COVID levels, or have they plateaued?
- What does the dividend require from earnings, and how much buffer exists?
- What macro assumptions (rate cuts, consumer spending recovery) are embedded in the current price?
The FLT setup in May 2026: what the numbers say and what they cannot tell you
The core tension is quantifiable. A 0.76x P/S ratio against a 3.42x five-year average. A 4.0% dividend yield against a 0.5% historical average. A 33.2% price decline against 89.8% average annual revenue growth. All occurring simultaneously in a sector that has broadly underperformed the ASX 200.
FLT’s valuation metrics point in one direction; its competitive and macro risks point in another. The gap between them is where investment judgement begins.
Every tracked analyst has a price target materially above the current A$14.40 share price. Morningstar’s Johannes Faul argued in August 2025 that the market is “undervaluing long-term earnings power of corporate brands.” James Thomson wrote in the AFR’s Chanticleer column in March 2025 that the scale of the sell-off “looks excessive if earnings hold anywhere near current run-rate.”
Those targets are not guarantees. They are built on macro assumptions that could prove wrong if rate relief is slower than expected or if CTD captures a larger share of the corporate travel segment than FLT’s retention data implies.
The most useful next step for any ASX investor assessing this stock is to stress-test the earnings assumptions embedded in any valuation model before drawing a conclusion, and to consider where FLT sits in the context of broader portfolio exposure to Australian consumer discretionary.
For investors wanting to stress-test the macro assumptions embedded in any FLT valuation model, our full explainer on Australia’s recession risk signals examines the per capita GDP gap, the Strait of Hormuz fuel shock’s inflationary impact, and the corporate insolvency data that suggest aggregate output figures are masking household and business conditions that are materially weaker than the headline rate implies.
This article is for informational purposes only and should not be considered financial advice. Investors should conduct their own research and consult with financial professionals before making investment decisions. Past performance does not guarantee future results. Financial projections are subject to market conditions and various risk factors.