Gold fell sharply on Tuesday, losing between 2.1% and almost 3% depending on the source, after a hotter-than-expected October consumer price report and hawkish remarks from Federal Reserve officials pushed the gold price back toward the $4,000 mark.
The sell-off reset expectations for the Fed’s December meeting. Markets are now pricing a rate hike as the base case and seriously weighing a larger one.
The next few sessions will test whether this is a pullback inside a long rally or the start of something deeper.
This report covers what triggered the drop, why different outlets quoted different prices, the levels traders are watching and the dated data that could move gold before the week is out.
Why the CPI surprise hit gold so hard, and why the numbers differ by source
The trigger was a one-tenth miss. The US Bureau of Labor Statistics (BLS) reported that the consumer price index (CPI), which tracks changes in what households pay for goods and services, rose more than economists expected in October.
| Measure | October result | Consensus | September |
|---|---|---|---|
| Headline CPI, month on month | +0.4% | +0.3% | +0.6% |
| Core CPI, month on month | +0.3% | +0.2% | +0.3% |
Core CPI strips out volatile food and energy prices. October marked its third straight 0.3% reading, a sign that underlying inflation is not cooling. The BLS did not publish a year-on-year figure, because the earlier government shutdown left no October 2025 comparison base; Reuters cited economists’ reconstructed estimates of about 3.9%-4.0%, which are unofficial.
Gold moved almost instantly. According to Barchart, it slid from roughly $4,080 to $4,046.40 within about a minute of the release and comments from Fed Governor Christopher Waller.
Reported closing points vary, but they describe the same fall measured at different moments and on different instruments:
- CNBC: spot gold down 2.1% to $4,051.50; December futures down 1.3% to $4,059.30
- AP: spot gold down 2.3% to $4,043.73
- FXStreet: spot down almost 3%, near $4,021, likely a later and lower point in the session
FXStreet measured its decline from Monday’s high near $4,148, not from a confirmed CPI-day peak.
For you, the size of the reaction is the message. Markets treated a single tenth of a percentage point as proof that inflation is sticky, which means small data surprises can carry outsized weight right now.
When big ASX news breaks, our subscribers know first
How Waller, Logan and the bond market turned one print into a December hike bet
The CPI number mattered because Fed officials had already told markets what it would take to move faster. Waller said he leaned toward a normal 25 basis point December hike if inflation improved, but that core CPI around 0.3% or higher would justify considering 50 basis points. A basis point is one hundredth of a percentage point.
Core came in at exactly 0.3%. The threshold was met.
Christopher Waller, Federal Reserve Governor “Hiking only 25 basis points would put our credibility at risk.” (Axios)
What Logan’s comments add
Dallas Fed President Lorie Logan went further. She said the Fed needs at least another 50 basis points of tightening, apparently through two quarter-point moves, before pausing, and that faster hikes might be needed this winter.
Logan argued the current fed funds range of 3.75%-4.00% is too low and is adding to inflation, leaving policy about 50 basis points short of “modestly restrictive”.
Logan’s call for more tightening fits the Fed’s inflation-first rate strategy adopted in September, when officials ranked price stability above employment risks after the first hike since 2023.
From there, the repricing ran link by link:
- CPI beat: headline and core both topped forecasts by 0.1 percentage point.
- Hike odds: CME FedWatch showed about 84.7% for a 25 basis point December hike and 15.3% for 50, with other reports at roughly 10%-14% for the larger move depending on timing.
- Yields and the dollar: the 10-year Treasury yield rose about 12 basis points to 5.012%, per FXStreet, and the US Dollar Index (DXY) gained nearly 0.70% to around 102.36.
- Gold: with yields and the dollar climbing, bullion sold off.
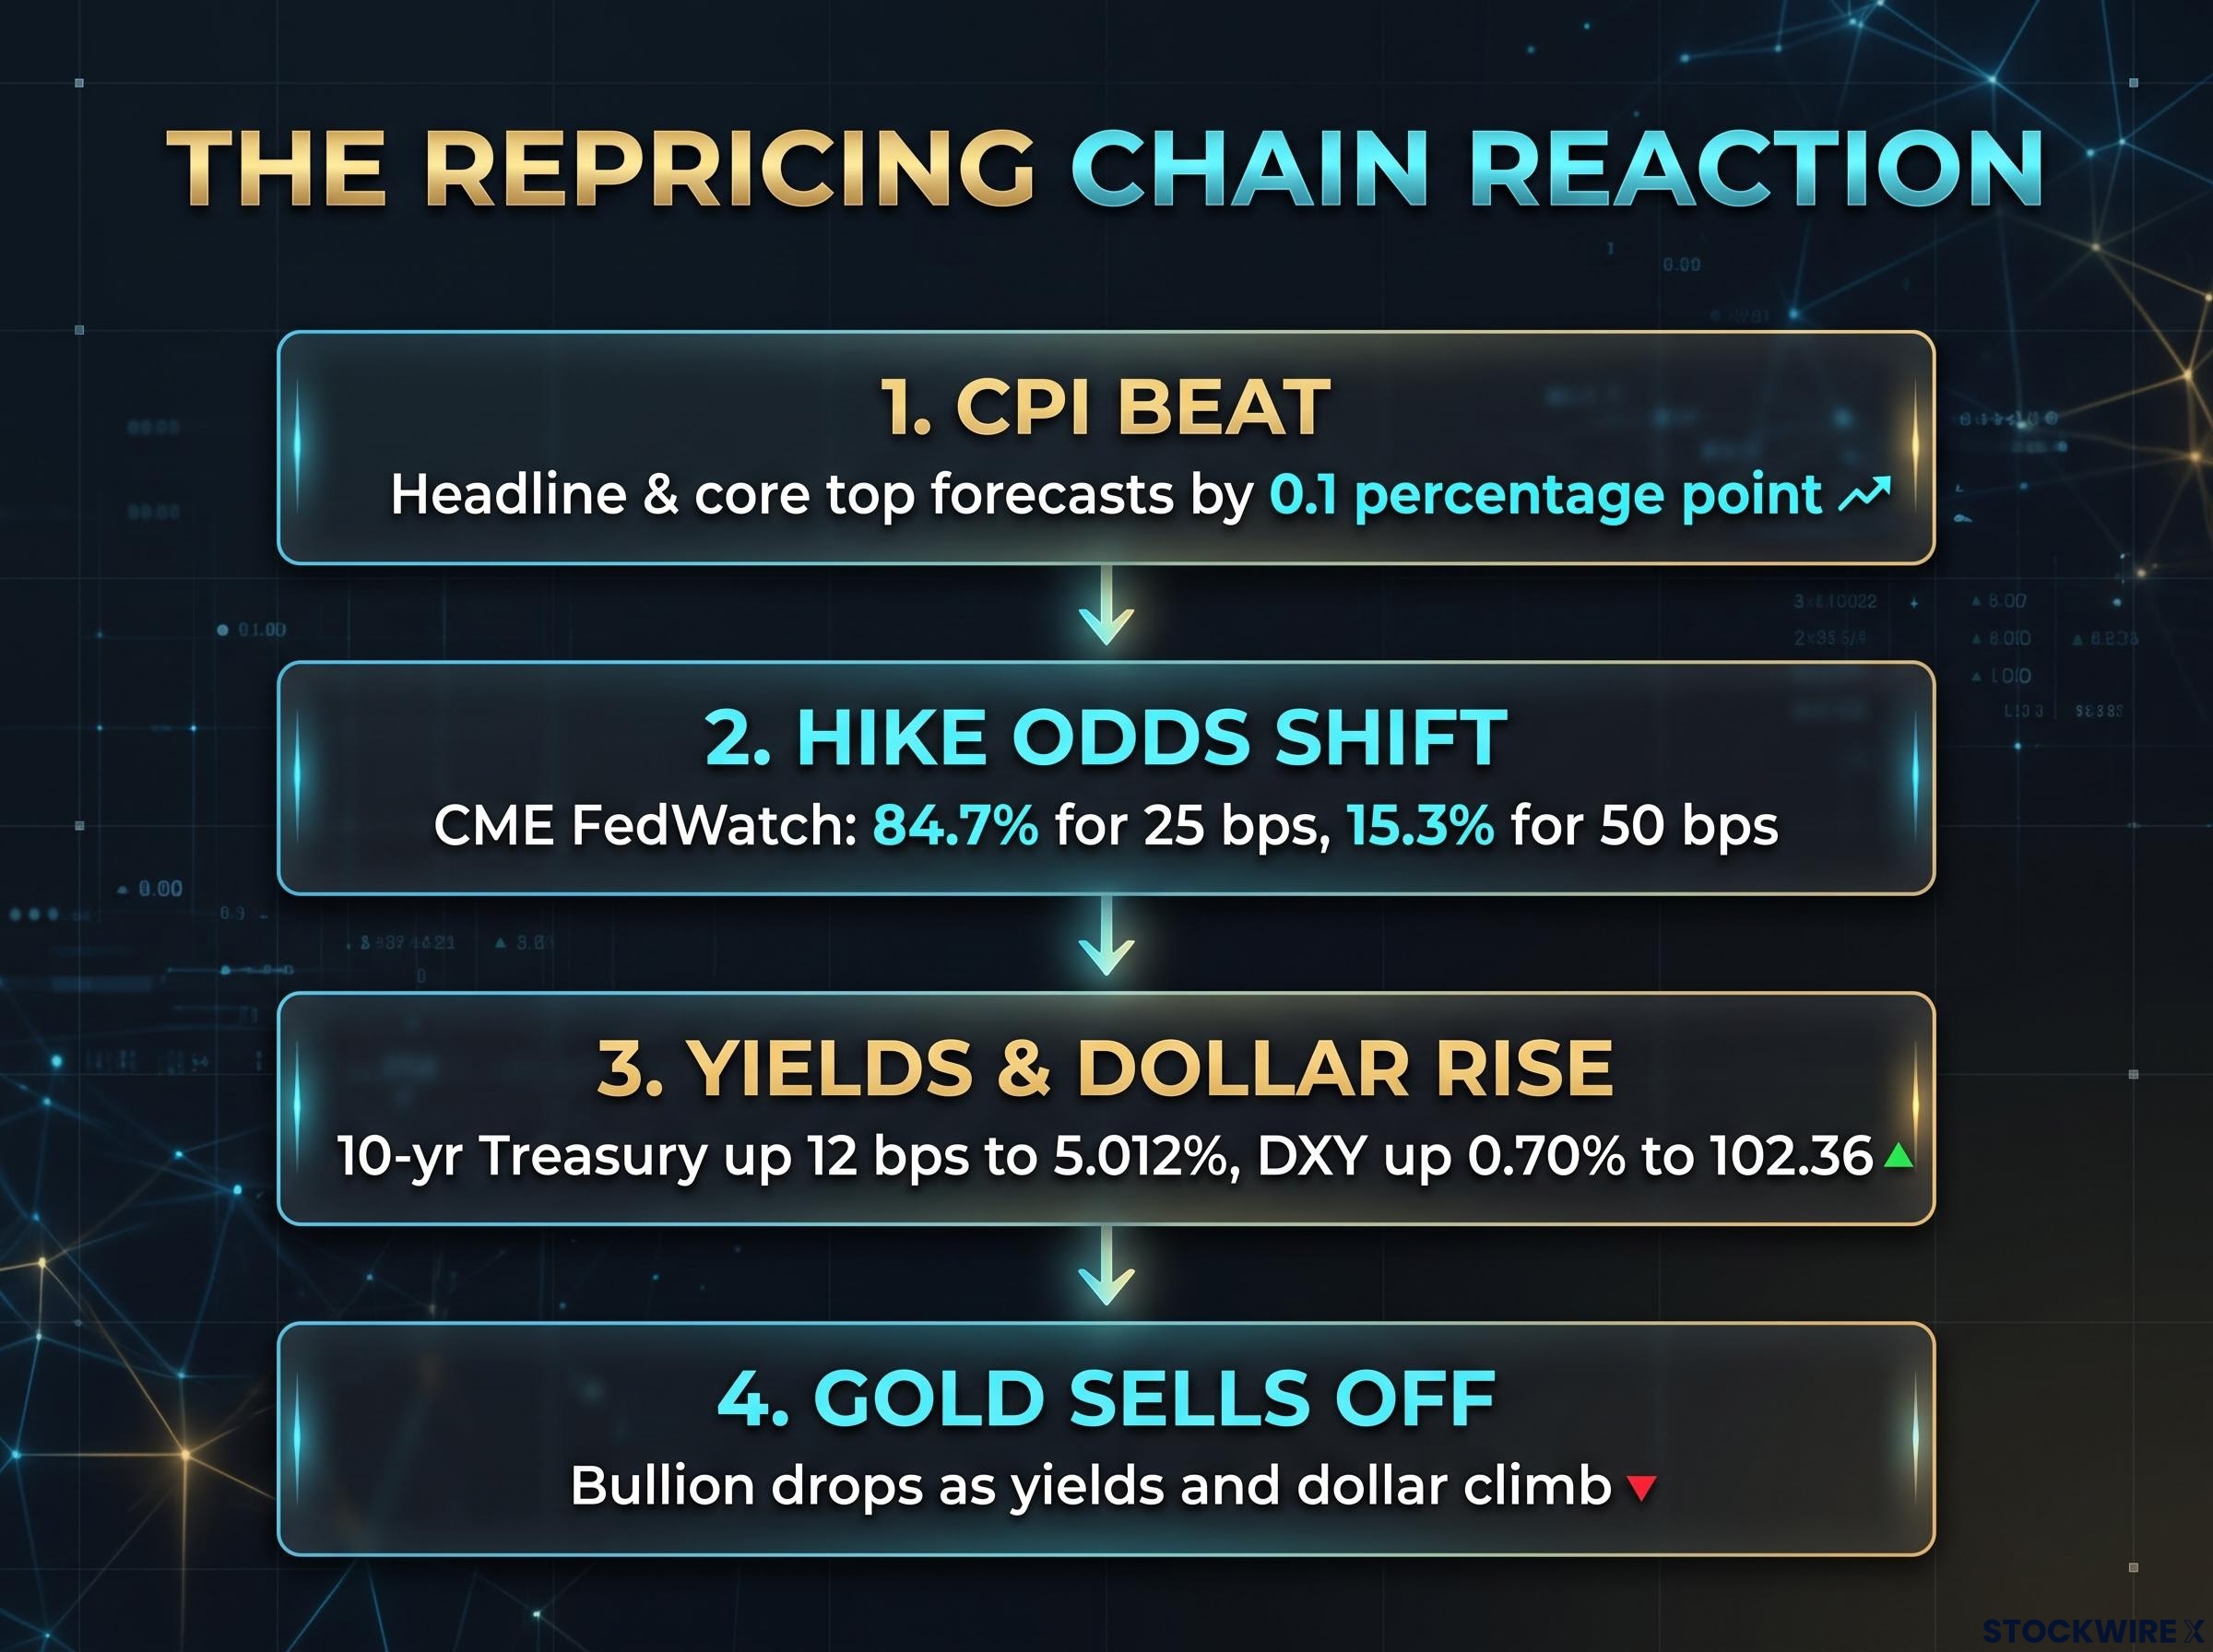
A 0.1 percentage point CPI beat shifted CME FedWatch odds to 84.7% for 25 bps, pushing the 10-year Treasury up 12 bps to 5.012% and the DXY to 102.36.
Oil barely moved amid speculation about a possible Washington-Tehran ceasefire, and no confirmed ceasefire drove the session. For your purposes, a 25 basis point hike is the base case, so the gold price now hinges on whether data drags those odds toward 50 or back.
Why does gold fall when rates and the dollar rise?
Gold pays no interest. That single fact explains most of Tuesday’s move, though not all of it.
- Opportunity cost: when expected rates and real yields (returns after inflation) rise, holding a metal that earns nothing costs you more in forgone income.
- The dollar: gold is priced in US dollars, so a stronger dollar makes it more expensive for buyers paying in other currencies.
- Safe-haven demand: the World Gold Council says gold tends to move inversely to the dollar and Treasuries, and is lifted by geopolitical turmoil and recession fears.
When the link breaks
The relationship is not mechanical. The World Gold Council reported on 3 November 2026 that central banks bought 321 tonnes in Q3 2026, up 42% year on year, taking year-to-date purchases to 675 tonnes.
Sovereign demand is driven less by price appreciation than by jurisdictional safety, since vaulted gold cannot be frozen or sanctioned, which is why central bank gold buying often persists through rate-driven sell-offs.
Investors kept buying too. Reuters reported that gold-backed exchange-traded funds (ETFs), funds that hold physical bullion, took in 211 tonnes during the third quarter even as yields and the dollar rose.
Hot-inflation, hawkish episodes have generally hit gold first, with the pressure often easing later when markets start expecting a policy pivot or financial stress. For you, rates and the dollar are the dominant short-term force, but structural buyers can cushion falls, so one weak session does not by itself end a broader trend.
The $4,000 line, the $4,050-$4,100 zone and the data that could move gold next
Tuesday’s fall has put chart levels back in focus. FXStreet’s technical read is the more bearish one: gold touched a four-day low of $4,015, and the relative strength index (RSI), a momentum gauge, has turned negative.
Key price levels
- Downside: a break below $4,000 could open the 4 November low of $3,919, then the 30 October year-to-date low of $3,870
- Upside: reclaiming $4,050 and then $4,100 could bring the 50-day simple moving average (SMA) at $4,185 and the 100-day SMA at $4,200 into view
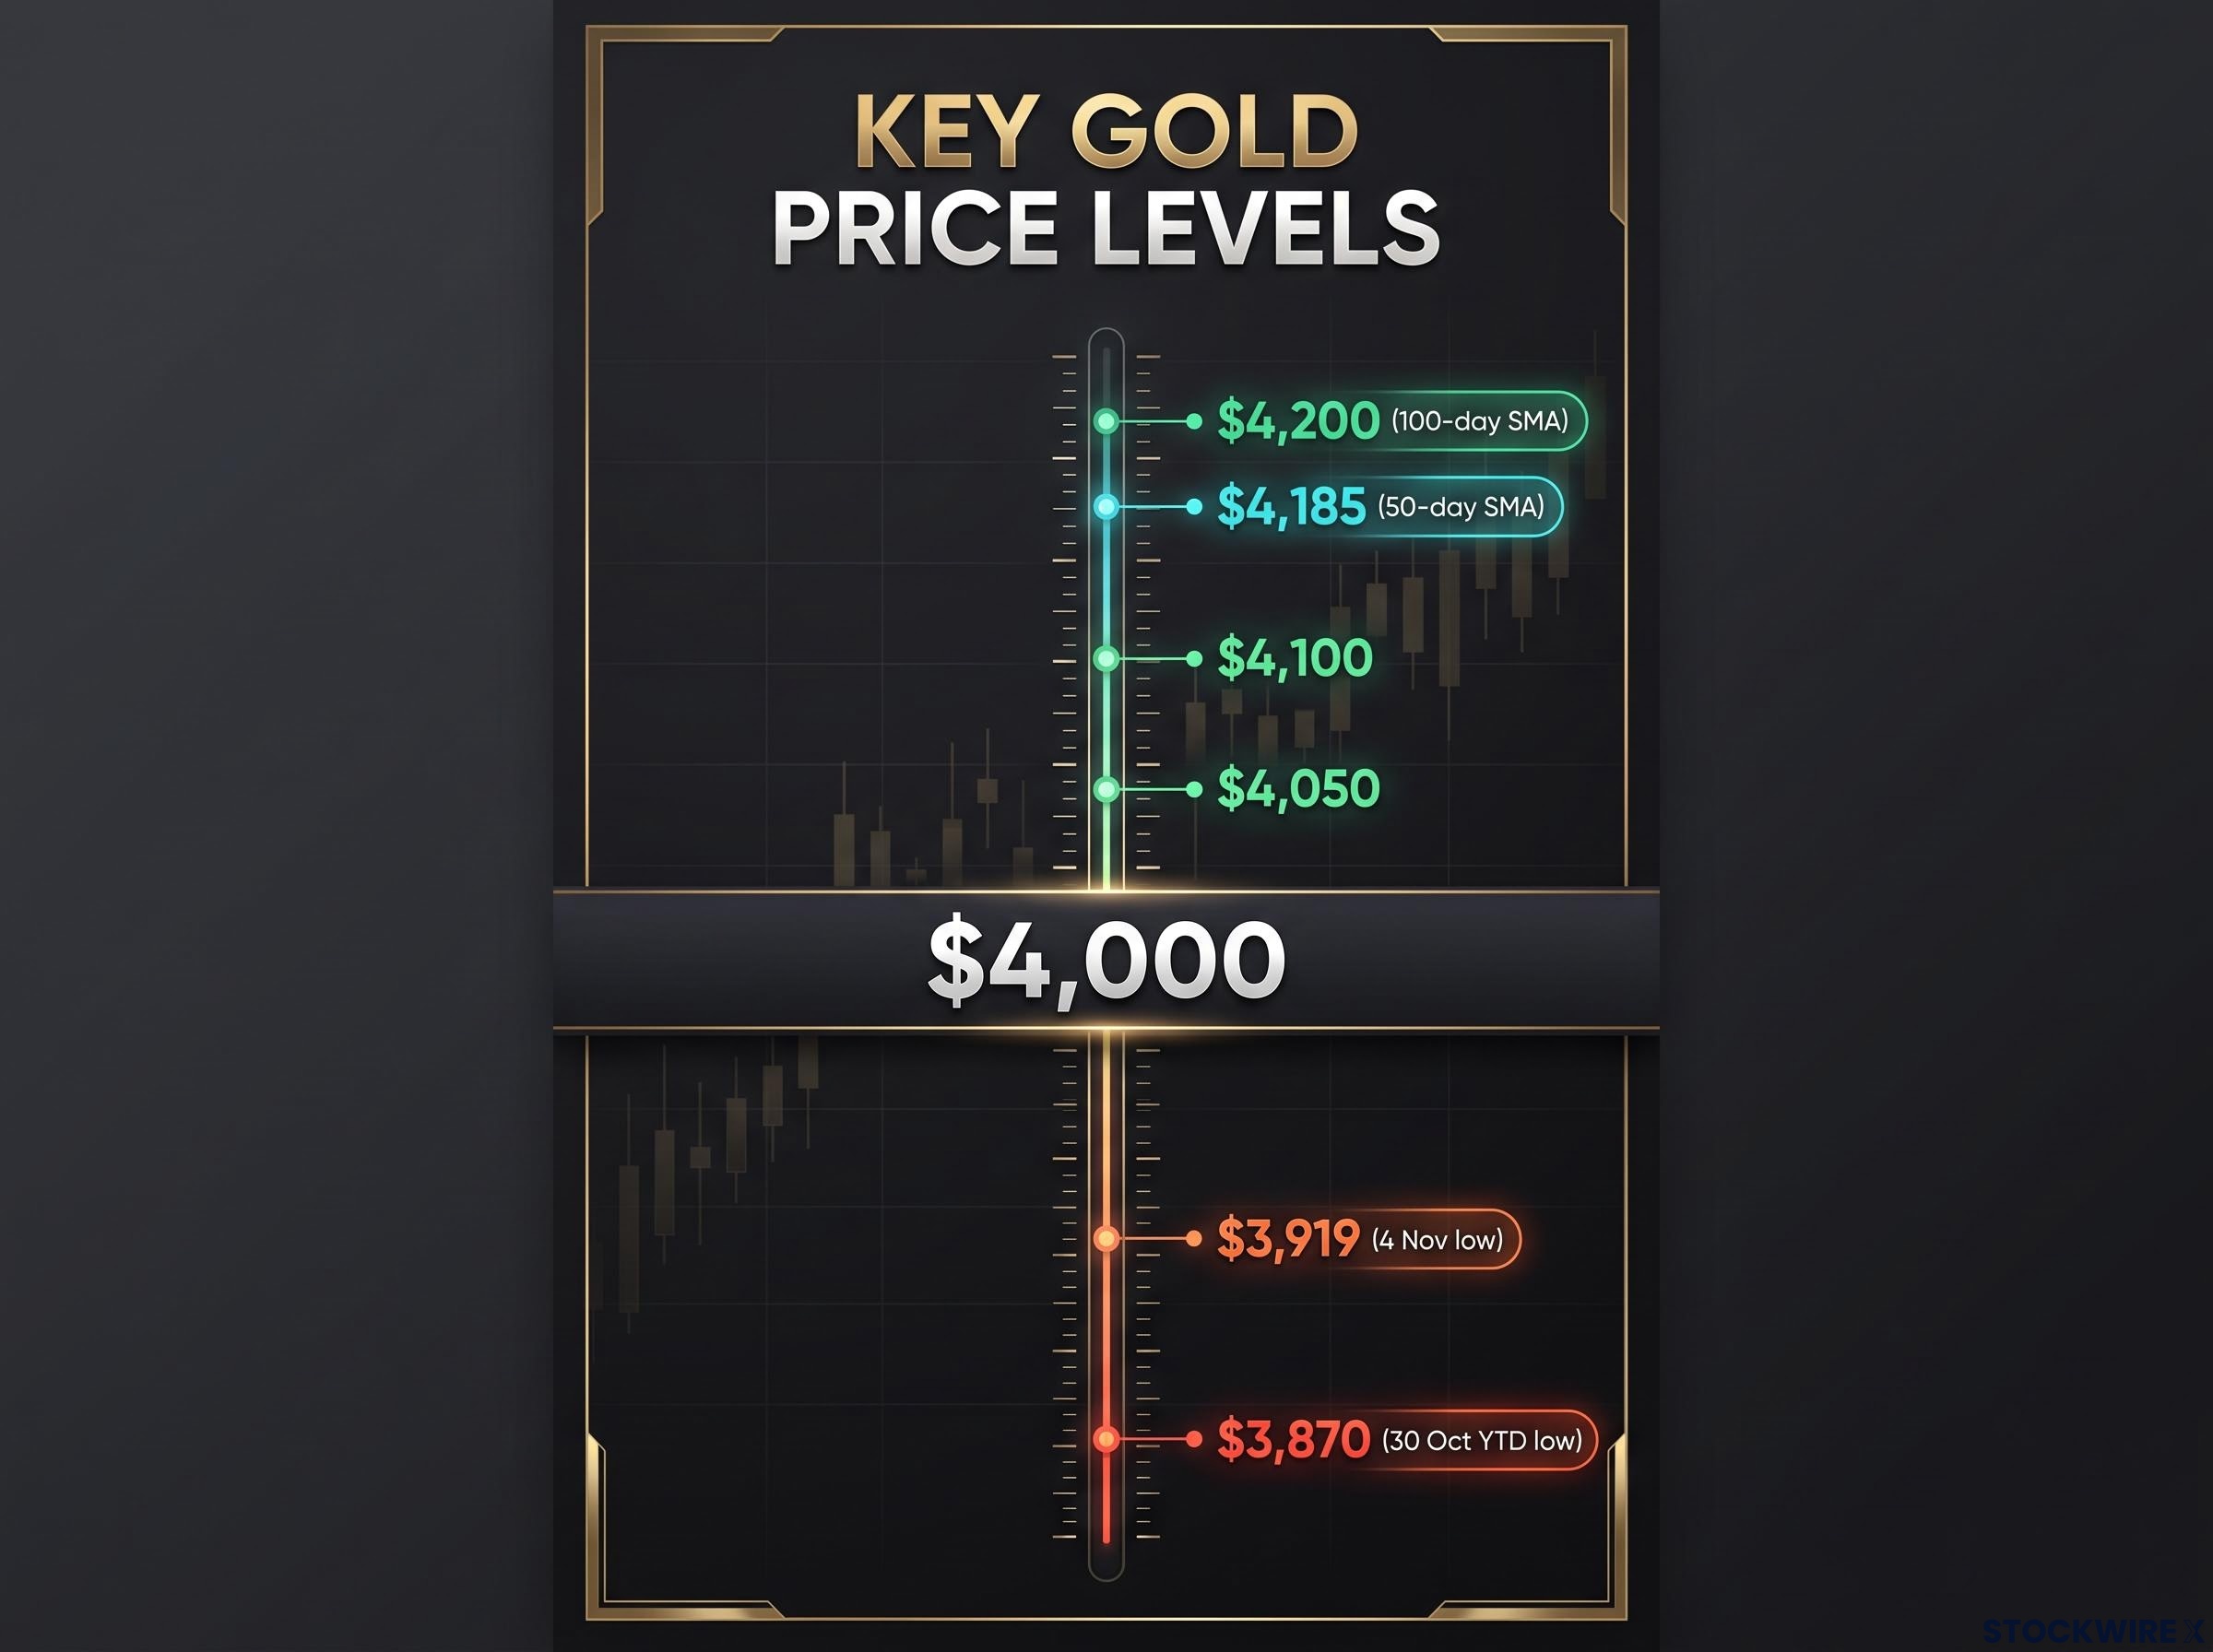
The $4,000 mark acts as a pivotal threshold, with downside targets reaching $3,870 and upside resistance extending to the 100-day SMA at $4,200.
These are conditional scenarios, not forecasts. These statements are speculative and subject to change based on market developments. A decisive move in yields, the dollar or geopolitical risk can override them within hours.
The counter-view is that the drop followed a large rally, and profit-taking may have amplified the CPI reaction. On that reading, the move looks like a correction from a high rather than a turn in the trend.
For readers wanting to use these levels themselves, our deep-dive into gold technical analysis with Fibonacci and moving averages tests how retracement bands performed across the rally.
Data and Fed speakers to watch
| Date | Event | Why it matters |
|---|---|---|
| Wed 11 Nov | Veterans Day, no major BLS release | Price action driven by positioning, not new data |
| Thu 12 Nov, 8:30 a.m. ET | Jobless claims | Labour weakness could temper hike expectations |
| Thu 12 Nov, 10:00 a.m. ET | Existing-home sales; Fed’s Hammack and Kugler speak | Signals on how officials read the CPI beat |
| Fri 13 Nov, 8:30 a.m. ET | October producer price index (PPI) | Another hot print would strengthen the 50 basis point case |
| Fri 13 Nov | Fed’s Jefferson and Bowman appear | Leadership tone on the size of the December move |
The PPI measures prices received by producers, an early read on cost pressure. For you, this week turns on whether that number and the Fed speakers reinforce or soften the December hike story; a weaker labour market or softer inflation could limit tightening, with 25 basis points still the base case at about 85%.
What the sell-off changes, and the signals that decide the next move
Tuesday’s drop came down to a short chain: a CPI beat that met Waller’s stated threshold, Logan’s call for more tightening, higher odds of a bigger December hike, and a jump in yields and the dollar that raised the cost of holding gold.
The near-term tests are clear. Watch whether $4,000 holds, and how Friday’s PPI and this week’s Fed commentary shift the hike odds.
A pullback within a rally and a genuine trend change look identical on day one. Rather than reading too much into a single session, track the 10-year yield, the dollar and official-sector buying, because those forces will tell you which one this is.
This article is for informational purposes only and should not be considered financial advice. Investors should conduct their own research and consult with financial professionals before making investment decisions. Past performance does not guarantee future results. Financial projections are subject to market conditions and various risk factors.