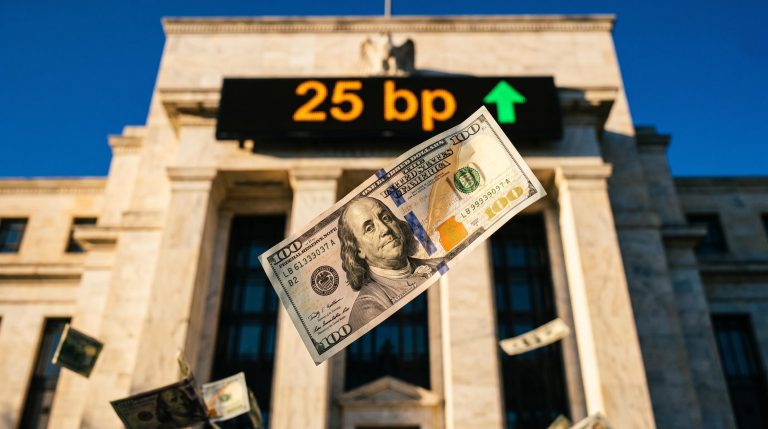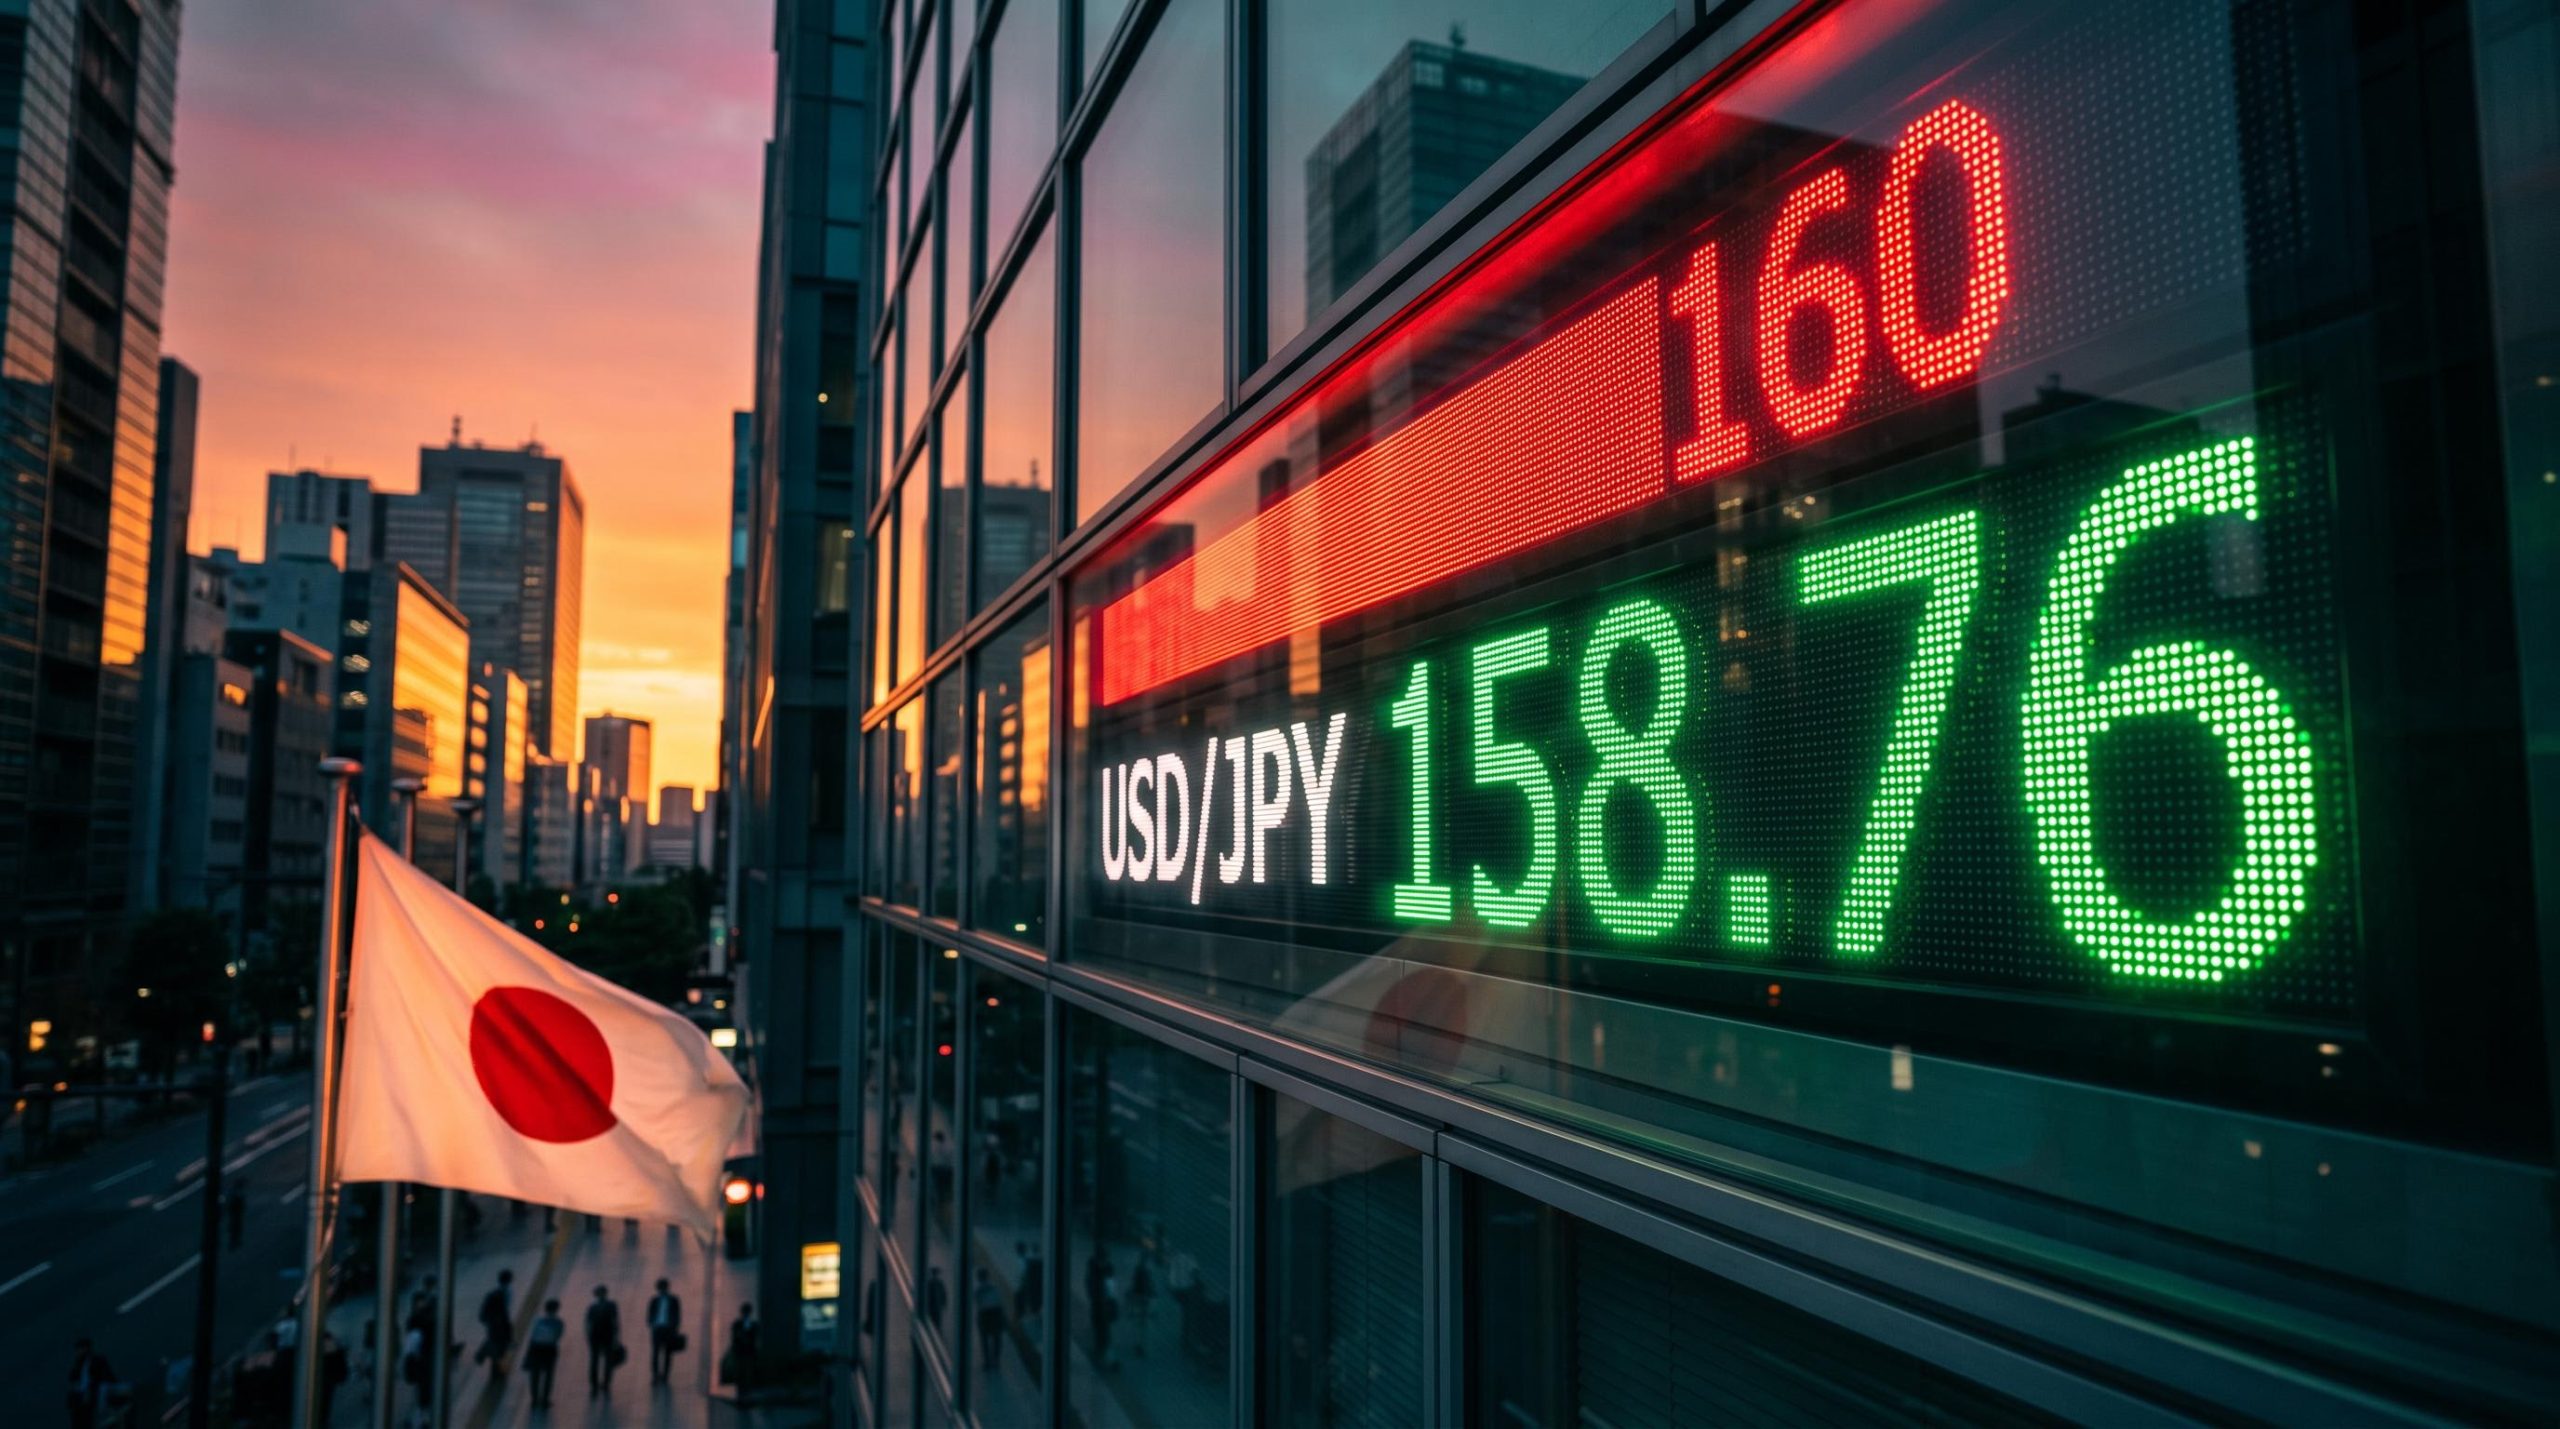
The dollar climbed against every major currency on Tuesday, pushing USD/JPY to about 158.76 after US October inflation beat forecasts. Two Federal Reserve (Fed) officials added fuel by openly arguing for more rate hikes.
The timing matters for the yen. The pair now sits just below the 160 area where Japan stepped into the market this summer. Each extra yen of weakness brings it closer to the level where Tokyo has already shown it is willing to act.
Here is what is driving the yen’s slide, where the risk points sit on the way up and down, and which two data releases later this week could decide whether the rally has further to run.
How far did the dollar run on Tuesday, and which currencies took the hit?
The move was broad. According to the FXStreet heat map, the dollar gained against all seven major currencies, and the Australian dollar took the heaviest blow.
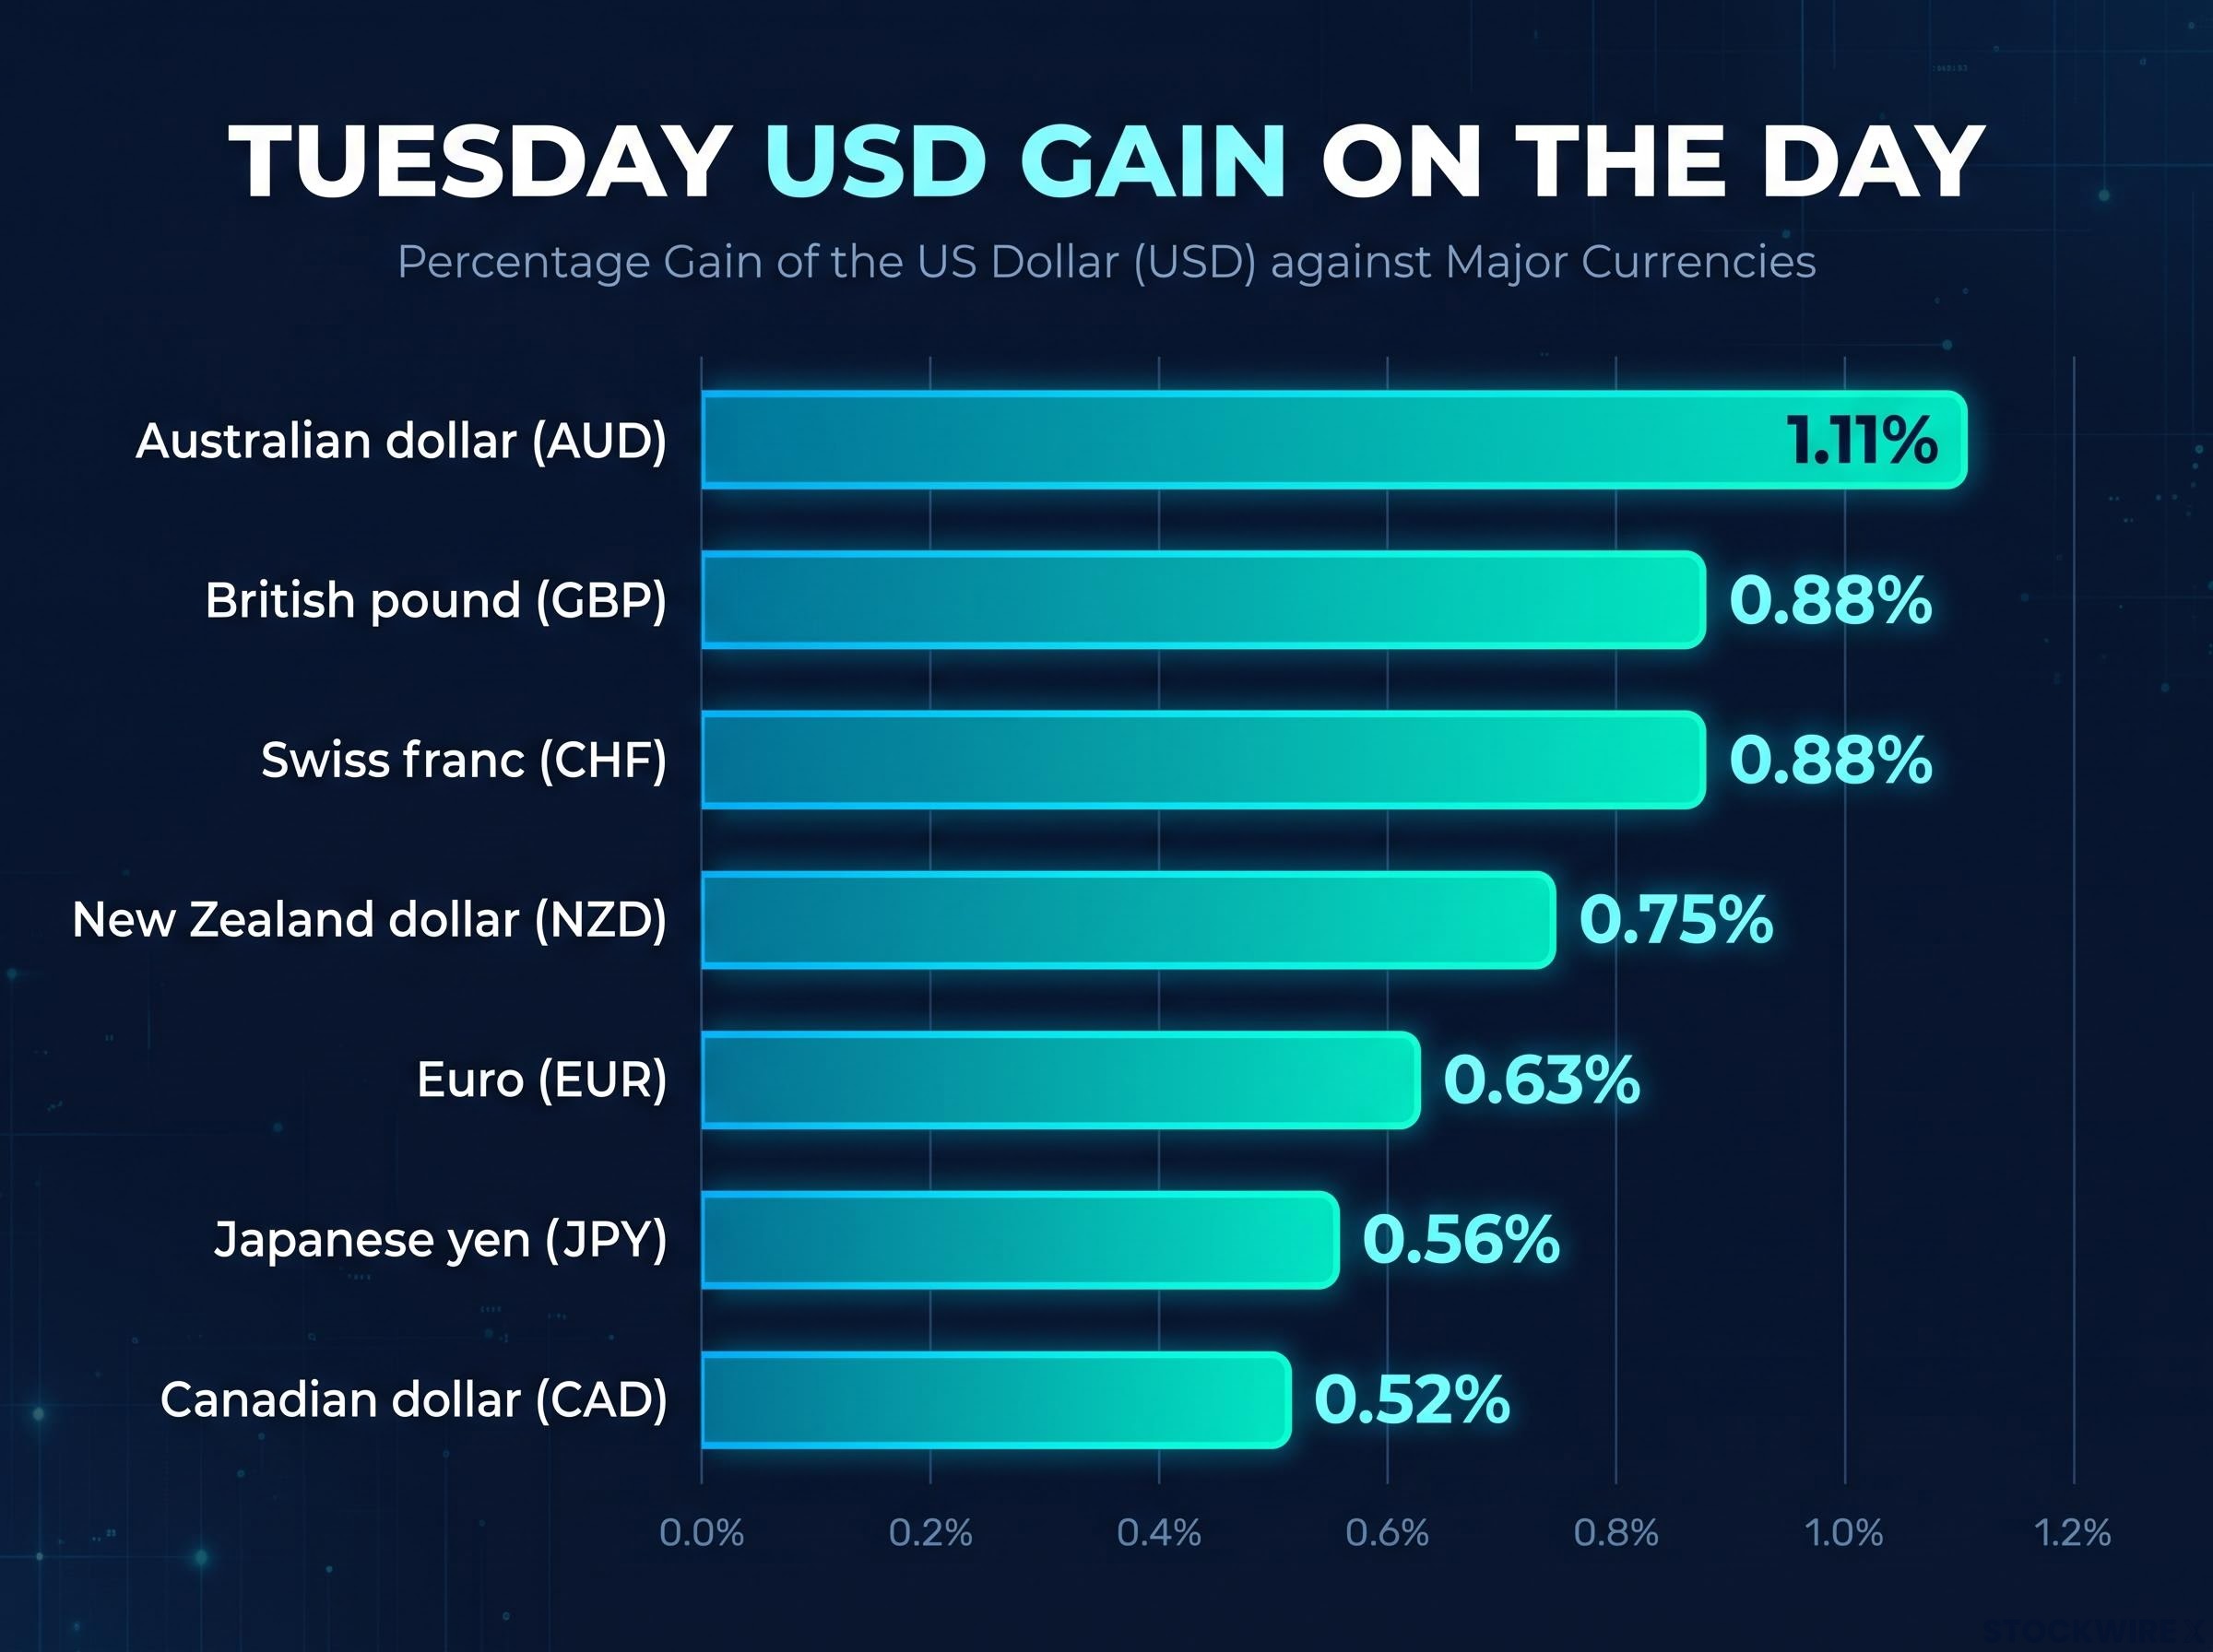
The US dollar posted daily gains against all major peers on Tuesday, led by a 1.11% rise against the Australian dollar (AUD).
| Currency | USD gain on the day |
|---|---|
| Australian dollar (AUD) | 1.11% |
| British pound (GBP) | 0.88% |
| Swiss franc (CHF) | 0.88% |
| New Zealand dollar (NZD) | 0.75% |
| Euro (EUR) | 0.63% |
| Japanese yen (JPY) | 0.56% |
| Canadian dollar (CAD) | 0.52% |
The yen sat mid-table. It was not singled out, which tells you this was a US rates story first and a Japan story second.
The trigger came from the Bureau of Labor Statistics (BLS), the US agency that compiles consumer prices:
- Headline CPI: +0.4% month on month, against a +0.3% forecast (September: +0.6%)
- Core CPI (excluding food and energy): +0.3%, against a +0.2% forecast
There was no year-on-year figure. A lapse in federal funding meant BLS never collected October 2025 survey data, so it has no base to compare against. The surprise lived entirely in the monthly numbers.
Markets responded fast. The US 10-year Treasury yield rose about 12 basis points to roughly 5.00%, the US Dollar Index gained 0.68% to about 102.38, and USD/JPY added about 0.55%. These levels are intraday snapshots from TMGM and FXStreet, not official closes.
When big ASX news breaks, our subscribers know first
What did Logan and Waller say, and how far have December hike odds moved?
The data was only half the story. Fed officials then told markets how they read it.
Dallas Fed President Lorie Logan said the Fed needs at least two more 25 basis point hikes before pausing, according to Axios and TMGM. She argued the policy rate is still at least 50 basis points short of modestly restrictive, and pointed to price pressures that go beyond the wartime energy shock.
“May be possible to move more rapidly this winter.” Lorie Logan, President, Federal Reserve Bank of Dallas
Fed Governor Christopher Waller set the trap before the data landed:
- Logan: at least two more 25 bp hikes, with room to accelerate
- Waller: leaning towards a December hike, and said a 50 bp move should be considered if core CPI came in around 0.3% or higher
Core came in at exactly 0.3%. His condition was met.
The backdrop gives officials little comfort. Reuters links rising prices to oil costs tied to the US-Israeli war with Iran and to US import tariffs, while Chicago Fed President Austan Goolsbee said services inflation has accelerated.
Where December odds stand
The CME FedWatch tool showed an 89.2% probability of a 25 bp hike in December and 10.8% for 50 bp, with some outlets showing roughly 88% and 12% as odds moved intraday. The half-point odds rose after the CPI release.
A 50 bp hike remains the minority outcome. For you, it is a live tail risk worth tracking, because a bigger move would push US yields higher and widen the gap with Japan further.
December hike pricing also reflects a supply-driven inflation backdrop, with producer energy costs accounting for most of the rise in goods prices, which is why some analysts argue a hold would be the larger surprise.
Why does a roughly 283 bp yield gap keep the yen under pressure?
Set the US 10-year at 5.00% against Japan’s 10-year government bond (JGB) at 2.17%, and the difference is about 283 basis points. That figure is derived from the snapshot yields, not an official close, but its size explains why the yen keeps losing ground.
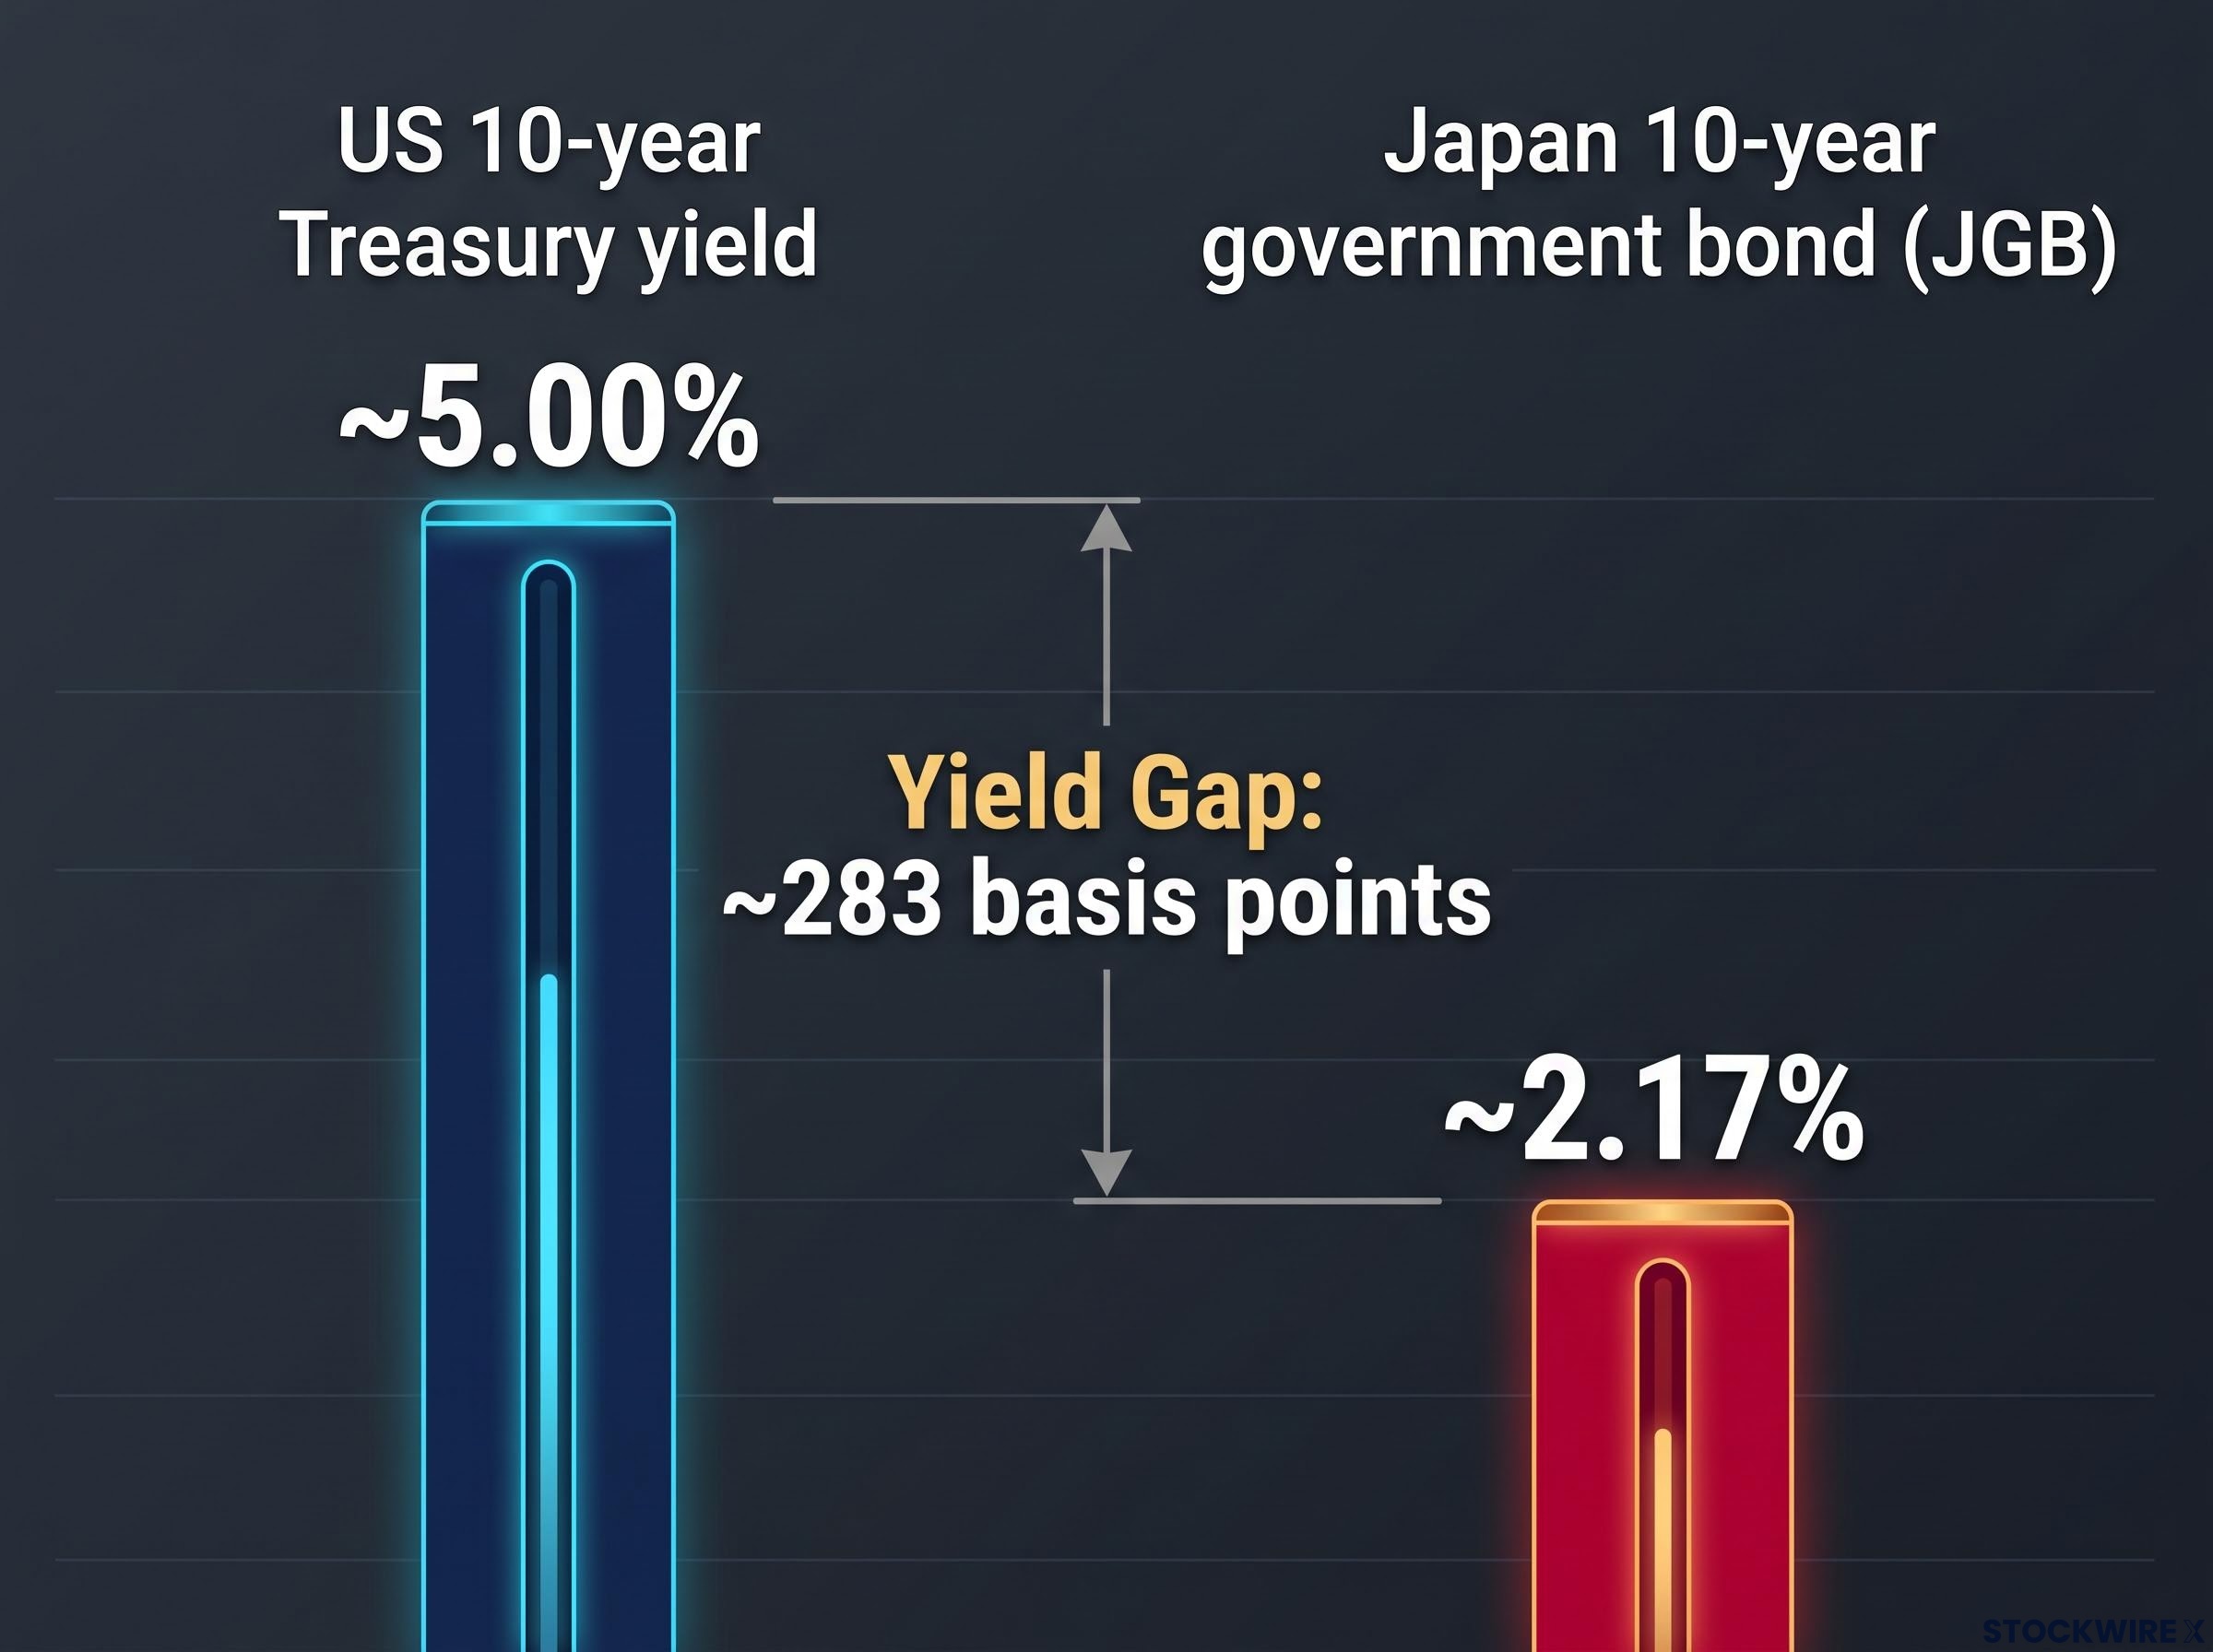
The massive ~283 basis points Yield Gap between the US 10-year Treasury yield at ~5.00% and Japan’s JGB at ~2.17% keeps the yen under pressure.
How the carry trade works
A carry trade means borrowing money in a currency with low interest rates and investing it where rates are higher, pocketing the difference. Investors borrow yen cheaply, sell it to buy dollars, then buy US bonds or other assets. That selling pushes the yen down. The wider the gap, the more attractive the trade, and the more yen gets sold. If the trade unwinds, investors buy back yen to repay loans, and the yen rises quickly.
The Bank of Japan (BoJ) is closing the gap slowly. Its policy rate sits around 1.25%. Keisuke Tsuruta of Mitsubishi UFJ Morgan Stanley Securities said in September that the gap is unlikely to narrow much if the Fed keeps tightening, while Maki Ogawa of Sony Financial Group expects gradual BoJ hikes and a medium-term range of 150-165. Bloomberg reported on Tuesday that the BoJ’s October meeting summary favoured hiking when possible.
Tokyo has already tested the ceiling. Bloomberg data shows three operations in summer 2026:
- 30 July: a record ¥7.98 trillion in yen purchases
- Following day: ¥5.55 trillion
- Subsequent day: ¥1.87 trillion
Morningstar described it as the first coordinated US-Japan yen buying since 1998. Even so, USD/JPY stayed near 160.
The July operation was part of a coordinated intervention campaign in which the US Treasury sold euros to buy yen alongside Japan, only the second joint action of its kind since 1973.
| View | Argument | Source | Implication for USD/JPY |
|---|---|---|---|
| Further upside | Hawkish Fed plus gradual BoJ keeps the carry trade alive | Morningstar/Dow Jones (Tsuruta, Ogawa) | Higher |
| Intervention ceiling | Japan has acted before when depreciation turned disorderly | Morningstar, Bloomberg | Resistance near 158-160 |
| Faster BoJ | October summary backed hiking when possible | Bloomberg | Lower over time |
| Yen recovery or Fed overtightening | Aggressive Fed hits growth, triggers risk-off and a carry unwind | Reuters (6 November), Morningstar | Sharply lower |
The read for you: any USD/JPY forecast hinges on three moving parts, the yield gap, the BoJ’s pace and Tokyo’s appetite to intervene. The realistic range is wide, not a single target.
What should traders watch next, with Japan PPI on Thursday and US PPI on Friday?
Two releases arrive before the week is out, and both feed directly into the yield gap.
- Japan October producer prices: Thursday 12 November 2026, 8:50 a.m. Japan time. Firm price pressure could support the case for an earlier BoJ hike.
- US October PPI: Friday 13 November 2026, 8:30 a.m. ET. This measures prices paid to producers and often signals where consumer inflation heads next.
- Fed commentary and FedWatch odds: ongoing all week, and weightier than usual because Japan’s calendar is otherwise light.
A hot US PPI after a hot CPI would strengthen the case for a faster Fed and a wider gap, pressing USD/JPY from 158.76 towards 160. A soft print would test the dollar’s momentum. Watch which one arrives.
Morningstar’s Lee Hardman sees a possible near-term peak around 160-165, followed by a decline towards the low 150s if the energy shock fades, the Fed stops and the BoJ hikes further.
These views reflect conditions as of 10 November 2026 and may change as markets move.
What a 158.76 print tells you about the yen’s next move
Tuesday stacked the pressure in one direction: a hotter CPI, a Fed openly debating faster hikes, a yield gap near 283 basis points and a pair edging towards Tokyo’s line in the sand near 160.
Treat the precision with care. The missing year-on-year data and intraday snapshots mean the picture is directional, not exact.
The next signals come from Japan’s producer prices on Thursday and US PPI on Friday. Beyond that, the forecast for this pair comes down to one contest: how fast the Fed moves compared with how fast the BoJ catches up.
Past performance does not guarantee future results. Financial projections are subject to market conditions and various risk factors.
This article is for informational purposes only and should not be considered financial advice. Investors should conduct their own research and consult with financial professionals before making investment decisions.