
The 10-year US Treasury yield has climbed above 5.2%, the highest it has traded since June 2007, before the global financial crisis. If you have been investing at any point in the last decade and a half, you have never had to position a portfolio through a risk-free yield this high.
This is not happening in a vacuum. The Federal Reserve raised its benchmark rate to a target range of 3.75%-4.00% on 16 September 2026, and futures markets are now pricing roughly 70% odds of another quarter-point hike at the 28 October Federal Open Market Committee (FOMC) meeting. The week ahead, 29 September to 3 October, delivers the exact data the Fed will lean on to make that call: PCE inflation, job openings, the ISM Manufacturing survey, and September nonfarm payrolls.
Consider this your map for the week. You will finish knowing what each release is expected to show, what a surprise in either direction would do to those October hike odds, and why the answer lands directly on the value of the equities you already hold.
What futures markets are actually pricing, and why 70% is not a guarantee
Start with the number everyone is quoting. As of 28 September 2026, the Investing.com Fed Rate Monitor Tool put the probability of a 25-basis-point hike to 4.00%-4.25% at 68.9%, with the remaining 31.1% assigned to no change.
Here is the part most headlines skip: that figure is not a Fed announcement or an opinion poll. It is extracted live from Fed funds futures and interest rate swaps, markets where traders put real money behind their view of what the central bank does next. It moves every time new data lands.
That is why the exact number depends entirely on which instrument you read and when you read it:
- Investing.com (Fed Rate Monitor, 28 September 2026): 68.9%
- CME FedWatch (via CNBC, 26 September 2026): 64%
- TradingEconomics (swaps pricing, 25 September 2026): approximately 70%
The spread between 64% and 70% tells you something useful: no single tool owns the truth here. They diverge because they read different instruments and different timestamps, but they all point the same direction. An October hike is the base case, not a certainty.
The current policy stance reflects a genuine tension at the core of the Fed dual mandate: inflation is running 1.4 percentage points above the 2% target while the labour market is decelerating toward payrolls growth that would have been considered recessionary in prior cycles.
And the number can lurch. Reuters documented one such move last week.
Hike odds moved from 53% to 66% within a single session on 23 September following stronger-than-expected business activity data.
That is a 13-percentage-point swing on one release. It shows you exactly how much a single strong jobs or inflation print this week could move the needle, likely more than most investors expect going into Friday.
Why the probability number moves between sources and sessions
The gap between sources comes down to plumbing. CME FedWatch is built from Fed funds futures, contracts that settle against the actual Fed funds rate. TradingEconomics and Investing.com lean on interest rate swaps, a different market for pricing future rates. Both are legitimate reads on the same question; they simply use different instruments.
The CME FedWatch methodology calculates rate hike probabilities from Fed funds futures contract prices by comparing the implied rate baked into each contract against the current target range, which is why the tool updates in near real time as futures trade.
Timestamps matter just as much. A reading from 25 September and one from 28 September describe a market that absorbed three more days of information in between. When you see two different percentages quoted, check the date before assuming one is wrong.
When big ASX news breaks, our subscribers know first
Why Treasury yields above 5.2% change the investing calculus
A yield on a government bond feels abstract until you trace where it lands. That trail runs straight to what your equity portfolio is worth, and the mechanism is causal, not coincidental.
Begin with the history. According to CNBC, the 10-year yield hit 5.23% on 26 September, its highest since 2007. The 30-year sits near 5.5%, close to its highest since 2004, and the 2-year, which tracks Fed policy most closely, rose about 0.17 percentage points in the week ending 25 September.
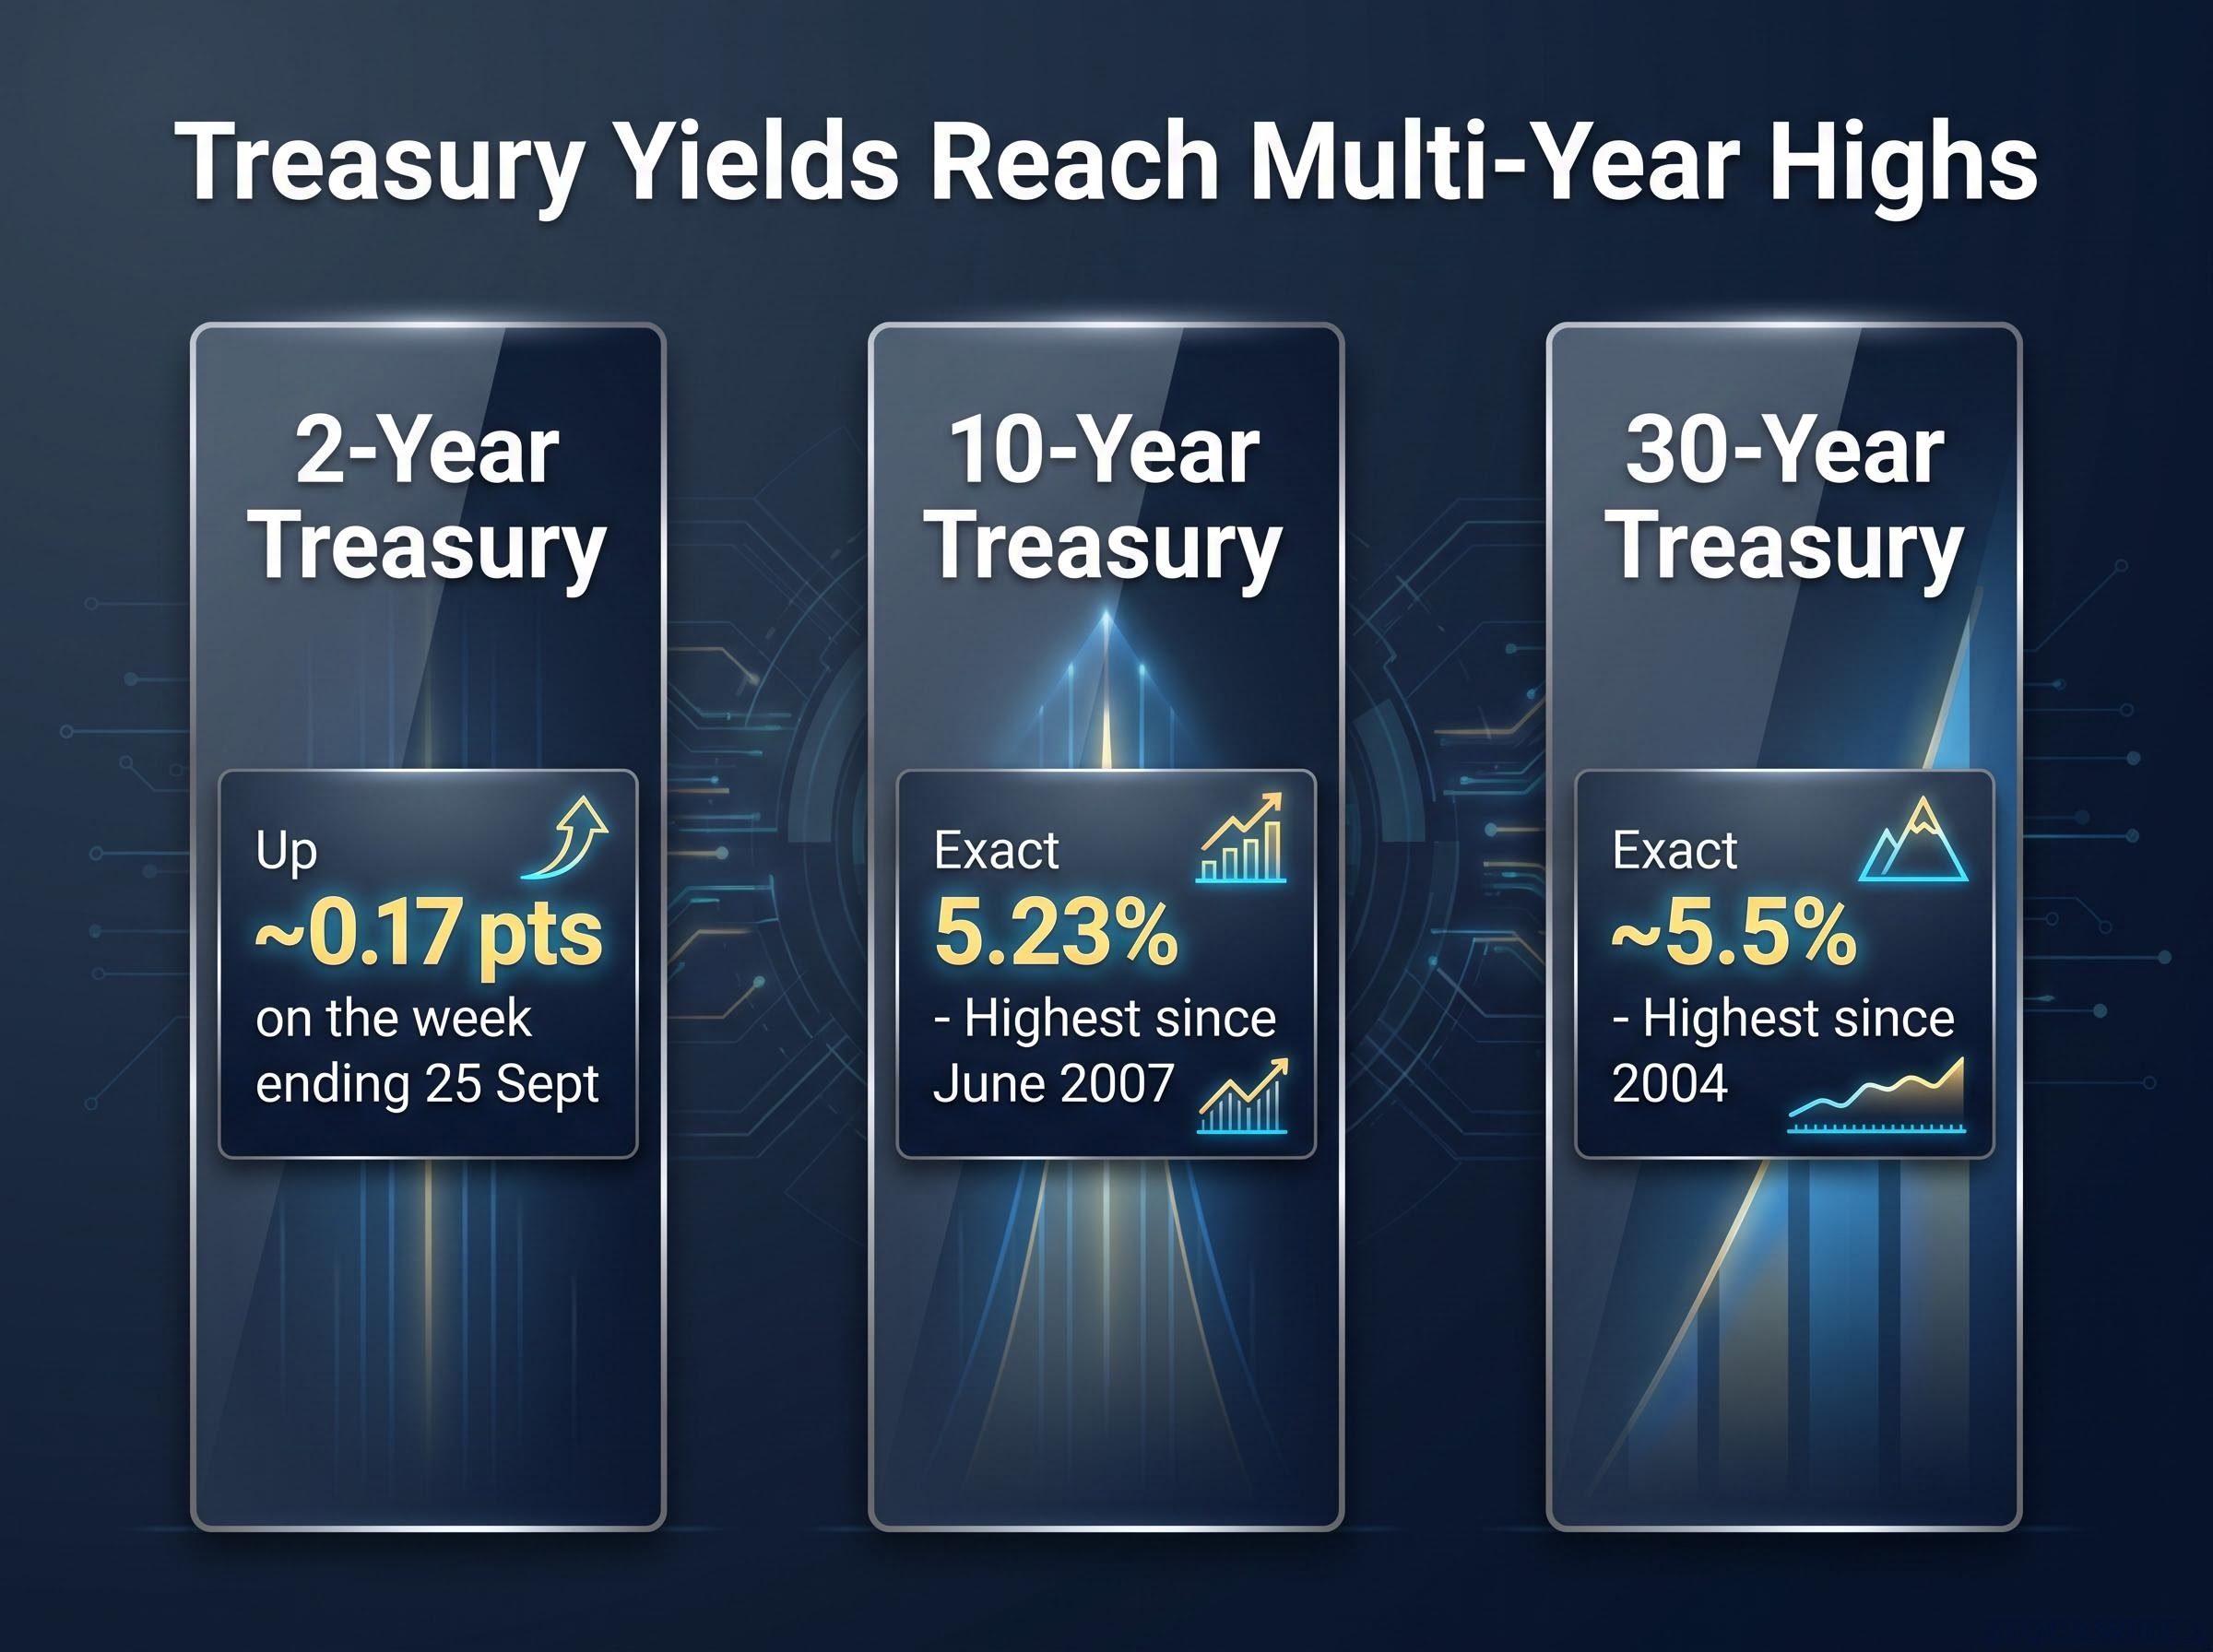
The 10-year yield crossing above 5.2% marks its highest level since June 2007, before the global financial crisis.
Here is where those tenors currently stand:
| Treasury tenor | Current yield | Last time this high |
|---|---|---|
| 2-year | Up ~0.17 pts on the week | Tracking multi-year highs |
| 10-year | 5.23% | June 2007 |
| 30-year | ~5.5% | 2004 |
Now the mechanism. Analysts value a stock by estimating its future earnings and discounting them back to today’s money using a rate anchored to the risk-free yield. When that yield rises, the discount rate rises with it. The same future earnings are suddenly worth less in present terms, which compresses price-to-earnings multiples and pulls valuations down, even if the company earns exactly what it did before.
That is the single most important link between the bond market and your holdings, and it is the one most retail investors have never internalised.
There is a second force too: competition for your capital. At 5.2%, a Treasury offers a guaranteed return that makes richly valued equities harder to defend on a relative basis. Growth stocks feel this most, because their worth depends on earnings far out in the future, exactly the earnings a higher discount rate punishes hardest.
Roughly 80% of the rise in long-term US rates since late 2024 is attributable to the real yield component rather than inflation expectations, which classifies the current selloff as a discount-rate shock and explains why growth stocks have felt the pressure most acutely.
The market is already showing the strain. Reuters directly linked recent US share declines to the climb in yields, and the Dow Jones Industrial Average (DJIA) fell in six of the nine trading sessions after the 16 September rate hike.
Read it this way: a 10-year above 5% is not merely a bond market event. It is a ceiling on equity valuations, and every incremental basis point higher makes holding growth stocks at today’s multiples a little harder to justify.
The data calendar for the week of 29 September: what each release means for the October decision
Think of the week not as a schedule but as a series of tests the economy has to pass before the Fed sits down to vote on 28 October. Each release is a chapter in a story already underway.
They arrive in sequence:
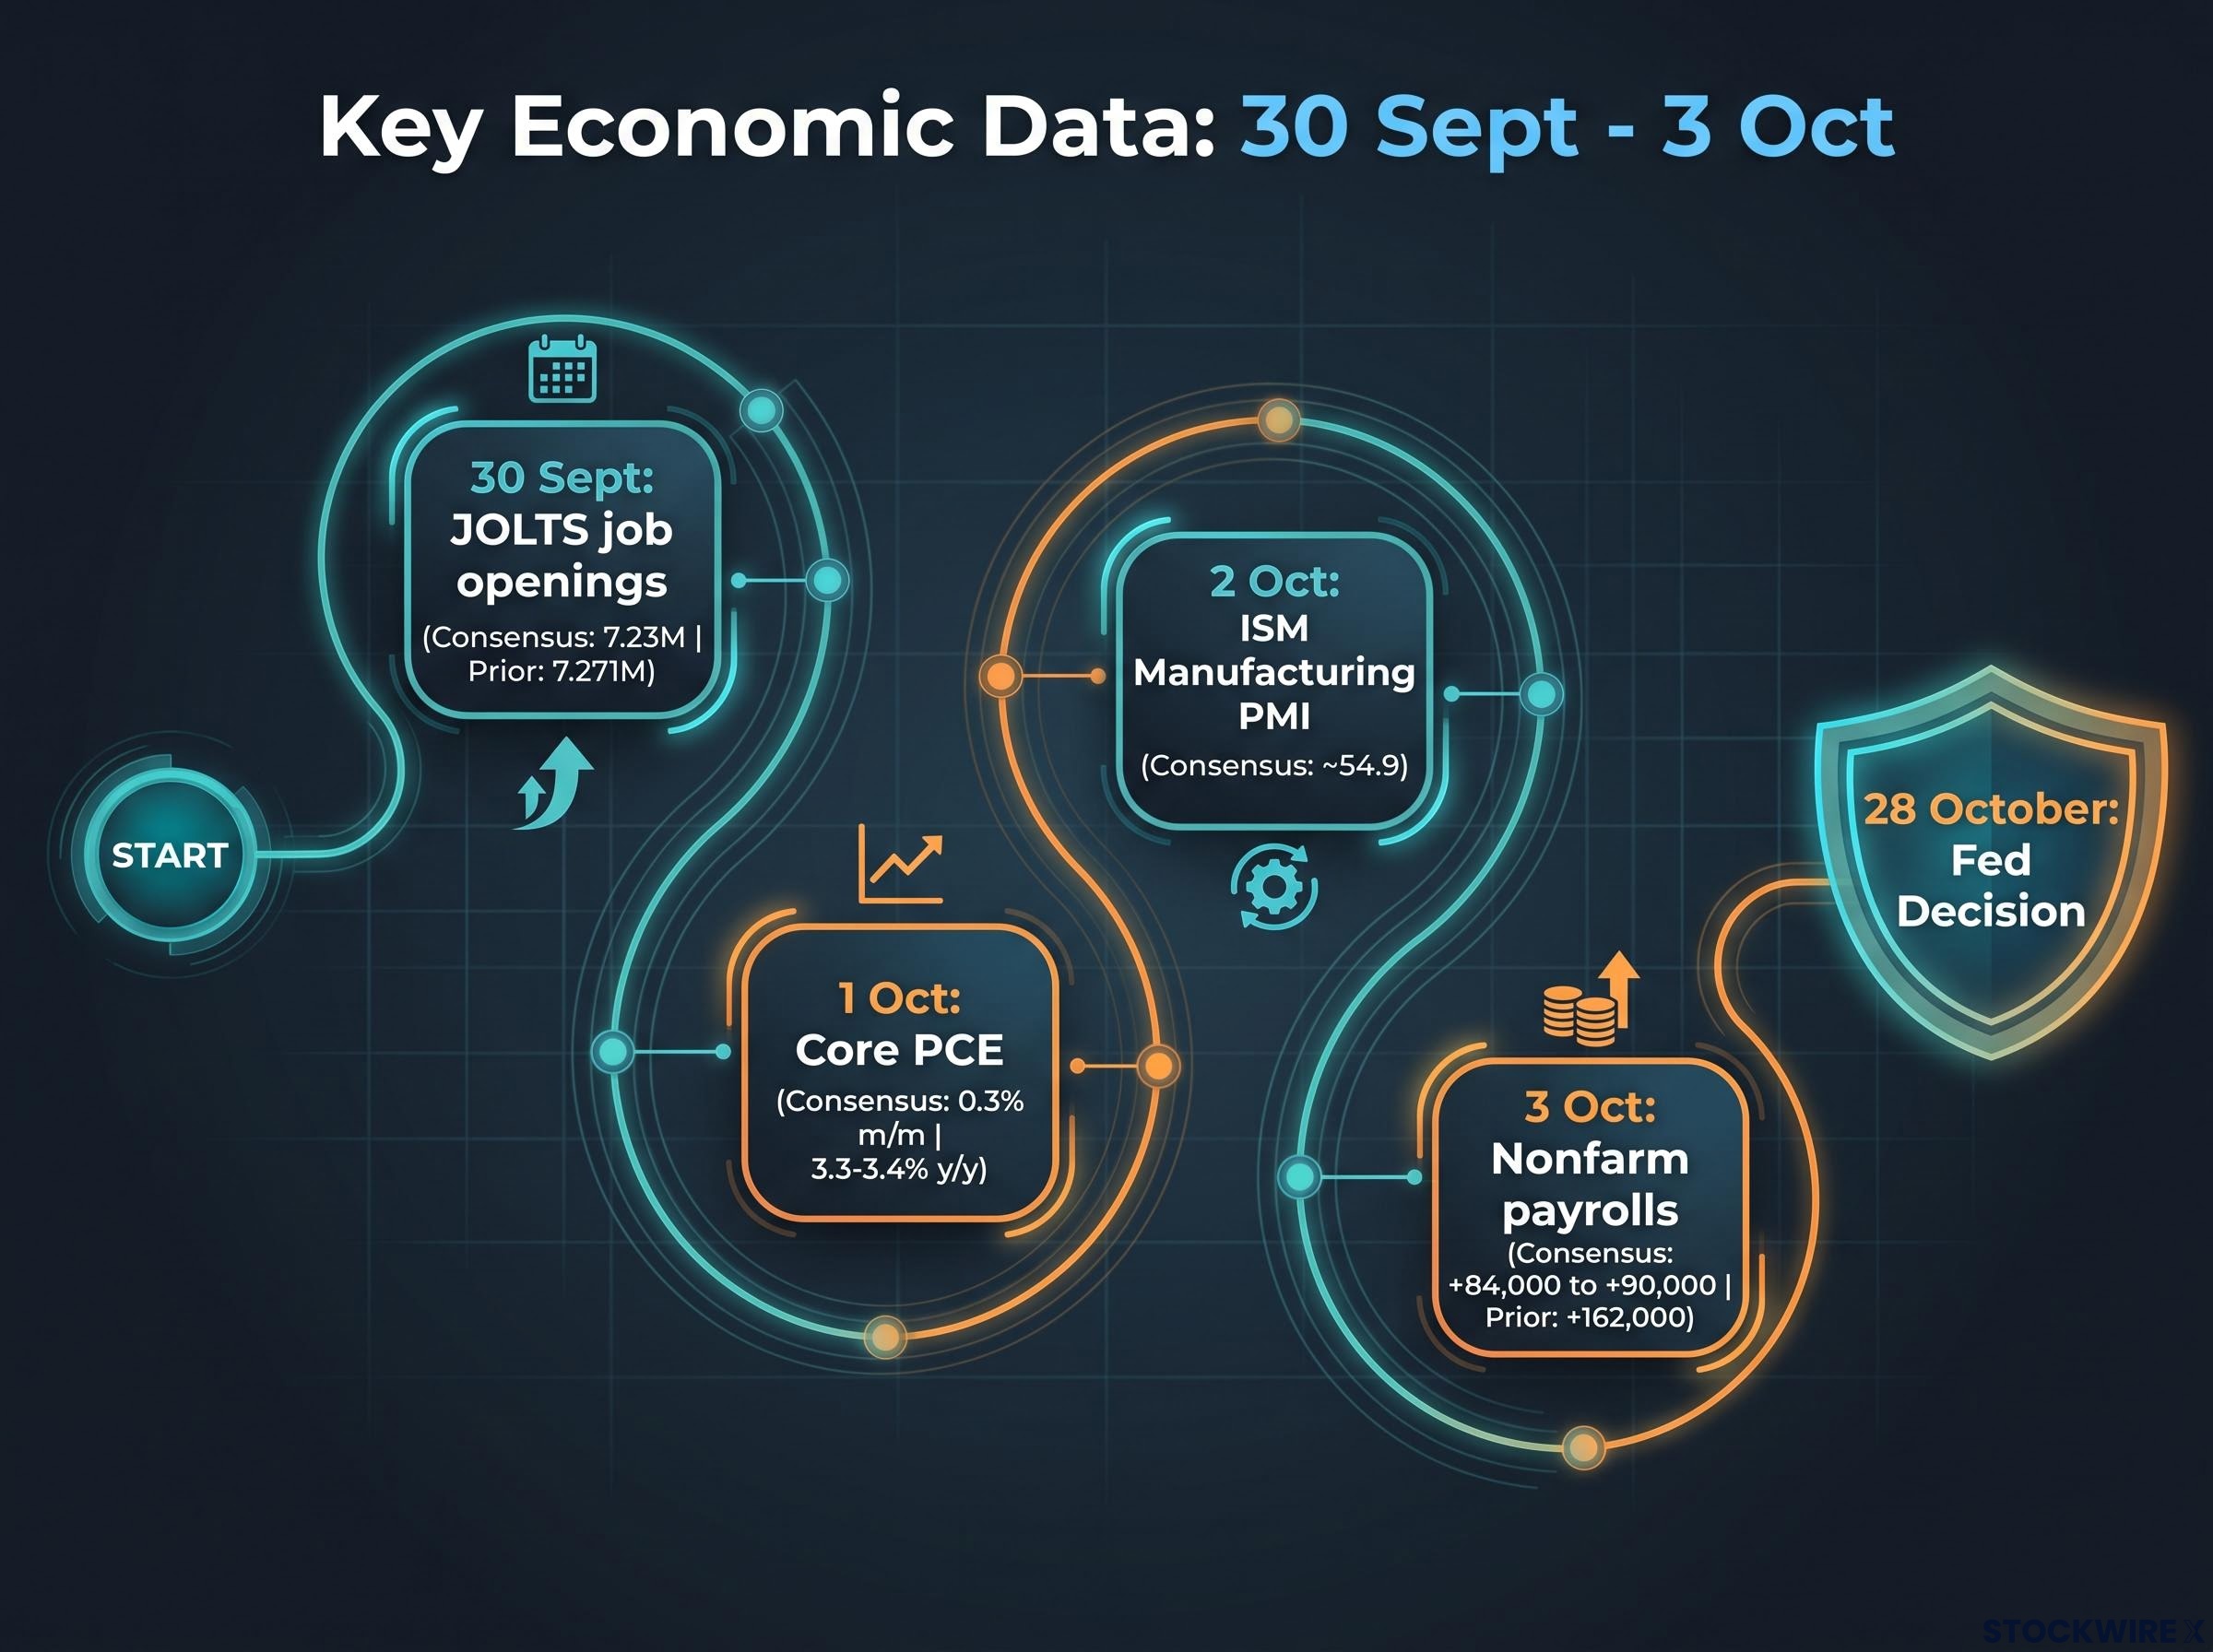
- JOLTS job openings (30 September): consensus 7.23 million versus a prior 7.271 million. A reading well above forecast signals a labour market still running hot, supporting the hike case.
- Core PCE (1 October): the Fed’s preferred inflation gauge. Consensus is 0.3% month-over-month, with the year-over-year figure at 3.3% (Brown Brothers Harriman) or 3.4% (FXStreet). Anything clearly above that range hardens the case for October.
- ISM Manufacturing PMI (2 October): consensus around 54.9. A strong print reinforces the growth-resilience narrative pushing yields higher.
- September nonfarm payrolls (3 October): the headline event, covered below.
Prior PCE readings have shaped the current policy trajectory: core PCE held at 3.4% year-over-year in May 2026, sitting 140 basis points above the Fed’s 2% target, and gave the committee no basis to pause its tightening sequence even before the September hike arrived.
Here is the same calendar with what a surprise would mean:
| Release | Date | Consensus | Prior | What a surprise signals |
|---|---|---|---|---|
| JOLTS job openings | 30 Sept | 7.23M | 7.271M | Beat = tighter labour market, supports hike |
| Core PCE | 1 Oct | 0.3% m/m; 3.3-3.4% y/y | 3.3% y/y | Above range = October hike more likely |
| ISM Manufacturing PMI | 2 Oct | ~54.9 | n/a | Strong = growth resilience, yields firm |
| Nonfarm payrolls | 3 Oct | ~+84,000 to +90,000 | +162,000 | Weak = hike case weakens sharply |
Payrolls is the number your portfolio is most sensitive to. Consensus of roughly 84,000-90,000 jobs marks a steep deceleration from 162,000 in August. The unemployment rate is projected to hold at 4.1%, with average hourly earnings expected up 0.3% month-over-month.
A print well below consensus would put serious pressure on the case for an October hike. A beat well above consensus would likely push hike odds meaningfully higher. That is the range your holdings will react to.
One caveat deserves emphasis.
The September payrolls figure the Fed uses to make its October decision will be revised in November, after the vote has already happened.
The initial print carries the policy weight even though it may not be the final number. There are also fourteen Fed official speeches scheduled before the week ends, six on Tuesday alone, any of which can nudge expectations between releases.
How the DJIA is positioned heading into this data, and what to watch for
Pull all of that macro pressure onto a chart, and the DJIA tells a story of hesitation rather than conviction. The index has been unable to hold above 52,000 since 21 September, drifting in a range while the market waits for the data to break the tie.
The recent price action, per FXStreet technical analyst Joshua Gibson, sketches the boundaries clearly. Monday’s intraday low sat near 51,400; Friday’s rally topped out just under 51,900. The 51,100-51,200 zone caught the index on both 16 September and 24 September, holding as support twice in the month.
Above the market, the 50-day exponential moving average (EMA), a running average of the last 50 closing prices, sits near 52,400 and has acted as a lid. The index tested it during the 22 September recovery attempt and failed, which tells you where institutional sellers are parked.
There is a flicker of near-term life. The daily Stochastic RSI, a momentum gauge, has turned up from around 22, near the floor of its range, hinting at a possible bounce toward 52,000. A bounce and a genuine trend reversal are two very different things.
Three levels to watch as the data drops this week
Here are the price levels that matter, each tied to the data scenario most likely to test it:
- 52,000 (the invalidation line): A daily close above here would break the current bearish thesis. Strong data that the market reads as “digested” could drive it.
- 51,100-51,200 (the defence): The key support if this week’s data disappoints. A soft payrolls print would likely pressure this zone first.
- 50,300 (the next downside target): The 200-day EMA, the next objective if support breaks. A hot inflation print pushing yields higher could open this path.
For anyone holding DJIA-correlated positions, 52,000 is the line that matters most this week. A confirmed close above it on strong data would suggest the market has absorbed the yield environment and is willing to move higher. A break below 51,100 on a hot PCE print points toward that 200-day EMA near 50,300.
What this week settles, and what it leaves open
By Friday’s close, you will know a great deal more than you do now, but not everything, and it helps to be clear about which is which.
The scenarios split cleanly:
- Data comes in soft: A weak payrolls print plus a cool PCE reading would likely push October hike odds meaningfully lower. That gives yields a reason to ease off 5.2% and hands equities a plausible reason to rally.
- Data comes in hot: A firm print on either metric keeps the October hike as the base case, cements yields near or above 5.2%, and keeps the valuation pressure on your equity holdings in place.
A 5.2% risk-free yield also changes the construction logic for the non-equity portion of a portfolio: a laddered fixed income strategy across TIPS, intermediate Treasuries, and investment-grade corporates can now lock in real returns that were near zero or negative for most of the prior decade.
Even the Friday payrolls figure is provisional, revised weeks after the Fed has voted. That means the central bank is making its call under the same data uncertainty you are, which should temper how much certainty you read into any single headline.
Core PCE on Wednesday is the Fed’s own preferred inflation measure and the least subject to revision, making it the cleanest read on whether this week’s data changes the October calculus.
Keep one thing in view. Markets are already pricing three further quarter-point hikes over the next year beyond a possible October move, which would lift the target range to 4.00%-4.25%. A Fed that tightens into a labour market slowing toward 84,000 jobs a month is accepting more growth risk than at any point in this cycle, and that risk does not vanish on Friday regardless of the numbers.
This article is for informational purposes only and should not be considered financial advice. Investors should conduct their own research and consult with financial professionals before making investment decisions. Past performance does not guarantee future results, and these scenarios are speculative and subject to change based on market developments.