Why Safe Haven Assets Are Failing in 2026, and What Works Now
5 mins ago

Wall Street responded aggressively early Wednesday morning as shares in the artisan e-commerce platform surged up to 8.5% following an unexpected return to transaction volume growth. Released on 29 April 2026, the first quarter financial results prove that corporate turnaround efforts are gaining traction. This performance decisively breaks a two-year streak of stagnant or declining consumer engagement.
An analysis of this latest Etsy earnings report reveals how the company is restructuring its operational focus to drive profitability. Market sentiment shifted rapidly as the data demonstrated real improvements in underlying buyer activity rather than just fee-driven revenue growth.
This article breaks down the quarterly performance metrics and analyses the recovering buyer engagement data. It also explores how shedding a major subsidiary is reshaping the company’s future trajectory. Understanding these mechanics provides necessary context for evaluating the sustainability of this recent market rally.
The immediate scale of the financial turnaround became evident early Wednesday morning, delivering the surprise upside that triggered the early trading surge. According to company data, Etsy generated a total quarterly income of $631.3 million, decisively beating the $621.1 million consensus estimate set by market analysts.
According to company data, this top-line achievement stems directly from a 7.6% annual expansion in core platform revenue. The core business growth successfully masked slight weakness elsewhere in the financial profile.
The complete Etsy Q1 2026 financial results filing details the specific revenue recognition changes associated with these core platform growth metrics, allowing investors to verify the underlying operational efficiency.
According to company data, modified per-share profits came in at $0.60, falling slightly under the $0.61 expectation. Despite this minor earnings miss, the broader operational efficiency remains completely intact. According to company data, adjusted EBITDA reached $185 million, representing a highly favourable 29.3% profitability margin for the first three months of 2026.
Investors need to see exactly where the company beat consensus estimates to understand this market reaction. The following table illustrates whether the 8.5% stock surge is driven by fundamental business improvements or temporary market dynamics.
| Metric | Q1 2026 Actual | Wall Street Estimate | Performance vs Expectation |
|---|---|---|---|
| Total Quarterly Income | $631.3M | $621.1M | Beat |
| Modified Per-Share Profits | $0.60 | $0.61 | Miss |
| Core Platform Revenue Growth | 7.6% | N/A | Strong |
The financial win relies entirely on the actual volume of goods being traded on the core marketplace. Transitioning from corporate revenue to actual platform activity reveals the true health of the ecosystem. For the first time in more than twenty-four months, total transaction volume registered an annual expansion.
Core marketplace Gross Merchandise Sales rebounded to $2.5 billion, representing a 5.5% year-over-year increase. This positive momentum compares highly favourably to the 0.5% contraction recorded in the fourth quarter of 2025.
Revenue can be manipulated by raising seller fees, but gross merchandise sales and active buyer counts reveal the underlying health of consumer demand. The platform recorded a notable influx of both new and reactivated purchasing accounts.
Much of this newly generated traffic stems from growth in mobile app shoppers, indicating that interface improvements are effectively capturing users who prefer to browse on handheld devices.
Key user engagement metrics highlight this demand recovery: Active buyers reached 86.6 million across the primary platform. Gross buyer additions totalled 11.9 million during the quarter. * These additions represent an increase of 4.8% annually.
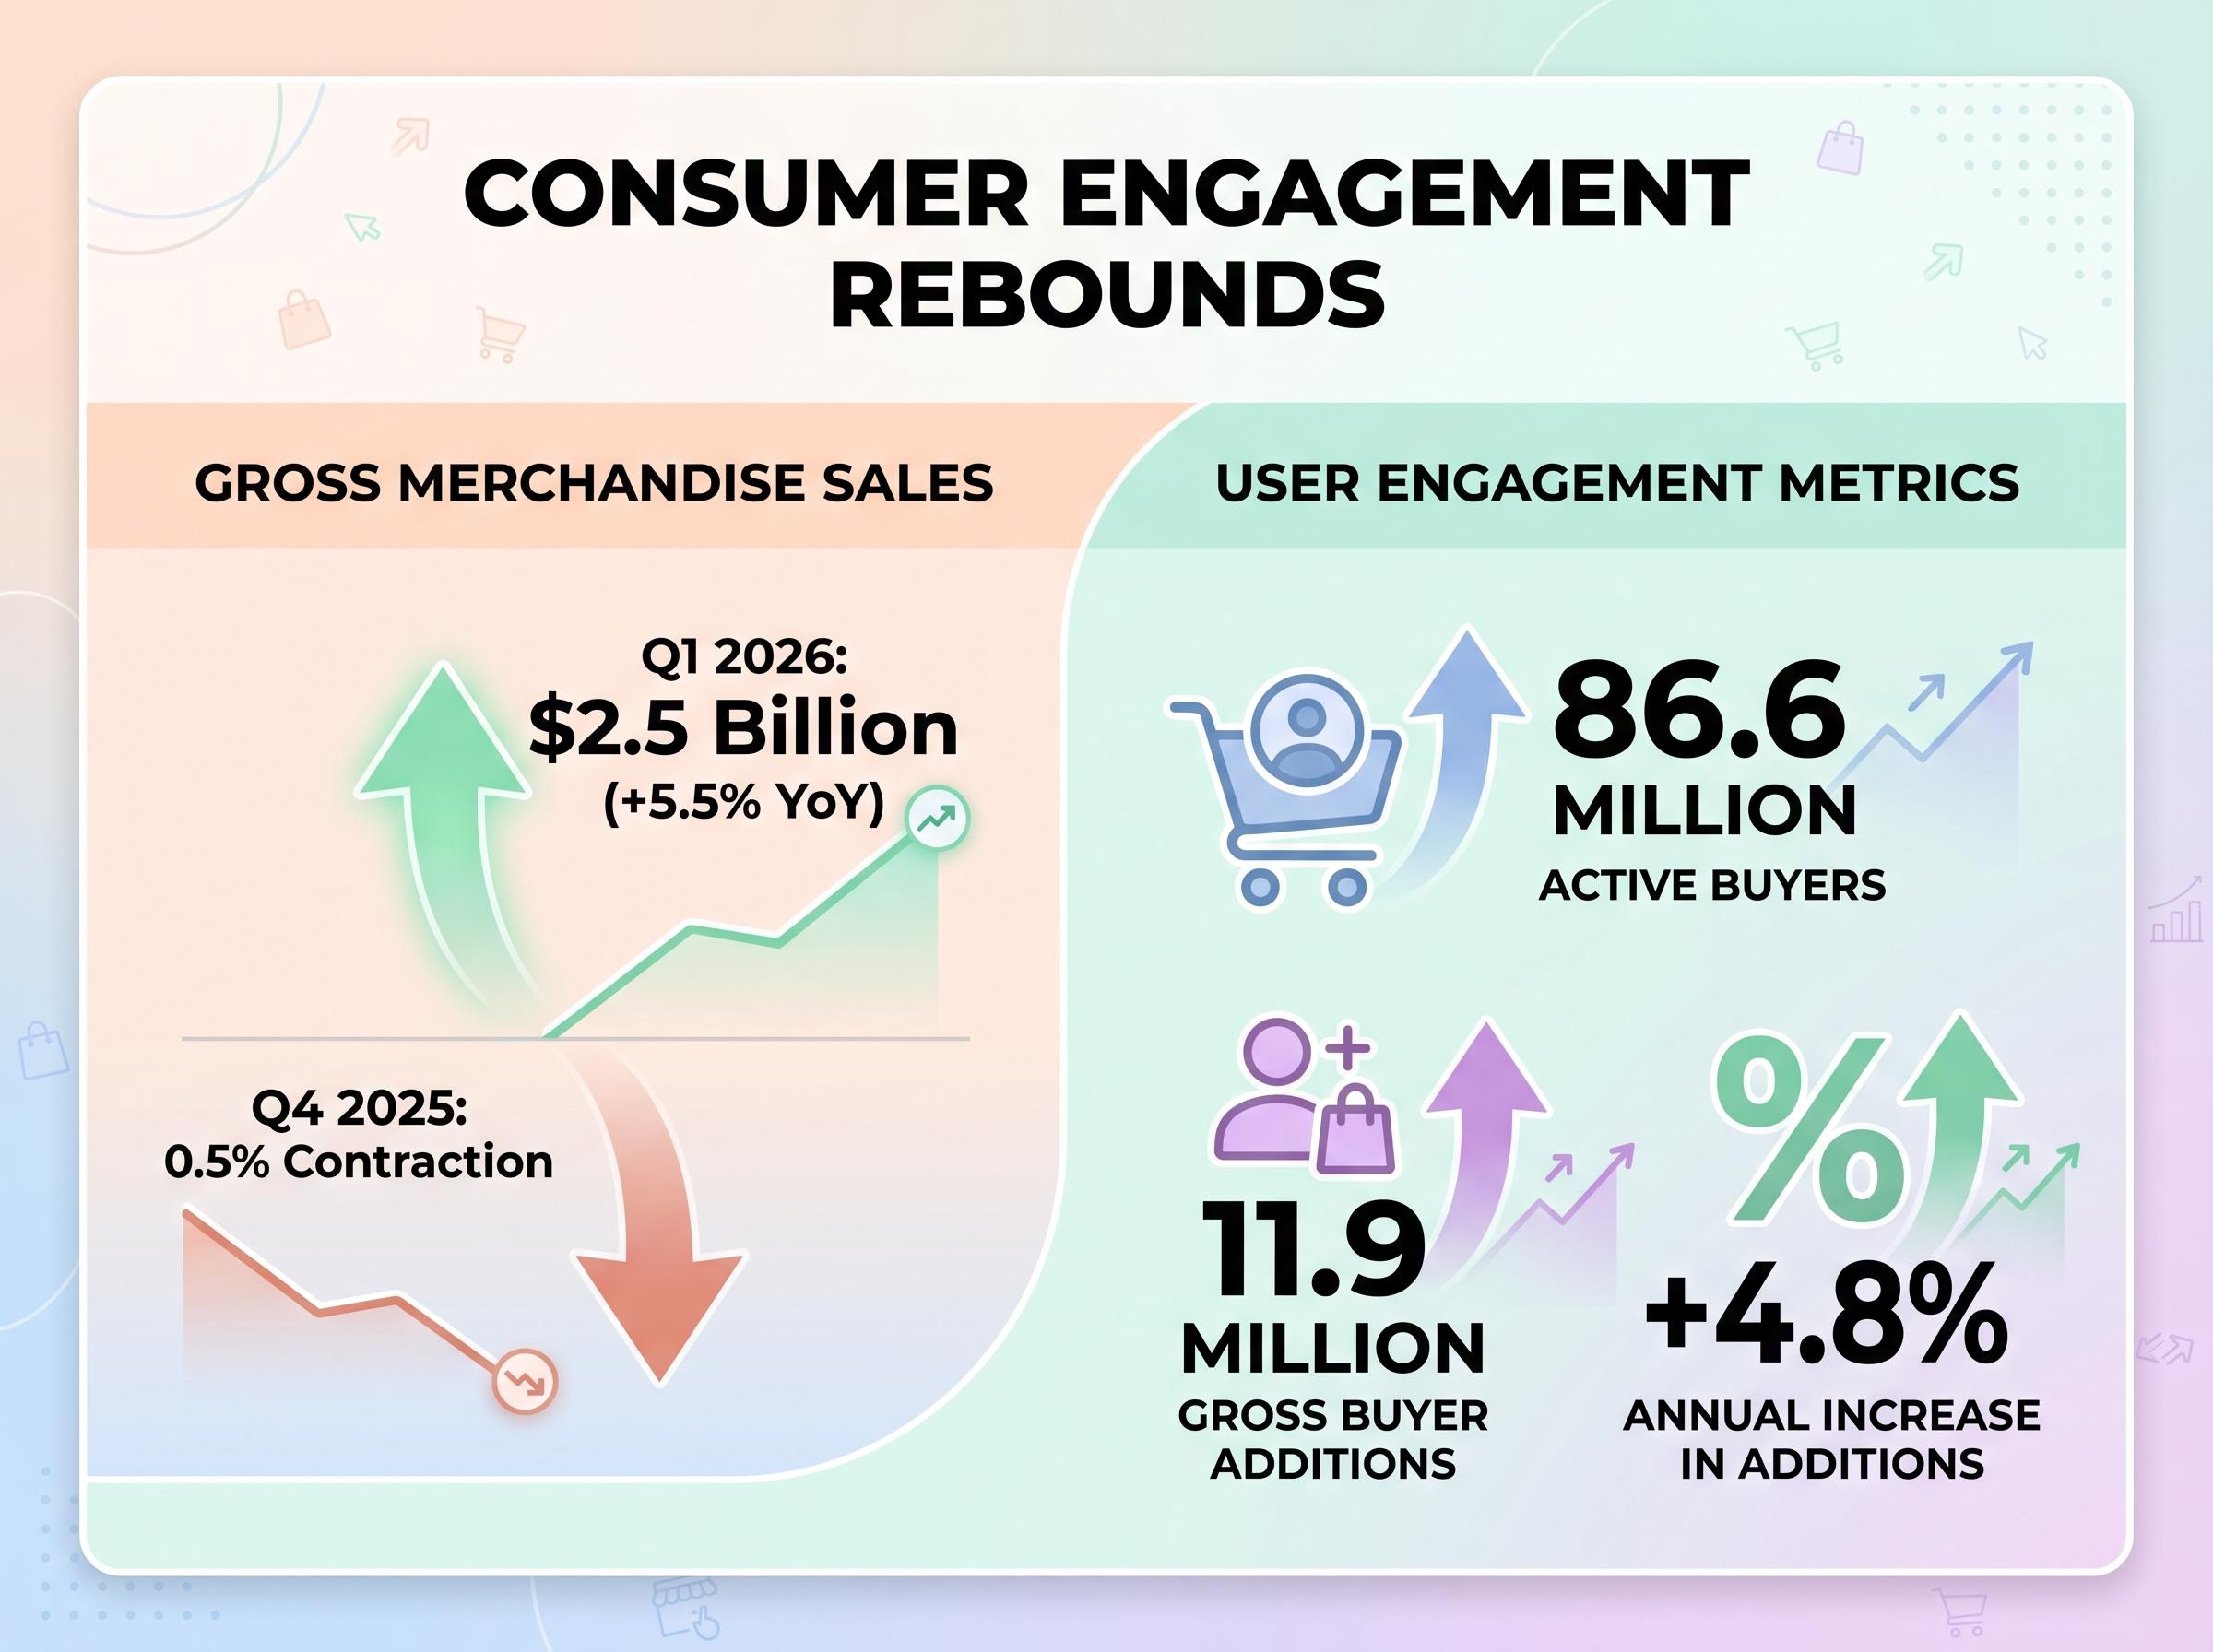
The platform successfully drew back previous users alongside acquiring fresh accounts to drive this volume expansion. Pre-earnings previews had noted general softening trends in buyer engagement, with purchase frequency settling at roughly three times per year. Reversing this trend required targeted marketing efforts that successfully reactivated dormant purchasing accounts.
Understanding corporate earnings requires distinguishing between transaction volume and actual corporate revenue. Gross Merchandise Sales measures the total dollar value of all goods sold between independent buyers and sellers across the platform.
Corporate revenue represents only the portion the company keeps. This fee capture rate includes transaction fees, listing fees, and advertising services charged to the participating merchants.
When companies prepare to sell subsidiaries, they alter how these metrics are reported using continuing operations accounting. The core $2.5 billion transaction volume deliberately excludes operations from businesses slated for sale. Consolidated figures would otherwise obscure the fundamental health of the primary marketplace.
This accounting distinction ensures retail investors can accurately interpret the data. It prevents headline figures from being artificially inflated or depressed by departing business units. By isolating the continuing operations, analysts can evaluate the true growth trajectory of the remaining business.
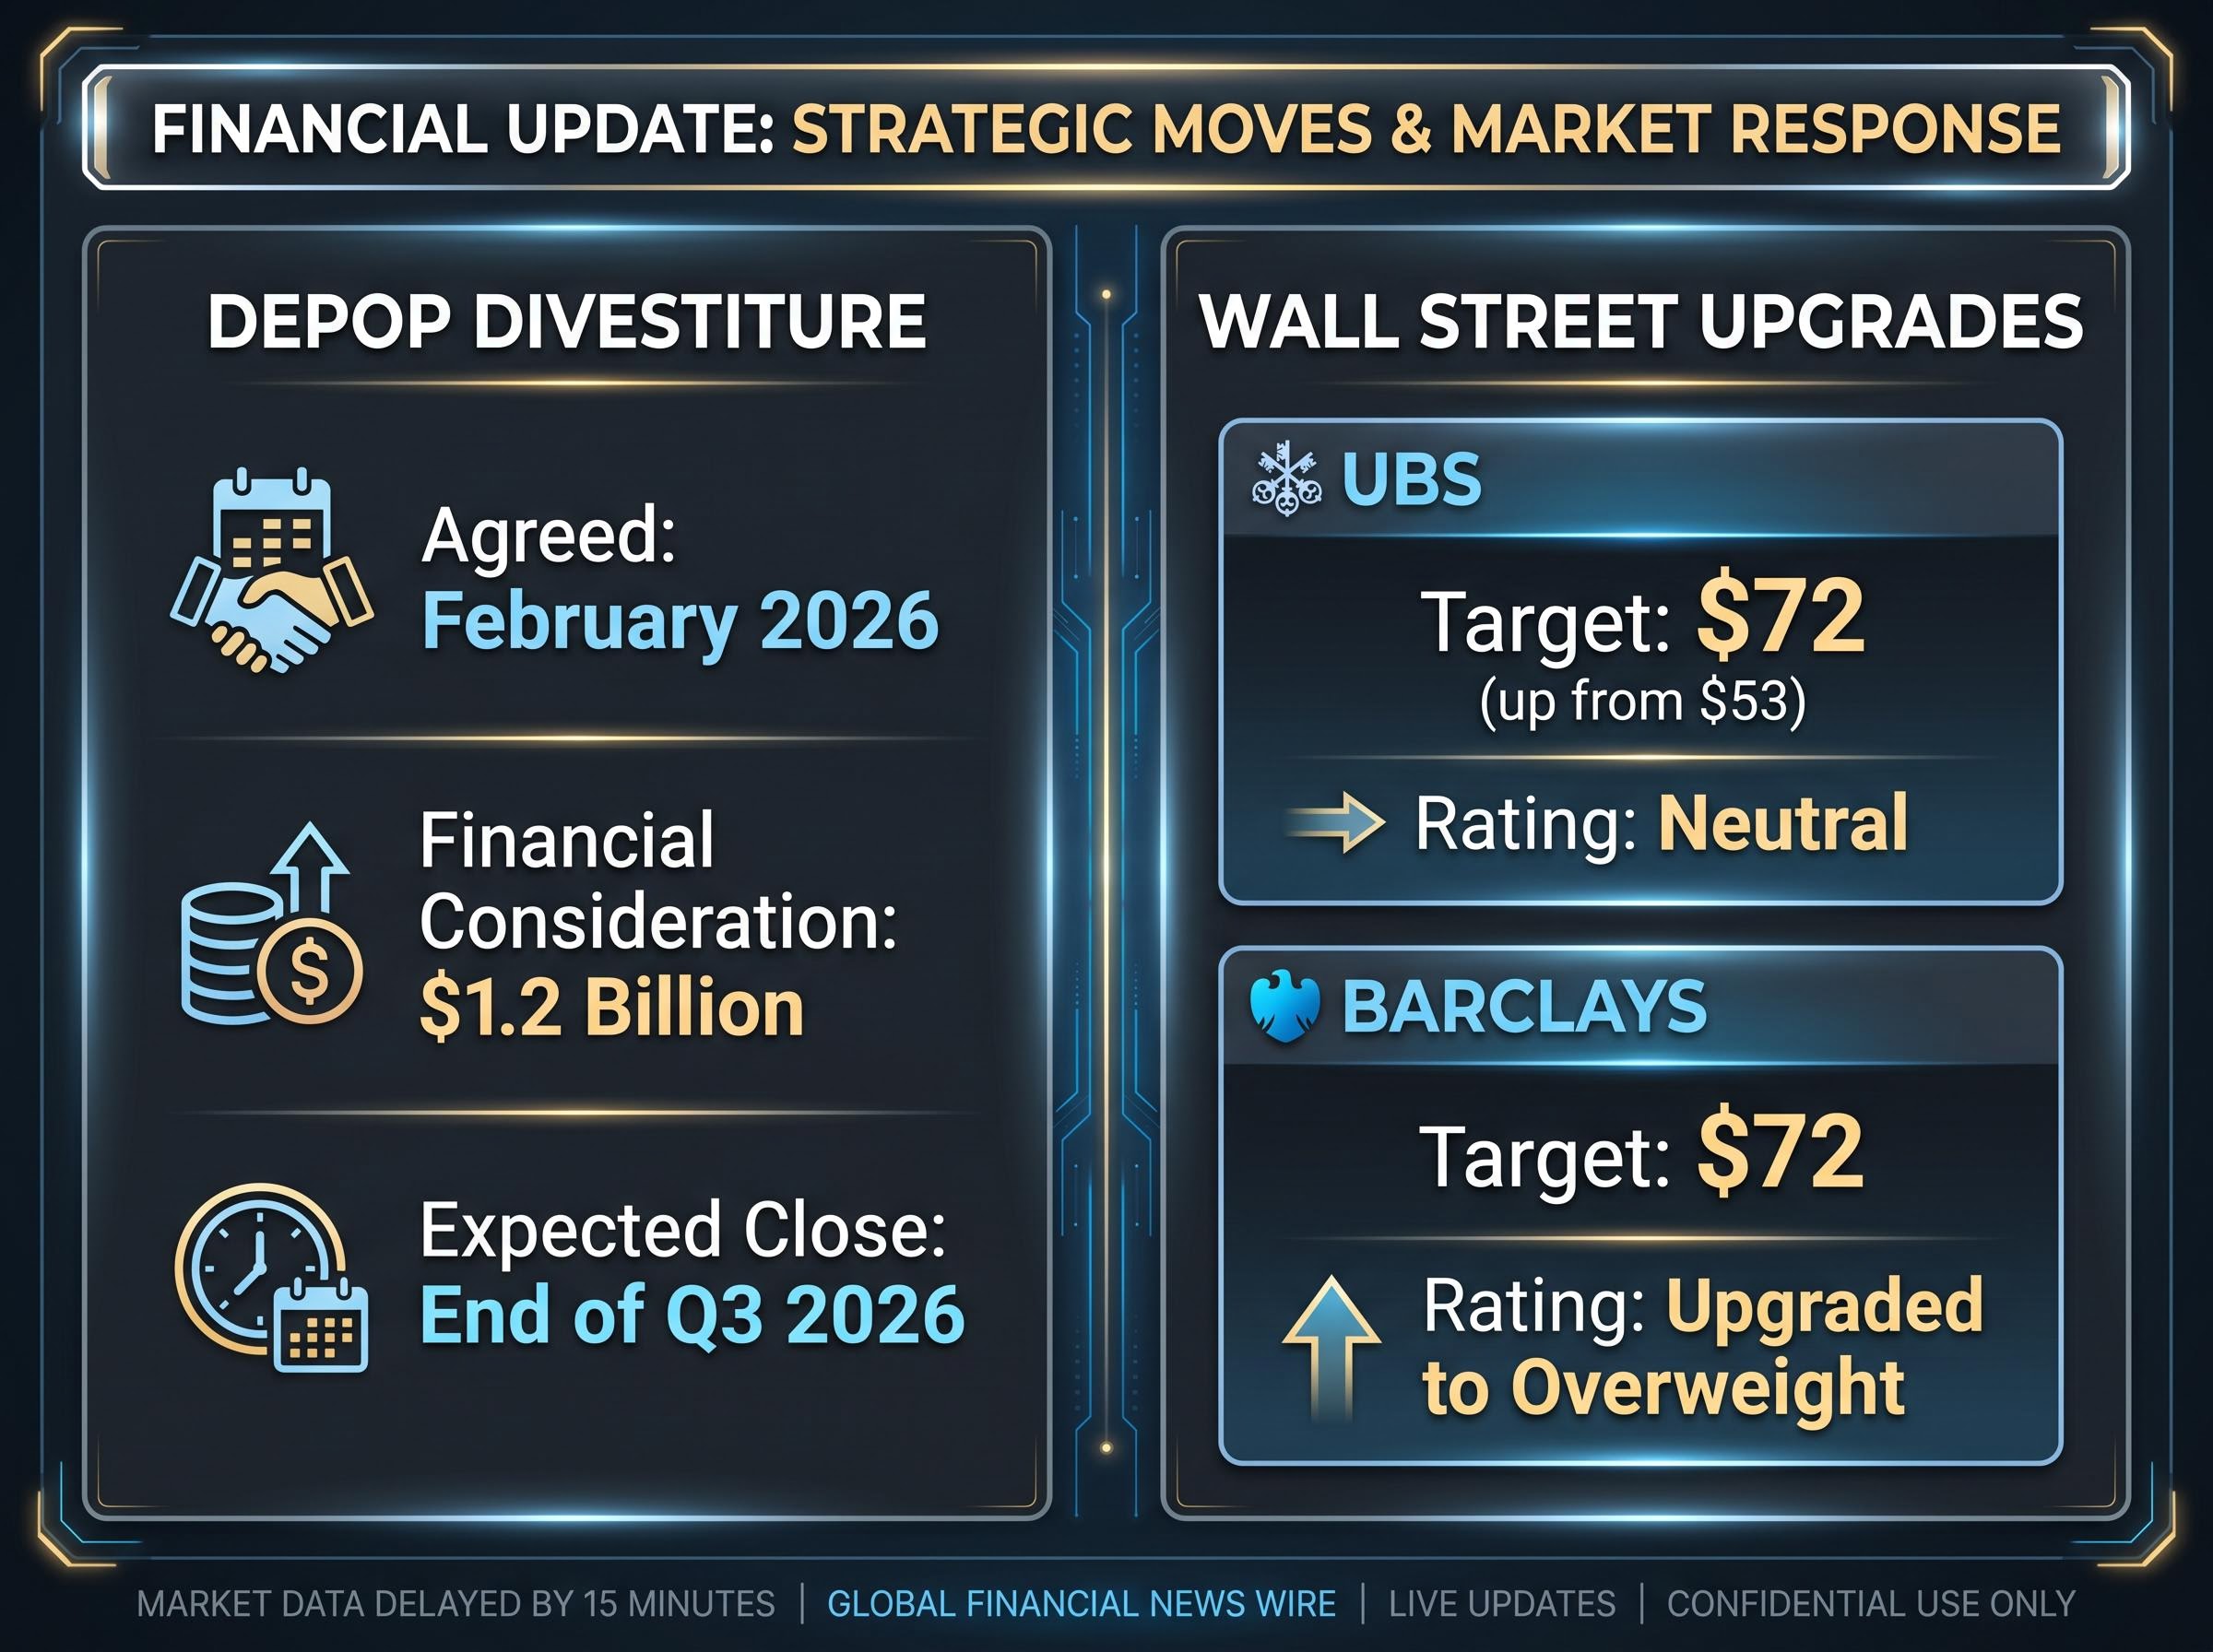
The current operational wins are heavily influenced by a deliberate narrowing of corporate focus. In February 2026, management established a definitive agreement to offload its apparel resale subsidiary.
This divestiture removes a former growth vector while simultaneously solidifying the balance sheet. The subsidiary is being acquired for a financial consideration of $1.2 billion, providing immediate liquidity to the parent organisation. Management expects the transaction to close by the end of the third quarter of 2026.
Financial reporting on the eBay acquisition of Depop notes that this massive cash transaction shifts competitive dynamics across the broader online resale sector.
This move functions as a strategic consolidation, allowing management to refocus resources entirely on the primary artisan marketplace. Selling a major asset to a chief rival fundamentally alters the company’s competitive footprint in the broader e-commerce sector. It also directly informs the updated forward guidance and recent analyst optimism.
Analyst Perspective “The $1.2 billion capital injection significantly alters the company’s financial flexibility. It provides necessary resources to defend market share in its primary artisan category while eliminating the operational distraction of secondary platforms.”
The immediate stock surge contrasts sharply with the relatively modest, single-digit growth forecasts projected for the remainder of the year. Management projects second-quarter transaction volume will land between $2.38 billion and $2.43 billion. This implies a 3% to 5% annual expansion.
Full-year adjusted EBITDA margins are anticipated to remain stable. Understanding these specific expectations allows investors to calibrate their positions against newly upgraded Wall Street price targets. Past performance does not guarantee future results, and these forward-looking statements depend on sustained consumer demand.
Analysts will be closely monitoring the average spend per user in upcoming quarters to confirm that these stable margins are not masking a shift toward lower-priced items.
Major financial institutions have revised their outlooks based on the combined earnings beat and structural changes:
The first quarter performance demonstrates that shedding peripheral businesses has coincided with a revitalisation of the core marketplace. Core revenue expanded, transaction volumes rebounded, and active buyer counts improved against analyst expectations.
The execution risks heading into the second half of 2026 will centre on sustaining this momentum within the primary artisan segment. The impending capital injection from the subsidiary sale provides resources, but management must still adapt to cautious consumer spending trends.
For investors exploring how other major consumer brands are navigating these macroeconomic headwinds, our dedicated guide to Starbucks’ turnaround strategy explores the operational efficiencies and digital engagement models being deployed across the broader retail sector.
This article is for informational purposes only and should not be considered financial advice. Investors should conduct their own research and consult with financial professionals before making investment decisions. Past performance does not guarantee future results. Financial projections are subject to market conditions and various risk factors.
Etsy's Q1 2026 earnings report showed total quarterly income of $631.3 million, beating estimates, and a 7.6% expansion in core platform revenue. This performance broke a two-year streak of stagnant consumer engagement.
Core marketplace Gross Merchandise Sales rebounded to $2.5 billion, representing a 5.5% year-over-year increase. This positive momentum reversed the 0.5% contraction seen in Q4 2025.
Etsy's stock surged up to 8.5% because the company surpassed Wall Street's total income projections and demonstrated a decisive return to transaction volume growth. This indicated successful corporate turnaround efforts.
The divestiture of Depop for $1.2 billion provides Etsy with immediate liquidity and allows management to refocus resources entirely on its primary artisan marketplace. This move alters competitive dynamics and informs updated forward guidance.
Management projects second-quarter transaction volume will be between $2.38 billion and $2.43 billion, implying a 3% to 5% annual expansion.