Most Australian retail investors treat the Aussie dollar and gold as entirely separate positions. One is a currency bet shaped by local economics, interest rate expectations, and risk appetite. The other is a universal store of value, a hedge against uncertainty. When both fall at the same time, and for the same reason, the mechanism behind it is worth understanding.
Across 2024 and into 2025, a resurgent US dollar, driven by elevated Treasury yields and persistent “higher-for-longer” Federal Reserve policy expectations, simultaneously undermined both AUD/USD and gold. The coincidence was not accidental. It reflected a structural relationship between US monetary conditions, the dollar’s global pricing role, and the two distinct channels through which dollar strength flows into these assets.
What follows explains the shared macro driver behind that dual weakness, why each asset responds to US dollar strength through its own mechanism, how technical price structures reflected those conditions, and what Australian investors should understand about the compounding exposure they may not realise they carry.
Why the US dollar became the key variable for both assets at once
Two assets, different market categories, falling in tandem. The pattern repeated across late 2024 and into 2025, and the explanation ran through a single upstream variable: the US dollar.
The dollar’s strengthening during this period was driven by a specific set of conditions:
- Elevated US Treasury yields, with the 30-year surpassing 5.2%, its highest level since 2007
- Federal Reserve communications reinforcing a “higher-for-longer” rate stance, including the December 2024 dot plot and Chair Powell’s subsequent remarks
- Sticky US inflation data that delayed market expectations for rate cuts, keeping dollar demand sustained rather than temporary
Sticky US inflation data extends the higher-for-longer cycle by delaying rate-cut expectations; the April 2026 CPI reading of 3.8% year-over-year demonstrated this dynamic in real time, simultaneously pushing the Dollar Index toward a technically significant supply zone and stalling both gold and AUD/USD at their own key resistance levels.
The US 30-year Treasury yield surpassed 5.2% during this period, reaching levels not seen since 2007, anchoring the yield environment that powered the dollar’s ascent.
The dollar’s role here is not simply as one input among many. Gold is invoiced in USD on global markets. AUD/USD is a direct exchange rate against the dollar. Both assets are mechanically exposed to the same upstream variable. When Reuters reported in October 2024 and January 2025 that higher US 10-year yields and firmer Fed expectations had pushed AUD/USD to multi-week lows, the same forces were simultaneously weighing on gold.
Reuters coverage following the December 2024 Fed meeting confirmed the link: the updated dot plot and Powell’s remarks reinforced “higher-for-longer,” lifted the dollar, and pressured both gold and AUD/USD at once. Understanding that a single macro variable can create correlated losses across seemingly unrelated positions is foundational for any investor who believes they are diversified between forex and commodity exposure.
When big ASX news breaks, our subscribers know first
The mechanics of how Treasury yields feed into dollar strength
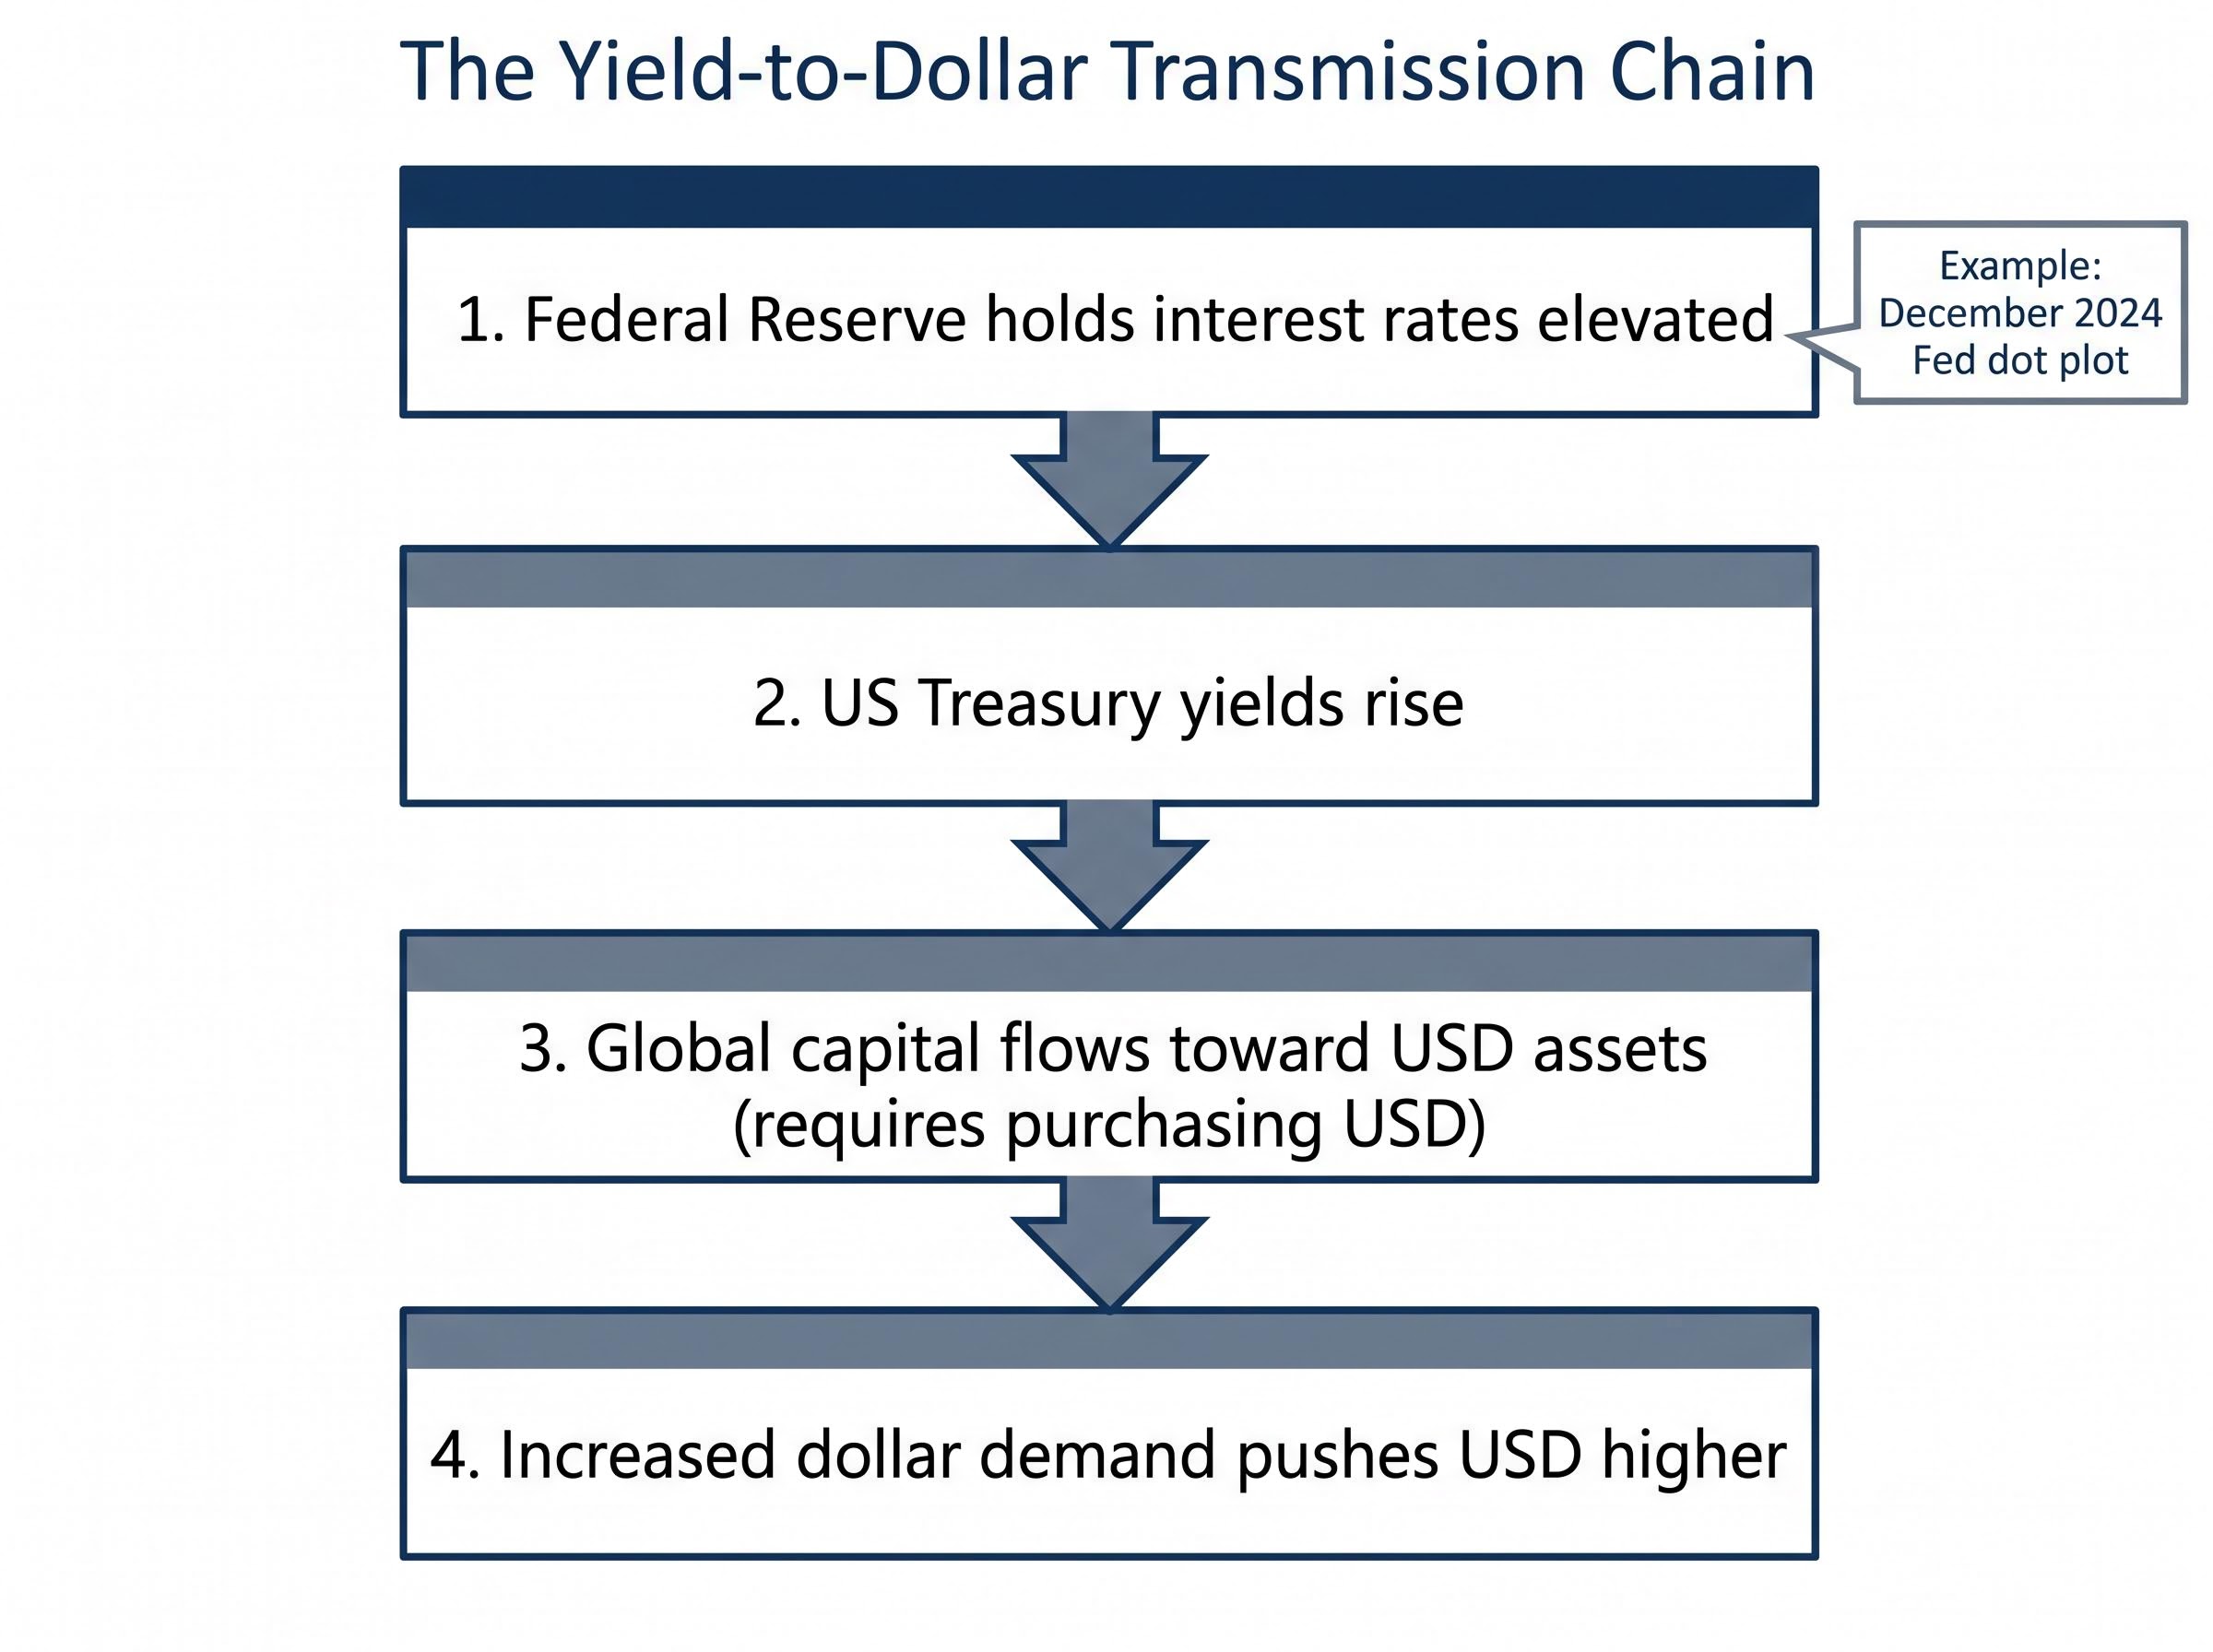
The yield-to-dollar relationship is often cited but rarely walked through. The transmission chain runs through four sequential steps:
- The Federal Reserve holds interest rates elevated (or signals it intends to)
- US Treasury yields rise as bond markets price in sustained higher rates
- Global capital flows toward USD-denominated assets to capture those higher yields, which requires purchasing US dollars
- The resulting increase in dollar demand pushes the USD higher against other currencies
Each step feeds the next. When the Fed’s December 2024 dot plot reinforced “higher-for-longer,” it extended the time horizon over which US-dollar-denominated assets would outperform on a yield basis. That sustained, rather than temporarily spiked, dollar demand.
The Federal Reserve December 2024 dot plot projections showed policymakers revising their expected rate-cut path upward, signalling fewer cuts than markets had priced in and directly extending the higher-for-longer yield environment that sustained dollar demand into early 2025.
The Australia-US interest rate differential is a direct input to AUD/USD pricing. Reuters reporting across October 2024 and January 2025 identified this spread as a primary driver of the Aussie’s weakness. By 29 January 2025, Reuters noted that markets had pushed back expectations for aggressive Fed rate cuts, with higher US front-end yields keeping the dollar firm.
The Federal Reserve Beige Book, published eight times per year, provided ongoing updates on inflation and economic activity conditions throughout 2025, consistently informing the cautious easing expectations that kept the dollar supported.
Real yields and the specific pressure on non-yielding assets
Real yield is the return on a bond after stripping out expected inflation. When inflation expectations hold steady but nominal yields rise, the real return available from holding US Treasuries increases.
Gold pays no coupon or dividend. When the real return from US bonds rises, gold becomes comparatively less attractive to hold, because the opportunity cost of sitting in a non-yielding asset increases. This applies downward price pressure to gold regardless of its safe-haven qualities.
This mechanism is distinct from gold’s role as a hedge against geopolitical uncertainty. In a yield-driven dollar-strength environment, the yield signal can temporarily override the safe-haven signal, a point that matters when interpreting gold’s price behaviour during periods like 2024-2025.
The inverse relationship between gold and rising Treasury yields is not a recent phenomenon; historical episodes including the 2013 Taper Tantrum produced gold drawdowns of around 28% as yields and the dollar surged simultaneously, providing a reference point for the magnitude of pressure the current rate environment can exert.
How AUD/USD responds to a stronger dollar and what the charts showed
AUD/USD is sensitive to USD strength through two channels. The first is mechanical: a stronger dollar means fewer US dollars per Australian dollar by definition. The second runs through the interest rate differential between Australia and the US, which narrows or inverts when Fed policy is tighter relative to the Reserve Bank of Australia (RBA).
The Aussie dollar had previously benefited from broad-based USD weakness and improved risk appetite, which makes the speed of the reversal instructive. When conditions shifted, AUD/USD failed to sustain a move above the 0.7230 resistance level, a price last reached in June 2022.
The 0.7230 resistance level, corresponding to highs last seen in June 2022, marked the point where the AUD/USD rally stalled and reversed under renewed dollar strength.
The pair subsequently broke below its ascending channel. Momentum indicators retreated from overbought readings, confirming the shift from uptrend to defensive positioning.
| Level Type | Price Level | Significance |
|---|---|---|
| Upside resistance | 0.7200-0.7230 | Prior breakout zone; capped further gains |
| Immediate support | 0.7090 | Near-term floor following the reversal |
| Substantial support | 0.6980 | Deeper support if immediate level fails |
The broader longer-term trend remained constructive despite the near-term headwinds, providing balance to the bearish short-term picture. For Australian retail traders, these levels illustrate how macro-driven technical structures form and why they serve as reference points during dollar-strength episodes.
AUD/USD technical levels provide a precise lens for how macro pressure translates into price structure; the 98-pip compression seen across the Trump-Xi summit period, with the pair closing at 0.7160 after opening near 0.7258, is a recent illustration of how yield differentials, commodity headwinds, and unresolved trade risk combine to create sharp two-day moves within familiar resistance zones.
Gold’s separate but related vulnerability to the same driver
Gold’s response to the same macro driver runs through a different mechanism than AUD/USD. Because gold is denominated in USD on global markets, a stronger dollar makes the metal more expensive for buyers using other currencies. That reduces international demand and applies downward pressure on the USD price itself.
During this period, gold traded below US$4,500 per ounce, with momentum indicators weakening after the breach below that level. The shift from a momentum-driven rally to defensive consolidation was visible in the technical structure: the metal traded below descending trend resistance, and buyers failed to reclaim the prior support zone with conviction.
| Level Type | Price Level | Role |
|---|---|---|
| Initial downside support | US$4,360 | 200-Day Simple Moving Average |
| Structural support | US$4,120 | Deeper structural floor |
| First upside resistance | US$4,720 | Initial resistance on recovery |
| Heavier resistance zone | US$4,880 | Major overhead cap |
By May 2025, Reuters reported spot gold around US$3,28x/oz to US$3,31x/oz, with analysts pointing to the interplay of dollar moves, Treasury yields, and Fed rate-cut timing as the main price drivers. The same variables that defined the 2024 episode were still active months later.
When safe-haven demand competes with the yield headwind
Gold did not collapse under dollar strength. It consolidated. The reason lies in the competing force of safe-haven demand.
Geopolitical risk, including sustained oil price pressure above US$104 per barrel during part of the source period, supported demand for gold as a protective asset even as the yield environment pushed in the opposite direction. When real yields were expected to eventually moderate, as analysts anticipated later in 2025, gold received forward-looking support that floored the price above what pure yield mechanics would imply.
The balance between these two forces, yield headwind versus safe-haven bid, determines whether gold merely consolidates under dollar strength or actively declines. Knowing which force is dominant at any given moment gives investors a more nuanced view of when gold is likely to diverge from a pure dollar-inverse relationship.
The compounding problem for Australian investors holding both
When AUD/USD falls at the same time as the USD price of gold falls, Australian investors in gold face losses on two fronts simultaneously. The asset price declines in USD terms, and the AUD-to-USD conversion rate amplifies that loss when translated back into local currency.
This is the specific compounding mechanism that makes dollar-strength episodes particularly punishing for Australian portfolios:
- The USD gold price declines, reducing the value of the holding in its pricing currency
- AUD/USD depreciates, meaning each US dollar of remaining value converts back to fewer Australian dollars
- The combined local-currency gold return understates what the USD price move alone would suggest, because the exchange rate loss stacks on top
Reuters Australia reported in January 2025 on the “double impact” facing Australian retail investors: imported inflation and FX effects on AUD assets, alongside lower local-currency valuations for USD-priced commodities such as gold.
In a different macro environment, a falling AUD would partially offset a rising USD gold price, acting as a natural hedge. A weaker Australian dollar makes each US dollar of gold worth more in local terms. But during dollar-strength episodes, that offset disappears precisely when it would be most useful, because the same force pushing gold down is also pushing the Aussie down.
The rate differential channel reinforces the effect. When the Fed holds rates higher relative to the RBA, AUD/USD faces structural pressure on top of the gold effect. As Reuters Australia noted in October 2024, a stronger USD erodes returns for Australian investors holding gold by reducing the local-currency value of holdings converted back to AUD.
Australian investors who believe they are diversified between a currency position and a commodity position may, during these episodes, be holding two expressions of the same underlying USD-sensitivity.
What this relationship means the next time the dollar strengthens
Understanding what happened is useful. Recognising what to watch for next is more so. The signals that precede a dollar-strength episode of this type are identifiable, and they tend to converge before the asset-level effects become visible.
Four forward-looking signals to monitor:
- US 10-year and 30-year Treasury yield direction: sustained moves higher in these benchmarks are the clearest lead indicator of dollar strength
- Fed dot plot and official communications: the December 2024 dot plot was the specific catalyst Reuters identified as reinforcing dollar strength and pressuring both assets
- US inflation data versus expectations: sticky readings that reduce rate-cut expectations extend the higher-for-longer cycle
- AUD/USD and gold technical levels relative to key support and resistance: breaks below established support zones confirm that the macro pressure is translating into price
When these signals converge, the standard assumption that different asset classes diversify each other may not hold. Australian investors holding AUD/USD positions or gold should anticipate correlation risk during these episodes.
Reuters reported in May 2025 that gold near US$3,31x/oz was driven by renewed focus on Fed policy uncertainty and dollar direction, confirming that the same variables remained active well beyond the initial 2024 episode. The Federal Reserve Beige Book, published eight times per year, provides an ongoing data source for the inflation and activity conditions that inform these expectations.
The reverse scenario: when dollar weakness lifts both assets
The same framework works in mirror image. When the Fed pivots toward rate cuts, Treasury yields decline, real yields fall, capital flows away from USD assets, and the dollar softens.
In that environment, gold becomes cheaper for non-USD buyers, boosting international demand, while AUD/USD tends to appreciate as the rate differential narrows in Australia’s favour and risk appetite improves. Understanding the shared driver means investors can use one asset’s early signal to anticipate the other’s likely direction, rather than treating each price move in isolation.
Two assets, one driver, and why that distinction matters for Australian portfolios
AUD/USD and gold look like different assets because they occupy different market categories. One is a currency pair, the other a commodity. But in a dollar-strength environment, they converge on a single upstream variable, and that convergence is structural, not coincidental.
The technical breakdowns observed in both assets during 2024-2025 reflected macro conditions rather than asset-specific weakness. The same variables, US Treasury yields, Fed policy expectations, dollar direction, drove both, and Reuters coverage from October 2024 through May 2025 confirmed the persistence of this dynamic across multiple quarters. The ASX 200 faced a related pressure during the same period, with rate-sensitive sectors selling off as Treasury yields surged, broadening the picture of how US monetary conditions cascade into Australian market conditions.
Three core takeaways:
- USD strength driven by yields and Fed policy applies simultaneous pressure to both AUD/USD and gold through distinct but related channels
- Australian investors in gold face a compounding loss when AUD/USD depreciates at the same time, removing the natural currency hedge that would otherwise partially offset USD-priced asset declines
- The same framework applies in reverse when the dollar softens, providing a monitoring tool that works in both directions
The analysis above is not a trading signal. It is a framework for recognising when two positions that appear diversified are, in practice, expressing the same macro risk.
For investors wanting to extend this macro framework beyond AUD and commodity positions into broader portfolio valuation, our deep-dive into the Dow-to-gold ratio examines how gold’s sustained outperformance against US equities since 2025 reshapes long-horizon real purchasing power calculations, including the historical ratio extremes that have marked secular turning points between equity and gold cycles.
This article is for informational purposes only and should not be considered financial advice. Investors should conduct their own research and consult with financial professionals before making investment decisions.
Past performance does not guarantee future results. Financial projections are subject to market conditions and various risk factors.