Most traders assume every chart needs a clock. Renko charts were built on the opposite premise: that time is noise, and only price movement deserves a place on the chart. Originating in Japan’s Edo-period rice markets, Renko strips away the time axis entirely, plotting uniform bricks only when price travels a defined distance. The result is a chart that compresses quiet markets into silence and expands volatile ones into clear directional staircases.
Despite centuries of use in Japanese trading tradition, Renko remains unfamiliar to many retail traders whose experience sits entirely within candlestick or bar charts. As platforms like TradingView, OANDA, IG, and CMC Markets continue to promote alternative charting methods in their educational materials, more traders are encountering Renko for the first time. What follows is a complete beginner’s framework: where Renko came from, the three rules that govern its construction, how brick sizing affects everything visible on the chart, the conditions where Renko genuinely helps, and the structural limitations every trader should understand before relying on one.
The Japanese rice markets that gave Renko its name
Renko’s origins sit in the commodity trading halls of Edo-period Japan (1603-1868), the same era and market culture that produced candlestick charting. Rice was the dominant traded commodity, and Japanese merchants needed methods to track directional price change without being distracted by the passage of time between trades.
The JPX’s Dojima Rice Exchange history documents how the Edo-period commodity markets formalised price-threshold tracking among rice merchants, establishing the institutional trading culture from which both candlestick and Renko charting methods eventually emerged.
The solution was a chart built entirely from price thresholds. A new unit appeared only when rice prices moved a defined amount. If price stayed flat for days, the chart stayed flat too. If price surged in a single session, the chart expanded accordingly.
Renko’s entire premise rests on a view of markets where price movement carries the meaningful signal, and time is simply the medium through which that movement is delivered; price discovery mechanics, including how competing bids and offers continuously reprice assets through order book auctions, explain why a chart that measures distance rather than duration can still capture the essential information a trader needs.
“The word Renko derives from the Japanese ‘renga,’ meaning brick, a name that describes exactly how the chart is built.”
That etymology matters because it anchors the visual metaphor that carries through every aspect of Renko’s design. Each unit on the chart is a uniform rectangular brick, identical in size to every other, stacked diagonally like courses in a wall. As Cedric Thompson (CMT, CFA) noted in a May 2026 FXEmpire synthesis of Renko’s history, the method shares a direct lineage with candlestick charts but solves a fundamentally different problem: filtering time out of the picture so that price direction becomes the only signal.
When big ASX news breaks, our subscribers know first
What a Renko chart actually looks like (and why it surprises newcomers)
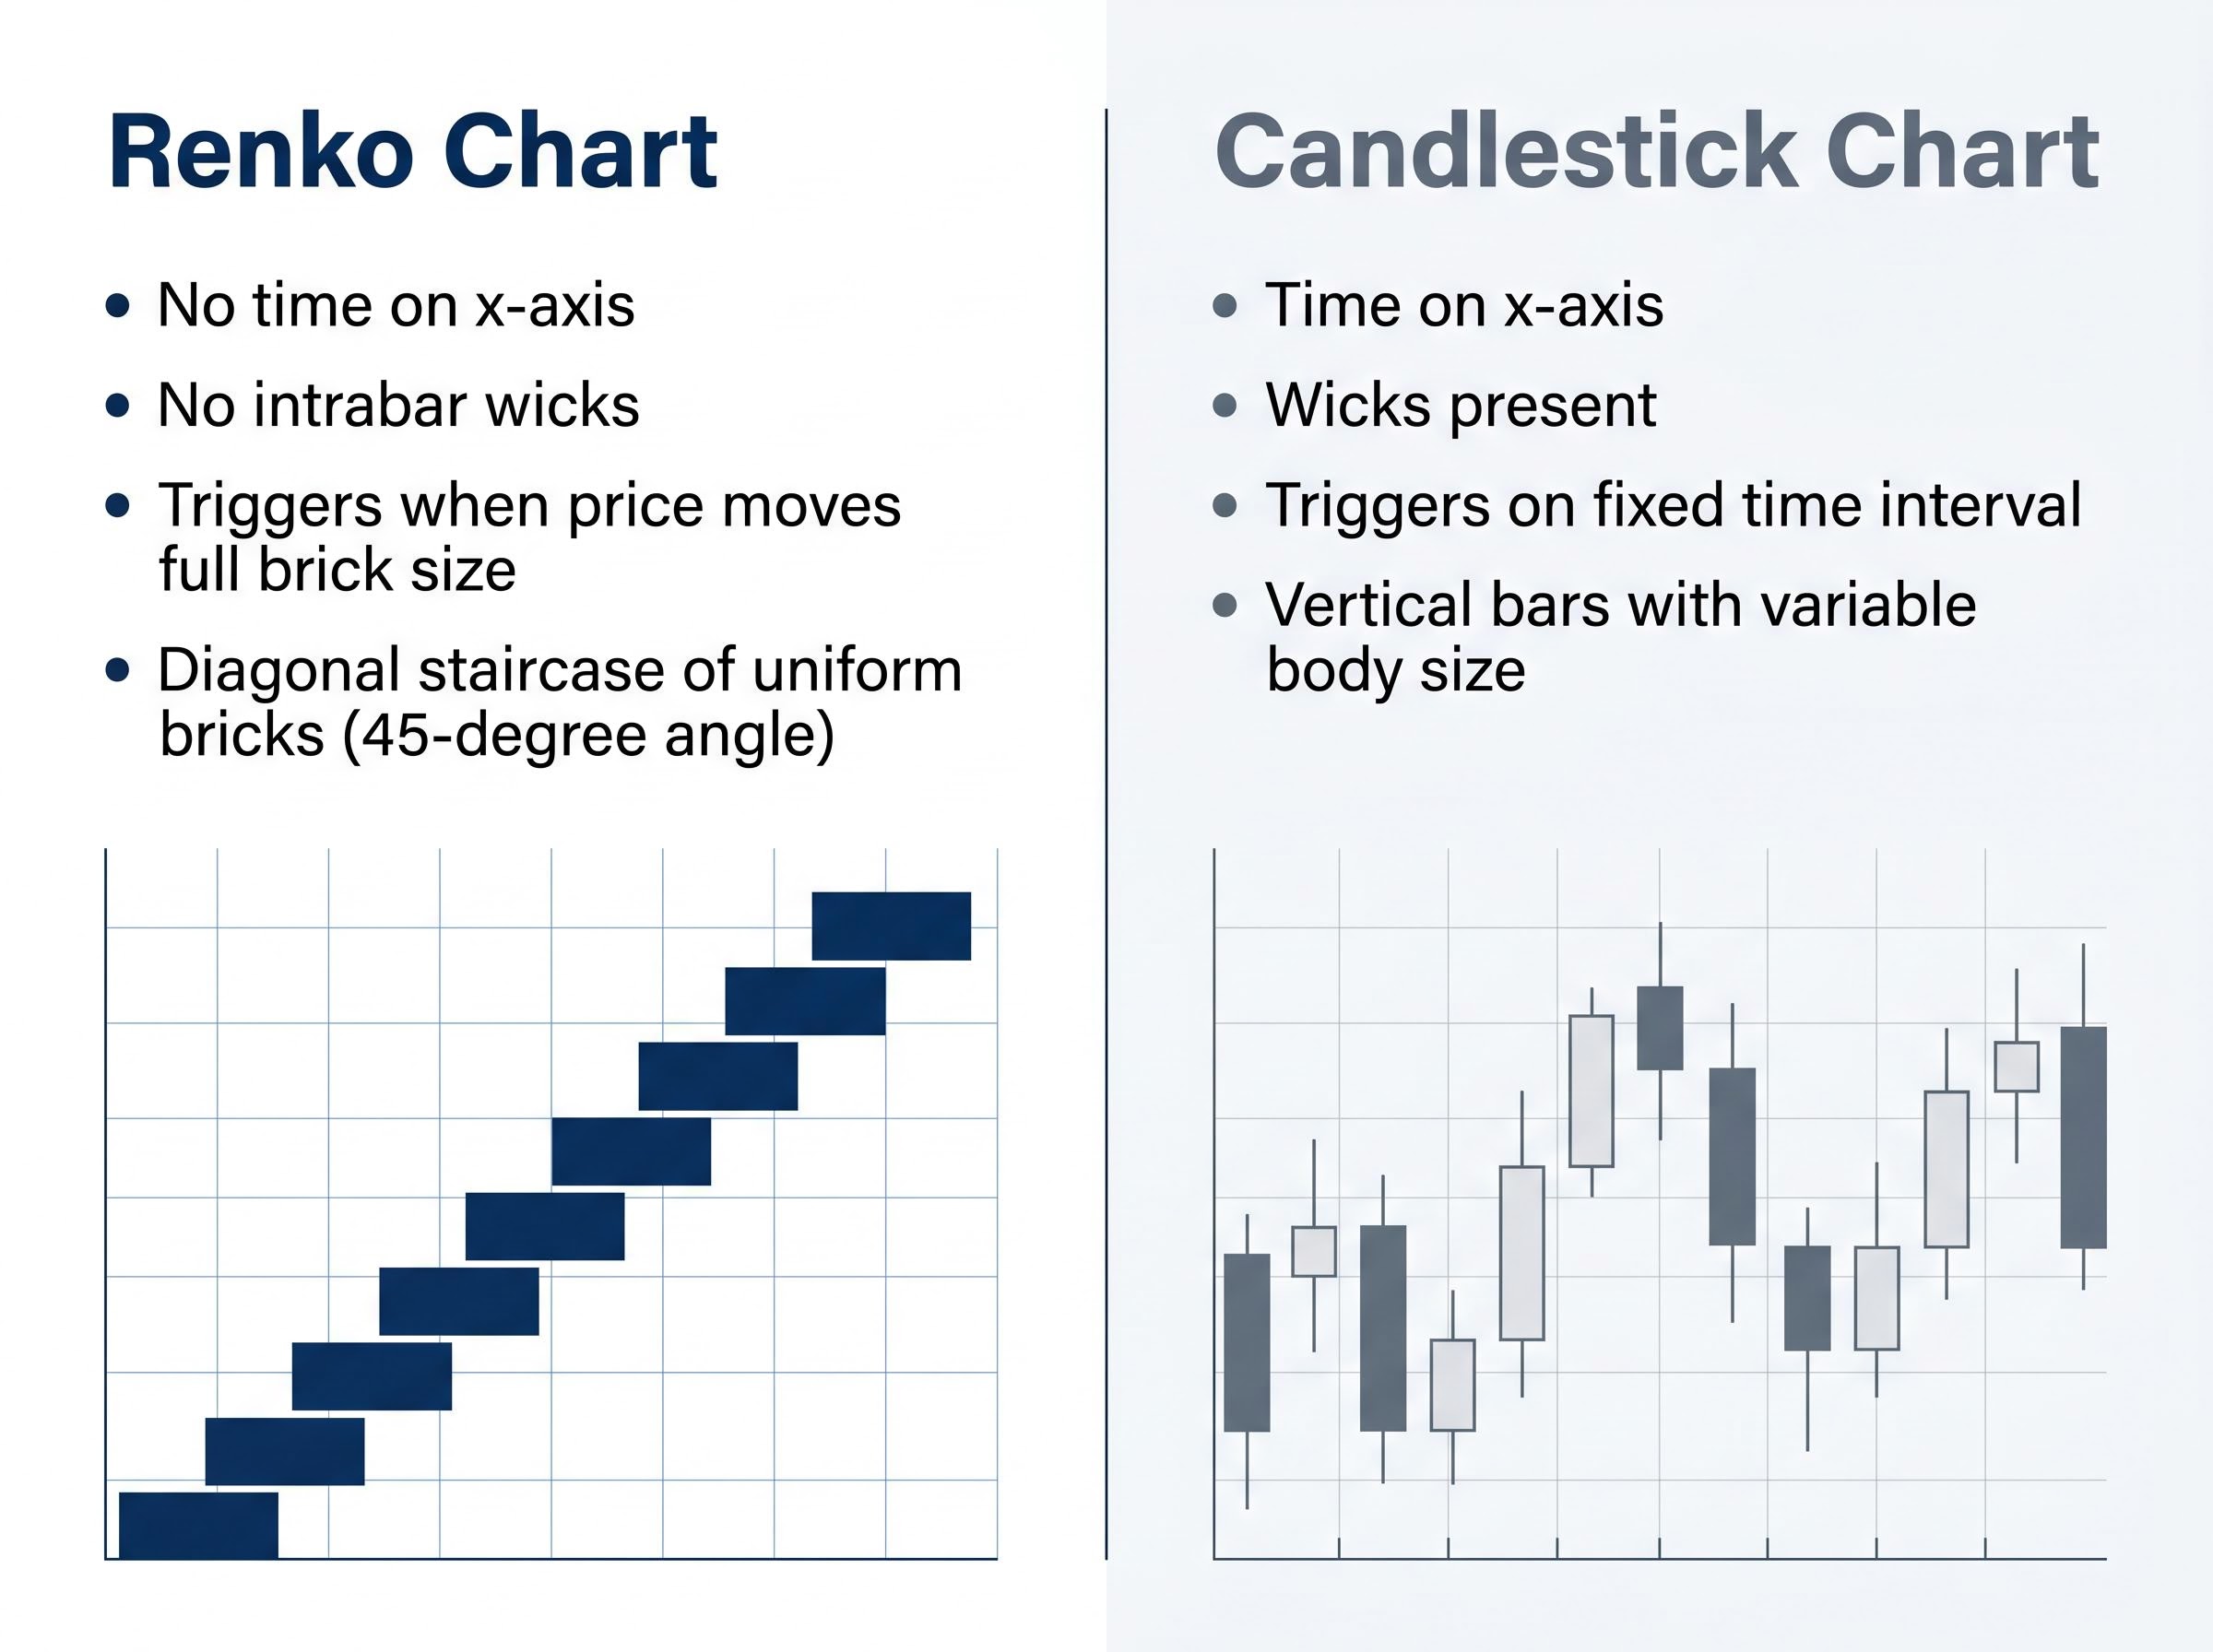
The first encounter with a Renko chart tends to produce a moment of disorientation. There is no time axis. There are no wicks. There is no volume. What remains is a staircase of uniform rectangular bricks, each placed at a 45-degree angle from the one before it, coloured to indicate direction: one colour for up, another for down.
The simplicity is the point. Each brick represents a fixed amount of price movement, and a new brick only appears after price has travelled that full distance. CMC Markets describes the visual output as a staircase where each step only forms after price has covered the required ground. OANDA reinforces the same idea: each brick is like a brick in a wall, uniform in size, laid only when price earns it.
The practical consequence of this construction is that quiet markets produce very few bricks while volatile markets produce many. Low-activity periods compress automatically, and high-activity periods expand. The chart’s density becomes a direct visual encoding of how much price has actually moved.
| Attribute | Renko chart | Candlestick chart |
|---|---|---|
| Time on x-axis | No; bricks form only on price movement | Yes; new candle at every fixed interval |
| Intrabar wicks | None; no high/low detail within bricks | Present; show intrabar range |
| New unit trigger | Price moves the full brick size | Fixed time interval elapses |
| Visual shape | Diagonal staircase of uniform bricks | Vertical bars with wicks, variable body size |
How Renko’s core mechanics determine what appears on the chart
Renko’s entire operating logic reduces to three rules. Understanding them in sequence is the difference between reading a Renko chart accurately and misinterpreting what it shows.
- Brick size threshold. A new brick only forms when price moves the full defined brick size from the prior brick’s close. Any move that falls short, even by the smallest fraction, leaves the chart unchanged. With a 10-point brick size, a 9.9-point move produces zero new bricks. The chart does not care how close price came; it only registers complete thresholds.
- Directional continuation. Once a brick has formed, the next brick in the same direction is added when price penetrates the upper or lower boundary of the current brick by another full brick size. Consecutive same-colour bricks stack diagonally, building the staircase pattern that makes trend direction immediately visible.
- Reversal threshold. A directional reversal requires price to move twice the brick size beyond the last brick’s boundary before a new opposing brick is plotted. This 2x rule functions as a built-in noise filter, suppressing minor counter-moves that would otherwise clutter the chart with false reversal signals.
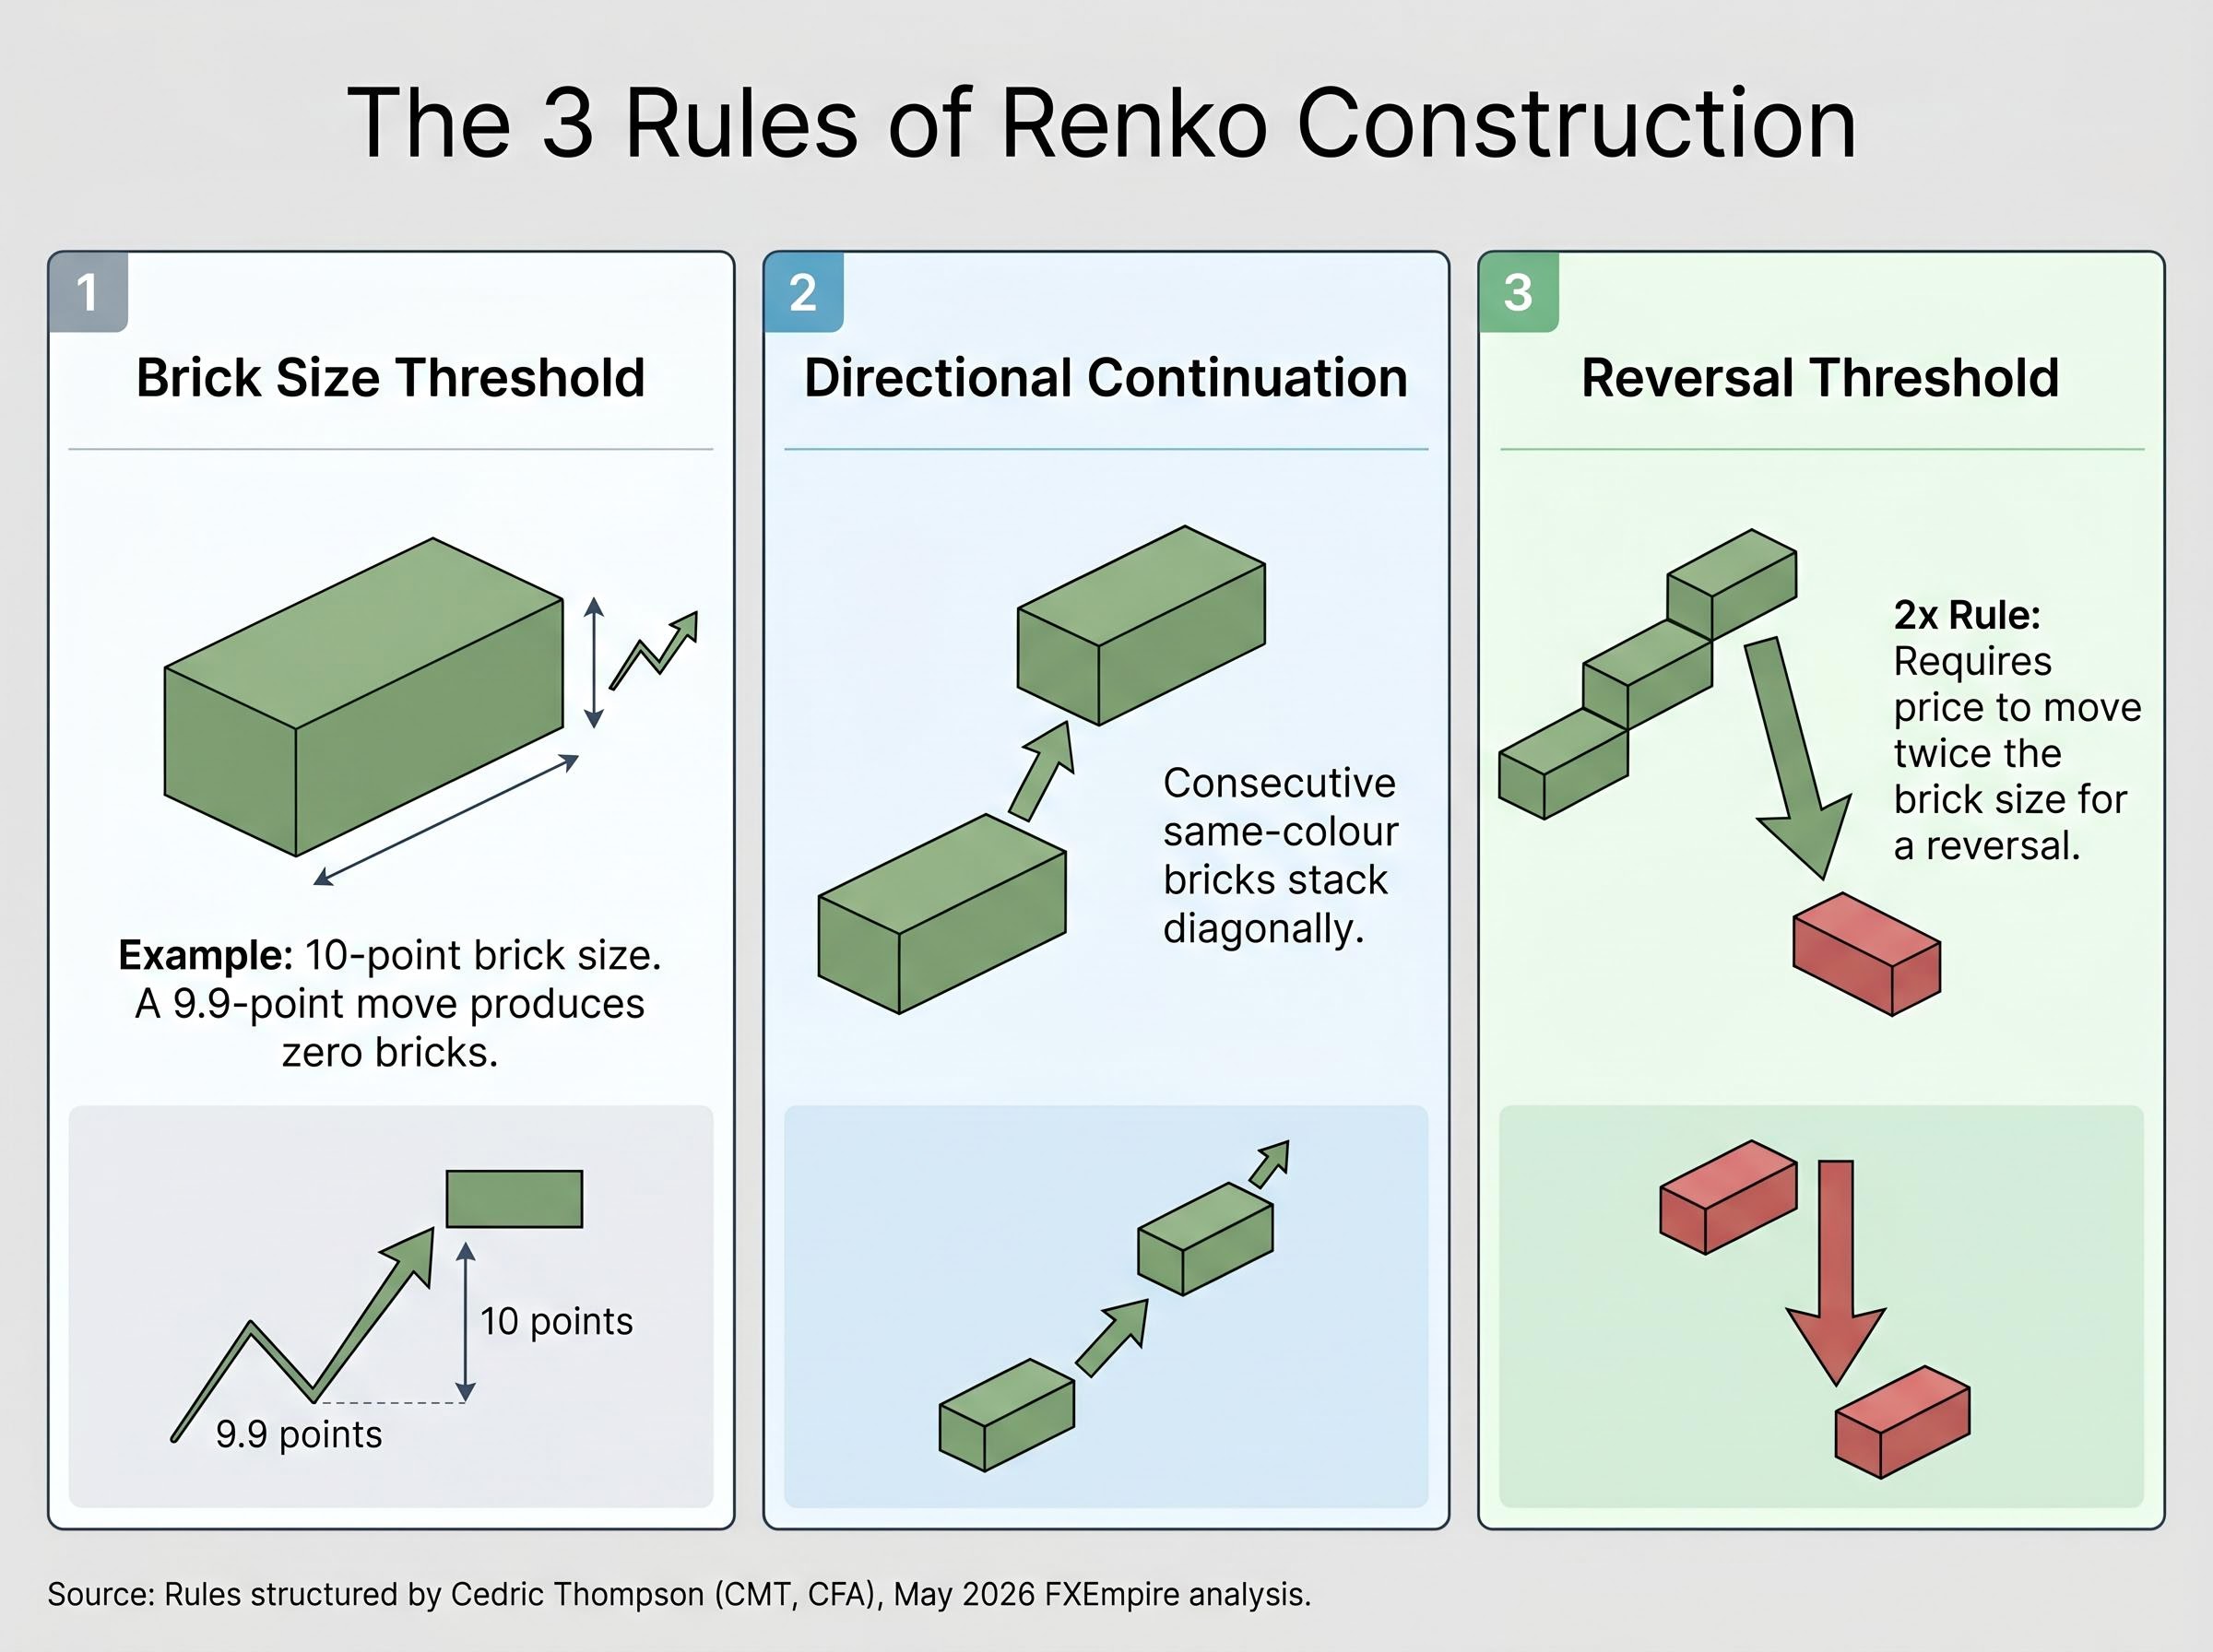
“A Renko reversal requires price to travel twice the brick size in the opposite direction before the chart changes colour, filtering out minor retracements automatically.”
These three rules, as structured by Cedric Thompson (CMT, CFA) in his May 2026 FXEmpire analysis, form the complete mechanical logic. A reader who understands them can interpret any Renko chart, regardless of asset or timeframe.
Why the reversal filter matters for real trading
The 2x reversal requirement means the chart will not react to every small counter-move. In a trending market, this is a genuine advantage: minor pullbacks within a trend are invisible, and the directional signal stays clean.
The trade-off appears at genuine turning points. Because the chart requires a full double-brick counter-move before registering a reversal, traders relying on Renko alone will be structurally late to recognise that the trend has changed. This lag is not a defect; it is the direct cost of the noise-filtering benefit. The same mechanism that prevents false signals also delays true ones.
Choosing a brick size: the decision that shapes everything you see
Brick size is not a technical formality. It is the single most consequential decision a Renko user makes, and the three available approaches each represent a different answer to the same underlying problem: how to calibrate the filter for the current market’s volatility.
OANDA and CMC Markets both emphasise that brick size choice determines whether Renko’s filtering benefit is actually realised. Too small, and the chart remains noisy, with the filtering advantage largely lost. Too large, and meaningful reversals are hidden while entries and exits drift too far from price.
| Sizing method | How it works | Best suited for |
|---|---|---|
| Fixed value | Manually set price value (e.g., 10 pips, $0.50); remains constant regardless of conditions | Scalping, defined risk/reward setups, single-instrument focus |
| ATR-based | Brick size derived from Average True Range over a lookback period; adjusts dynamically to recent volatility | Swing trading across instruments with varying volatility profiles |
| Percentage-based | Brick size scales proportionally to the instrument’s price level | Long-term macro analysis; comparing instruments at different price levels |
Fixed sizing offers consistency and simplicity. The trader knows exactly what each brick represents at all times. ATR-based sizing introduces adaptability, adjusting brick dimensions as volatility shifts, but it carries a specific risk that beginners often overlook. Percentage-based sizing suits long-term comparative analysis but is less practical for intraday pip-based strategies.
Some institutional practitioners use an ATR Persistence variant, a rolling calculation that keeps historical brick structure fixed while applying updated ATR values only to new bricks. This prevents the repainting problem described below, though it remains a niche implementation.
The ATR repainting risk beginners often miss
With ATR-based Renko, the brick size itself is derived from recent price behaviour. When volatility spikes and the ATR value updates, the brick size changes, and historical bricks can be retrospectively redrawn on screen.
This means the chart a trader sees in backtesting may not reflect what the chart would have shown in real time. A clean series of trend-confirming bricks in historical view might have looked very different as prices unfolded live. TradingView community discussions from 2024-2025 describe ATR-based Renko as capable of “changing the brick layout when volatility spikes,” though no mainstream broker has published a formal named analysis of the mechanism.
For beginners testing ATR Renko on historical data, this distinction matters. Conclusions drawn from backtested ATR Renko charts should be treated with caution until the trader has observed the same configuration in real-time market conditions.
Where Renko performs well and where it struggles
Renko’s strengths and limitations are structural. They are designed trade-offs, not bugs, and understanding both sides allows traders to deploy the chart as a targeted tool rather than a universal replacement.
Strengths:
- Trend identification. The staircase visual makes directional state immediately apparent. A sequence of same-colour bricks ascending diagonally is an unambiguous uptrend; the reverse is an unambiguous downtrend. No interpretation of wick patterns or candle bodies is required.
- Support and resistance mapping. Reversal zones, where bricks change colour and cluster at similar price levels, highlight areas where price has historically stalled or reversed. These levels emerge cleanly from the chart without additional indicators.
- Noise filtering for indicators. Moving averages, oscillators, and other technical indicators applied over Renko data tend to produce cleaner signals than the same indicators applied over time-based charts, because the underlying data has already been stripped of minor fluctuations.
Limitations:
- Lag at reversals. The 2x reversal rule means genuine turning points register late on the chart. Investopedia notes that “traders may be late to see reversals,” particularly when brick sizes are large.
- Poor performance in ranging markets. Whipsaws generate bricks with no net directional progress, creating false trend signals. CMC Markets explicitly notes that Renko “may be less effective in range-bound markets where price oscillates without clear direction.”
- Absence of timing information. No wicks, no session awareness, no intrabar price action. OANDA specifically cautions that Renko is not well-suited for very short-term scalping, where seconds matter.
- Need for complementary tools. Renko alone creates blind spots around speed of movement and exact timing. DailyFX recommends pairing Renko with other indicators or chart types, and IG describes combining Renko with moving averages for systematic strategy building on live platforms.
“Renko works best as part of a multi-tool approach. Combining it with indicators like moving averages addresses the timing and volatility context gaps it leaves on its own.”
Each limitation follows directly from the same design choices that produce the strengths. The noise filter that cleans up trends is the same mechanism that delays reversals. The time-independence that compresses quiet markets is the same feature that eliminates timing context.
The chart that filters time out of the picture still asks something of you
Renko is not a simpler chart in the sense of requiring less from the trader. It is a differently demanding chart. The cognitive load shifts from reading noise, the intrabar fluctuations and time-driven candle formations that dominate standard charts, to configuring the filter correctly. Brick size, asset selection, and complementary tools all require judgment that the chart itself cannot provide.
For traders who want to explore Renko with a practical starting point rather than theory alone, three steps offer a reasonable entry:
- Start with a fixed brick size on a single trending instrument, such as a major FX pair or a liquid index, where directional momentum is the dominant price characteristic.
- Use TradingView or OANDA’s educational resources to experiment in a demo environment before applying Renko to live capital.
- Pair Renko with one complementary indicator, such as a moving average, before drawing conclusions about signal quality. Renko’s filtering and a moving average’s trend confirmation address different blind spots.
Renko belongs to a broader family of non-standard chart types that filter time or volume. TradingView groups it alongside Point and Figure, Kagi, Line Break, and Range Bars, each with distinct construction rules and reversal mechanics. Traders who find Renko’s approach useful may find value in exploring these alternatives as well.
Fibonacci confluence strategies are among the most compatible overlays for Renko charts: because Renko already filters minor fluctuations from the dataset, key retracement levels drawn across clean brick sequences tend to produce cleaner entry signals than the same levels applied to noisy candlestick charts, where intrabar wicks frequently obscure whether a level has genuinely held.
The traders who use Renko well tend to share one characteristic: they treat it as one tool in a broader charting toolkit, not as a replacement for the rest. The simplicity it offers is real. The decisions it delegates to the user are equally real.
This article is for informational purposes only and should not be considered financial advice. Investors should conduct their own research and consult with financial professionals before making investment decisions.