Most investors ask the wrong question in the months before an election. They ask which party will win.
The more useful question, the one that actually protects your capital, is which of your holdings do not need to care.
The 2026 U.S. midterm elections are approaching with real uncertainty about who controls Congress, and the outcome would shape genuinely different policy environments for tech regulation, energy, healthcare reimbursement, and corporate tax rates. But here is the counterweight that matters more than any forecast: the investors who navigate election cycles best are almost never the ones who guessed the result correctly. They are the ones who owned companies built to hold their ground across a range of outcomes.
That is what this guide gives you: a practical framework for identifying politically resilient stocks that can perform no matter who runs Congress. You will leave with five specific metrics to screen for, two real case studies to calibrate against, and a repeatable method you can apply to any stock in any election year.
Why most stocks are more exposed to politics than their owners realise
Political exposure is not a switch that flips on for regulated industries and stays off for everyone else. It runs on a spectrum, and most companies sit somewhere in the middle without their shareholders ever auditing where.
Some exposure is direct and obvious: healthcare reimbursement rates, energy subsidies, defence contracts. But much of it is indirect and easy to miss. Interest rate policy shaped by fiscal decisions, antitrust enforcement intensity, and corporate tax rates that quietly reshape after-tax earnings all sit in this second category.
Here is the part that catches investors off guard. An election does not usually create a vulnerability. It activates one that was already there, sitting dormant in an over-leveraged balance sheet, a single-revenue-stream business, or a company whose margins only work under one specific policy regime.
Policy-driven market risk does not distribute evenly across a portfolio: three announcements between January and May 2026 moved global equities more decisively than any economic data release in the same period, with first-order trade-flow exposure, not broad sentiment, determining where losses concentrated.
The reassuring news is that the broad market is not the risk. Historical work from Goldman Sachs and Vanguard shows U.S. equities have delivered positive average returns across both Republican and Democratic administrations. The risk lives at the sector level, in concentrations that most portfolios carry without noticing.
Vanguard market history research spanning data back to 1860 finds no consistent statistical relationship between the party controlling Washington and the performance of a diversified equity portfolio, reinforcing why broad market returns are a poor guide to sector-level political risk.
Research teams at Bank of America and Citi point to four specific vectors where elections produce material, sector-level impact:
- Corporate tax policy, which flows straight through to after-tax earnings and valuation.
- Healthcare regulation, including reimbursement rates, drug-pricing rules, and insurance mandates.
- Energy and climate policy, from fossil fuel rules to renewable subsidies and mandates.
- Antitrust enforcement, where the appetite for challenging large-cap dominance can shift with control of Congress.
Volatility often ticks up temporarily around election dates, but the consensus across these firms is that it normalises once the policy path becomes clear.
So the personal takeaway is direct. Run a quick audit of your holdings and ask whether any of them draw a disproportionate share of earnings from a policy environment that could flip in November. That concentration is exactly the vulnerability this framework is designed to find and reduce.
When big ASX news breaks, our subscribers know first
The five metrics that define a politically resilient stock
Think of these five metrics the way an analyst briefing a colleague would: each one earns its place because it solves a specific vulnerability. Together they form a screening toolkit, not a checklist of isolated numbers.
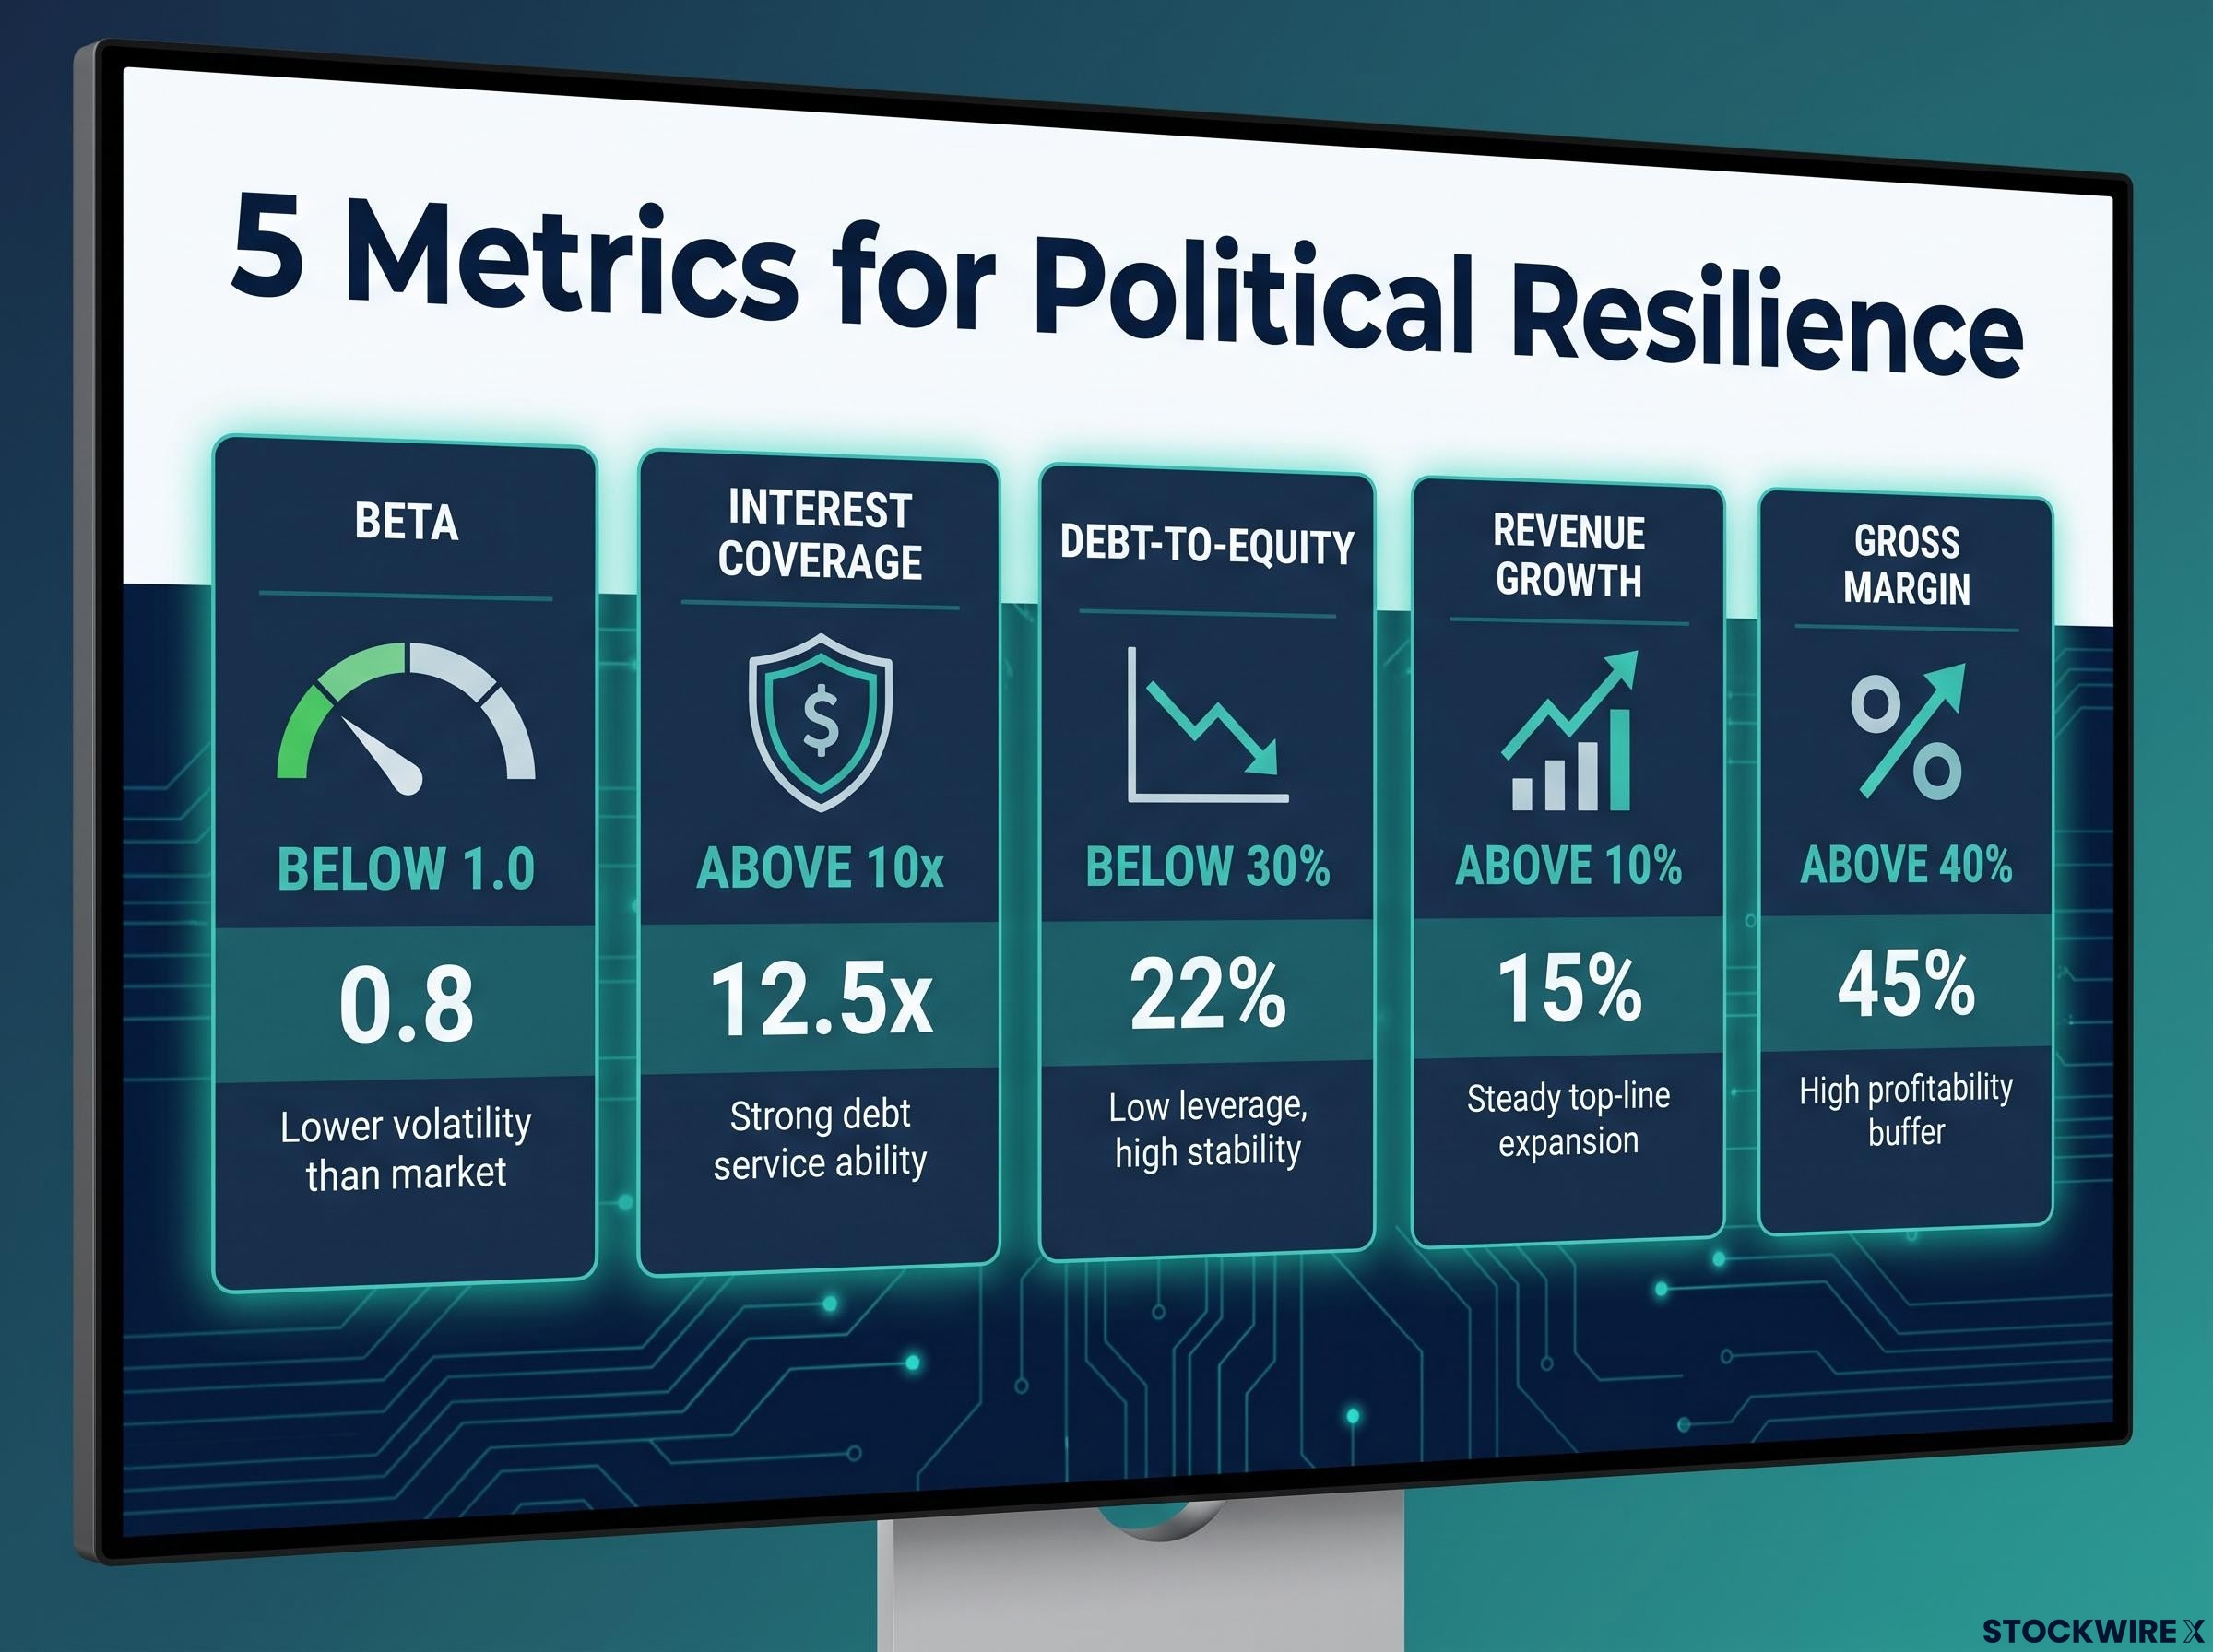
Beta measures how sensitive a stock’s price is to broad market moves. A beta below 1.0 means the stock swings less than the market overall. That matters politically because research on low-volatility and defensive factor portfolios shows smaller drawdowns during the uncertain weeks before an election.
Interest coverage ratio tells you how comfortably a company can pay the interest on its debt from its operating earnings. A ratio above 10x signals genuine debt-service safety, which becomes valuable when fiscal policy and rates shift. Berkshire Hathaway’s coverage, running around 19-22x, is the calibration benchmark to hold in your head here.
Debt-to-equity ratio shows how much a company relies on borrowed money versus its own capital. Below 30% points to self-funded resilience. Work from Goldman Sachs and JPMorgan finds that low-leverage firms hold up better when political swings move credit risk premia.
Revenue growth above 10% is evidence of structural demand that does not depend on any single legislative outcome. Microsoft’s 18% growth for its most recent fiscal year is the calibration point for what strong, policy-independent demand looks like.
Gross margin above 40% acts as a proxy for pricing power, the ability to absorb a tax increase or a new regulatory cost without gutting profitability.
Here is the whole toolkit in one place.
| Metric | What it measures | Resilience threshold | Why it matters politically |
|---|---|---|---|
| Beta | Price sensitivity to broad market moves | Below 1.0 | Smaller drawdowns during pre-election uncertainty |
| P/E ratio | Price paid per dollar of earnings | Reasonable vs sector peers | A stretched valuation amplifies policy-driven downside |
| Interest coverage | Ability to service debt from earnings | Above 10x | Debt-service safety under shifting fiscal and rate regimes |
| Debt-to-equity | Reliance on borrowed capital | Below 30% | Low leverage resists swings in credit risk premia |
| Revenue growth | Rate of demand expansion | Above 10% | Structural demand independent of any single law |
A company clearing these five thresholds is not relying on Washington to protect its business model. That independence is precisely what you want heading into a contested midterm cycle.
Using the thresholds as a filter, not a formula
No company clears every threshold in every market environment, and that is fine. The value is in seeing which thresholds a stock misses and asking whether the gap is a genuine political vulnerability or an acceptable trade-off.
A high-growth company might carry a beta above 1.0, for example, and that is a defensible choice if its revenue growth and margins are strong enough to justify it.
One caveat carries real weight. Valuation starting points matter. Even a high-quality, low-beta company can underperform if it enters an election period at a stretched valuation and then runs into policy headwinds. Treat the thresholds as a filter that surfaces questions, not a formula that hands you a verdict.
Defensive allocation carries a measurable opportunity cost: low-volatility and high-dividend equity funds underperformed the S&P 500 by approximately 10 percentage points in 2024, which is why the framework distinguishes between structural resilience and blanket de-risking.
Berkshire Hathaway and Microsoft as contrasting case studies
There is more than one path to political resilience, and the fastest way to see that is to run the framework across two very different companies side by side.
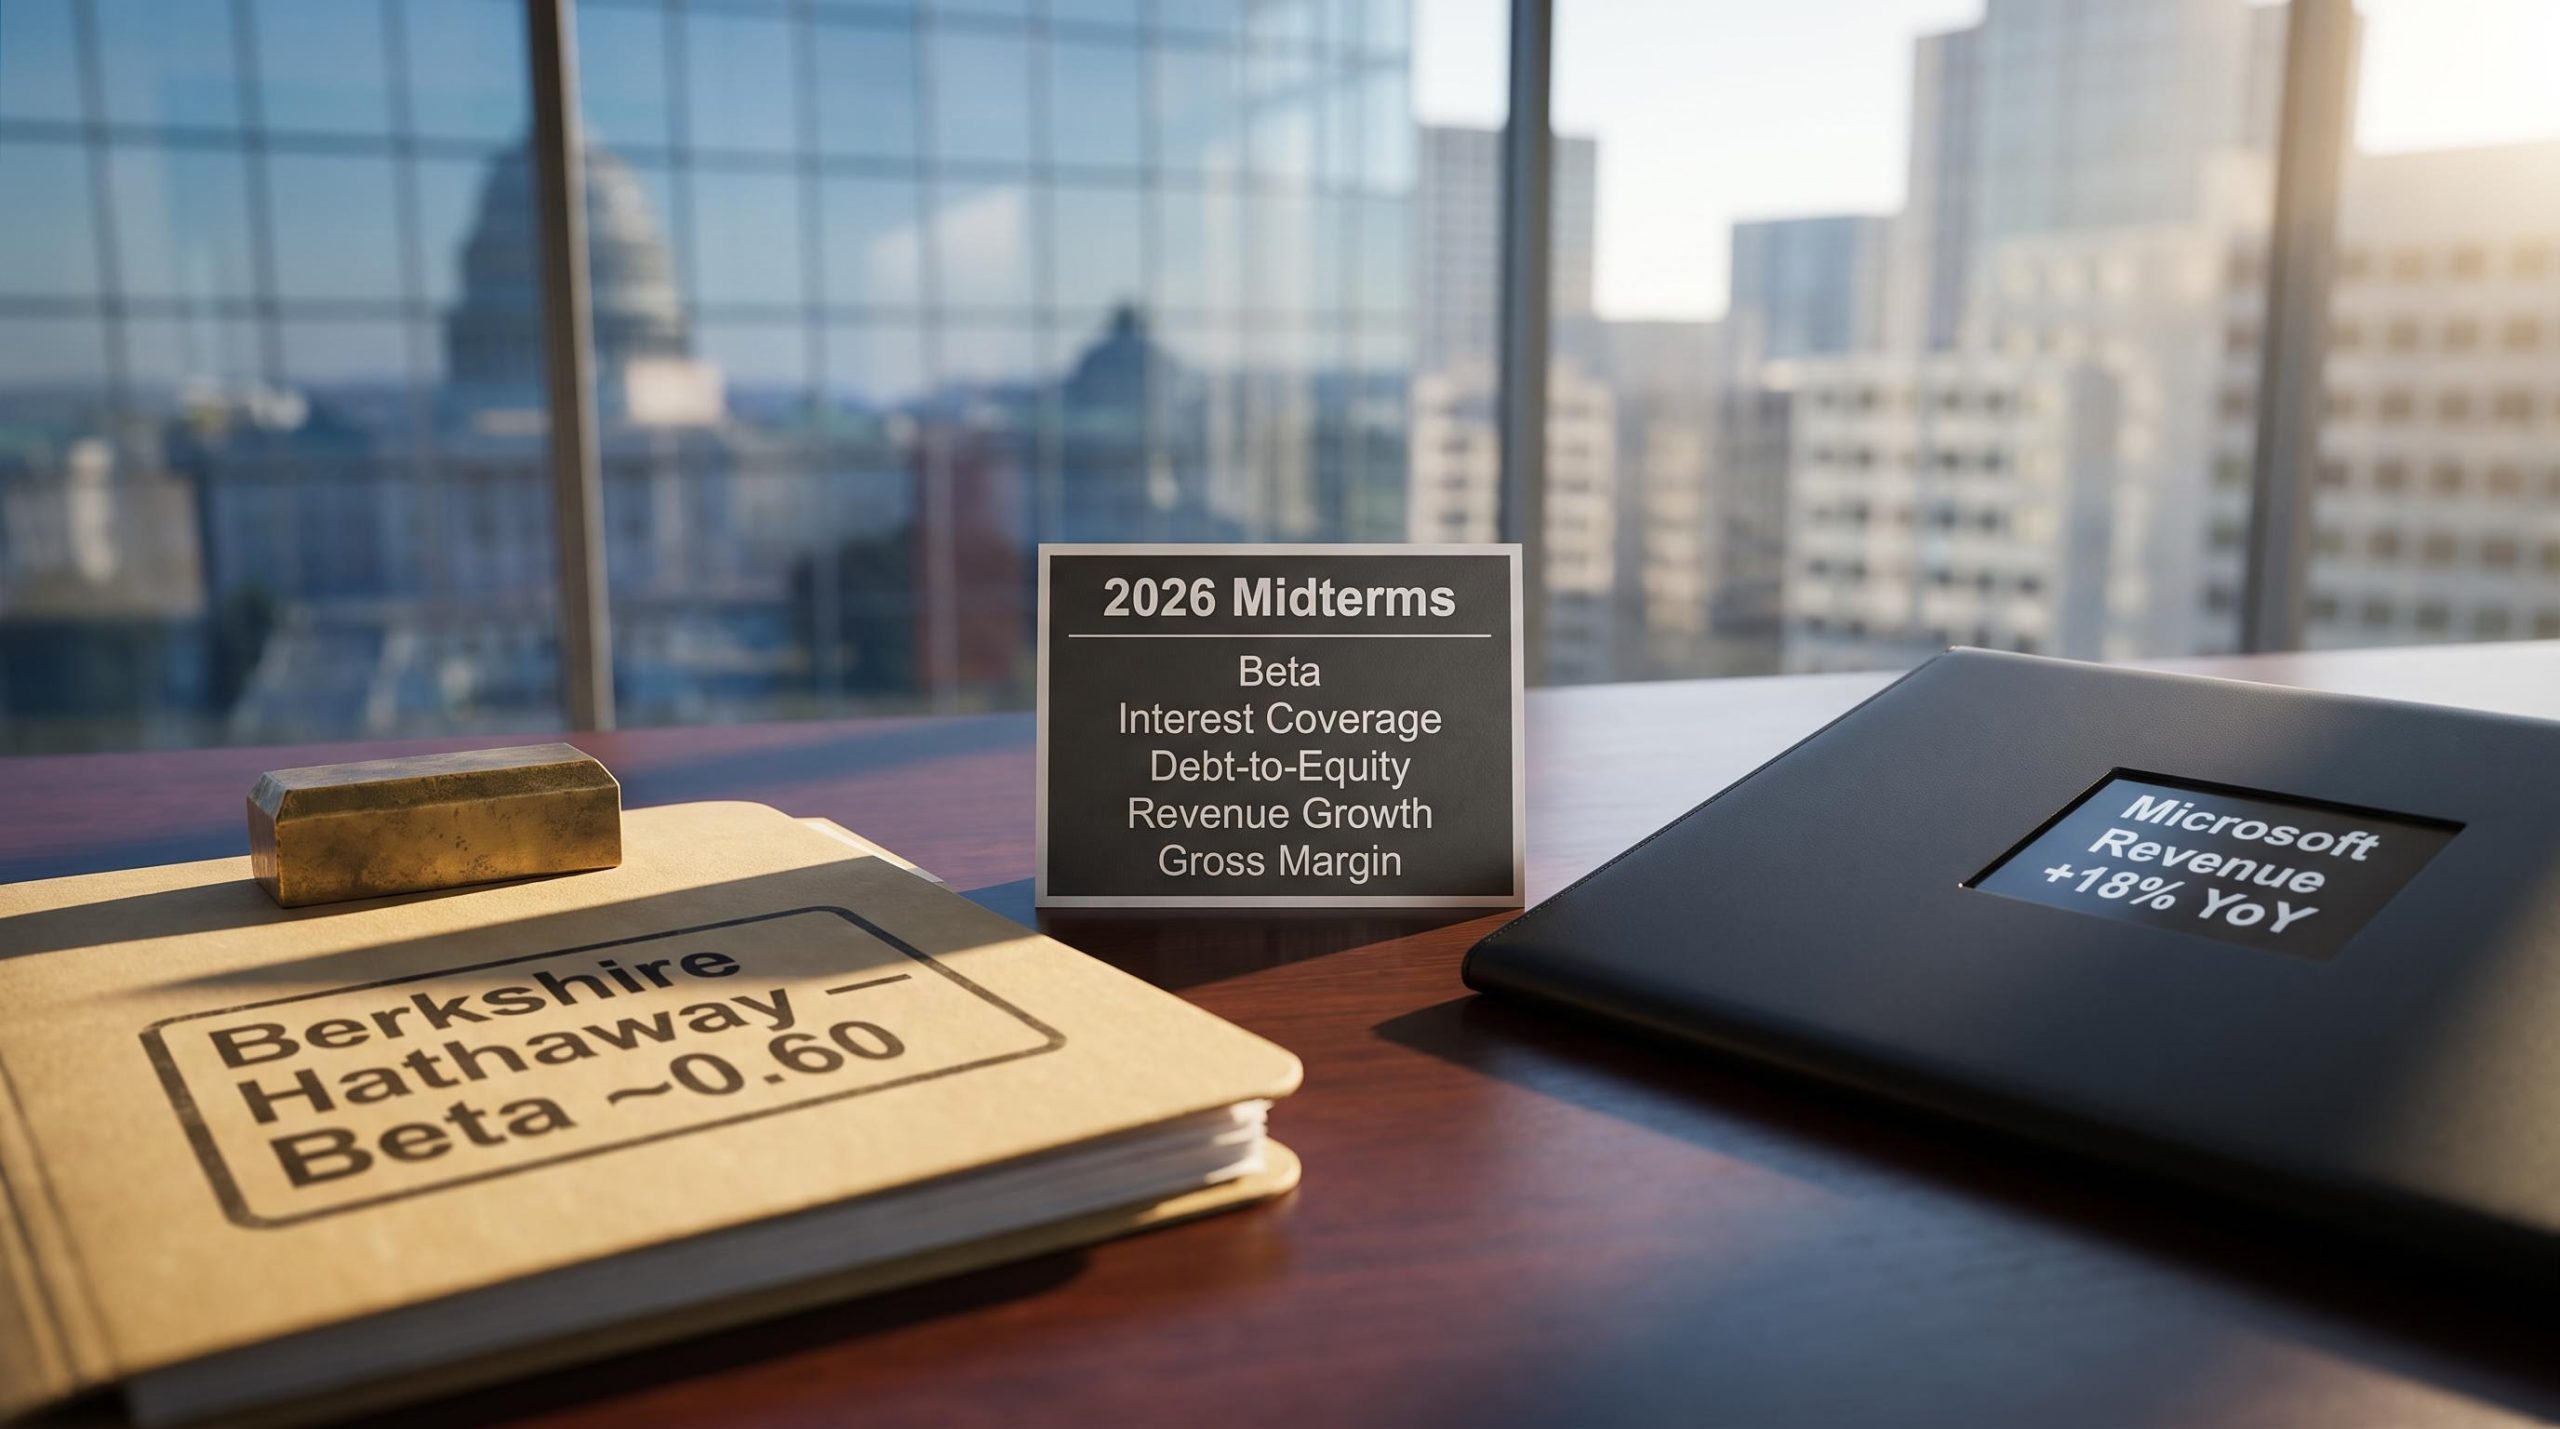
Berkshire Hathaway is the defensive diversification archetype. Its low beta of roughly 0.60 comes from conglomerate breadth: insurance, rail, utilities, manufacturing, and consumer businesses that operate largely independently of which party holds Congress. It trades at around 12.7-12.8x trailing earnings, carries a debt-to-equity ratio near 17-18%, and covers its interest obligations roughly 19-22x over. Across multiple election cycles, Berkshire has continued to compound book value and earnings with modest dependence on any single piece of U.S. legislation.
Microsoft takes the opposite route. It is the structural demand archetype, accepting a higher beta of around 1.11 in exchange for growth that transcends any single Congressional session. Revenue climbed 18% year-over-year to $331.8 billion for the fiscal year ended 30 June 2026, driven by cloud computing and AI adoption, with a gross profit margin near 68% and heavy recurring subscription revenue.
Here is how the two archetypes compare across the framework.
| Metric | Berkshire Hathaway | Microsoft |
|---|---|---|
| Beta | ~0.60 | ~1.11 |
| P/E ratio | ~12.7-12.8x | Growth-premium valuation |
| Interest coverage | ~19-22x | Strong cash generation |
| Debt-to-equity | ~17-18% | Low, self-funded |
| Revenue growth | Modest, steady | ~18% year-over-year |
| Resilience archetype | Defensive diversification | Structural demand |
Microsoft’s higher beta does not mean it lacks political resilience. Its business runs on enterprise software and commercial cloud services rather than government policy mandates, which reduces its sensitivity to a shift in Congressional control. Its regulatory exposure is real, but it is a different kind of risk.
Microsoft’s regulatory challenges, including the EU Digital Markets Act, cloud competition scrutiny, and reviews of its AI partnerships, are structural and bipartisan. They are embedded in law and enforced by technocratic regulators, so they persist regardless of which party wins in November.
The paired comparison delivers something practical. You do not have to choose between growth and resilience. You choose which kind of resilience fits your risk tolerance, and these two archetypes give you a concrete template to match any stock against.
What the 2026 midterm cycle actually changes, and what it does not
The election matters at the sector level, not the portfolio level. Knowing that difference is what separates a disciplined investor from one who makes expensive, politically driven repositioning moves they later regret.
The blended institutional view, drawn from Goldman Sachs, Vanguard, LPL Financial, Bank of America, and Citi, holds that broad market returns are dominated by fundamentals: earnings growth, interest rates, and valuation. Midterm years have historically been followed by strong returns as policy uncertainty fades. But sector-level outcomes can still diverge sharply.
The midterm election cycle has historically delivered an average S&P 500 gain of 15.4% in the 12 months following election day since 1950, with weakness concentrating in H1 and a sharp recovery typically beginning from October onward.
For 2026 specifically, the genuine sector-level risks are consistent regardless of which direction control shifts: antitrust enforcement intensity for large-cap tech, healthcare reimbursement frameworks, climate and industrial policy for energy and utilities, and the trajectory of corporate tax rates.
Across these same institutional sources, the mechanisms that make a company resilient to any of those risks are strikingly consistent. Use them as screening criteria:
- Global revenue diversification, so earnings are not hostage to one country’s policy regime.
- Essential products, where demand for necessities holds up through political noise.
- Strong balance sheets, which let a company self-fund rather than depend on fiscal or credit conditions.
- Recurring revenue, which smooths earnings across short, event-driven cycles.
- Regulatory embeddedness, where dense existing rules make any single election’s impact incremental.
- Pricing power, which lets a firm pass through new tax or regulatory costs without crushing margins.
There are honest limits here. The number of modern election cycles is small, regimes change, and concurrent shocks like geopolitical events or financial crises can overwhelm any historical pattern. Resilience patterns are guidance, not guarantees.
Research from Goldman Sachs and Vanguard consistently finds that investors who stayed invested through multiple election cycles fared better than those who tried to time the outcome. That is the counterweight to any impulse to reposition before the votes are counted.
So the most important reframe of this entire guide is this. The question is not whether to act before the midterms. It is whether your current holdings already carry the structural characteristics to absorb whatever the outcome produces, and the five-metric framework now lets you answer that for yourself.
Building a politically resilient position before November 2026
You do not need a vague resolution to “buy quality companies.” You need a sequence you can work through, stock by stock, over the next few weeks.
Apply these five steps to your current holdings and to any new position you are weighing:
- Screen for beta. A reading below 1.0 tells you the stock should move less violently than the market during pre-election turbulence.
- Check the P/E against peers. A reasonable valuation relative to competitors tells you the stock has room to absorb a policy shock rather than amplify it.
- Verify interest coverage. Above 10x tells you the company can service its debt comfortably even if rates and fiscal policy move against it.
- Assess debt-to-equity. Below 30% tells you the business funds itself rather than leaning on credit conditions that Washington influences.
- Evaluate revenue growth and margin. Growth above 10% and gross margins above 40% tell you demand is structural and the company can pass through new costs.
If you assume politically resilient stocks are only for the risk-averse, the Microsoft case study corrects that directly. Structurally resilient growth companies exist, and the same framework identifies them.
Portfolio resilience now requires diversification across economic environments rather than across asset-class labels alone, because the stock-bond negative correlation that anchored the 60/40 framework turned persistently positive during inflation shocks in 2022, 2025, and May 2026.
The defensive archetype concentrates in consumer staples, utilities, and healthcare names with inelastic demand, sectors that have historically shown lower beta and steadier earnings through election cycles. The growth archetype concentrates in enterprise software, cloud computing, and AI infrastructure, exactly where Microsoft sits.
For you, the practical payoff is immediate. Running this screen on your ten largest positions this week will tell you, before November, which holdings are equipped for any outcome and which are quietly betting on one specific legislative result.
The framework beyond 2026
This same five-metric approach applies to any future election cycle, any jurisdiction where political risk touches your portfolio, and any macro environment where policy uncertainty rises. The 2026 midterms will set the legislative agenda for 2027-2028, so the screen is useful now and continuously across the next two years. Learn it once, and it becomes a permanent part of your analytical toolkit rather than a single-cycle playbook.
This article is for informational purposes only and should not be considered financial advice. Investors should conduct their own research and consult with financial professionals before making investment decisions. Past performance does not guarantee future results, and financial projections are subject to market conditions and various risk factors.
What politically resilient portfolios look like after the votes are counted
The investors who come through election cycles in the best shape are rarely the ones who called the result. They are the ones who held companies with the structural characteristics to perform whichever way the vote went.
Be clear about what this framework does and does not do. It identifies resilience; it does not eliminate risk. A concurrent macro shock, a regime change, or a stretched valuation at the wrong moment can still impair even a carefully built portfolio.
The 2026 midterms are one event in a long investment career. You now hold something you did not before you started reading: a five-metric framework, two calibration benchmarks in Berkshire and Microsoft, and a five-step evaluation sequence you can run this week and every cycle that follows.