Micron has just reported $54.23B in quarterly revenue, up 379% year over year. Within days, roughly $28M of put premium reportedly went into near-the-money January options on the stock. Put that way, the Micron puts look like a simple bearish bet against a company at the top of its game, and that reading may be wrong.
The context explains why traders are watching so closely. Shares failed to advance after the record quarter and a round of analyst upgrades, and the stock trades at about 6x forward earnings. When a cheap stock with blowout results will not rise, every unusual options trade gets studied closely.
One caveat matters before anything else. The flow details come from a single original source, a Tasty Live “Signal Versus Noise” episode, and have not been independently confirmed.
Here is how to read the numbers on a put trade, the three interpretations competing to explain this one, and how much weight a single print deserves.
What did the Micron put buying actually look like?
Between 2 October and 5 October, seven sizeable bearish trades appeared on Micron Technology. Most of the money landed in just two places.
Concentration check 92% of the roughly $28M in put premium went into two January positions.
A put option gives its buyer the right to sell shares at a set price, called the strike, before a set date. Here are the two positions as reported.
| Position | Premium | Implied volatility | Days to expiration |
|---|---|---|---|
| January 1050 put | $14.8M | 49% | 101 |
| January 1070 puts | About $11.1M | 52% | Not specified (January expiry) |
Now set those trades against the fundamentals. Micron’s fiscal Q4 2026 results, reported on 30 September 2026, showed non-GAAP earnings per share of $33.42 and a non-GAAP gross margin of 87.0%. Management guided Q1 fiscal 2027 to about $61.5B in revenue and $38.15 in adjusted EPS, above consensus.
Micron’s fiscal Q4 2026 press release confirms the $54.23B revenue figure and the guidance behind it, so the fundamentals side of this debate rests on reported numbers, while the options flow side still rests on a single unconfirmed source.
The original source also cites analyst targets ranging from 1386 to about 1536, with Rosenblatt at 1900. Those targets could not be independently confirmed.
The stock still did not move higher.
The strikes matter too. These puts sit at or near the money and cost real money; they are not cheap, far-out-of-the-money protection against a disaster. Paying up like this tells you the buyer made a deliberate, expensive decision rather than buying a lottery ticket, which is why it deserves analysis but not automatic alarm. Keep one limit in view: generic Micron options flow around earnings was mixed, with bullish and bearish activity alongside each other.
When big ASX news breaks, our subscribers know first
How do you read a put trade: premium, breakeven, implied volatility and beta?
Any options-flow headline gives you a strike, an expiry and a dollar figure. Four numbers turn that into a readable position:
- Premium: what the buyer paid.
- Breakeven: where the trade starts making money.
- Implied volatility: how much movement the market is pricing.
- Beta: how much the stock swings relative to the market.
Premium and breakeven
Premium is the price of the option, and for a put buyer it is also the maximum possible loss. If Micron never falls below the strike, the $14.8M on the 1050 put simply expires worthless.
Breakeven is the strike minus the premium paid per share. For the 1050 put, that works out to 954.90, about 10% below the current price.
Once you see that this position only pays off after a roughly 10% fall, the trade looks different. The buyer was paying for meaningful downside protection or real conviction, not a small tactical bet.
Even a correct bearish call can lose money once theta and vega erode the premium, which is a real hurdle for a buyer of 101-day puts priced at 49% implied volatility.
Implied volatility and beta
Implied volatility is the size of the price swings the options market expects, expressed as an annual percentage. At 49% on the 1050 put and 52% on the 1070s, the market prices in large moves, and according to the original source it implies roughly a one-in-three chance of Micron reaching that breakeven.
Beta measures how much a stock moves compared with the broader market. Micron’s beta is above 2, meaning it has tended to move more than twice as much as the market, so a modest amount of put protection can offset losses on a much larger stock holding.
Scale matters as well. With Micron’s market capitalisation at about $1.2 trillion, the original source points out that about $15M of near-the-money protection through January barely changes a long-held portfolio. A headline dollar figure can sound dramatic while being small relative to the position it protects.
Bearish bet, hedge or relative-value short: which reading fits best?
With the mechanics in hand, the harder question is motive. The same print supports at least three stories.
The directional bear case
The simplest reading is that the buyer expects Micron to fall. The stock’s failure to advance after a record quarter suggests good news may already be priced in. Michael Burry has been bearish for months, and Morgan Stanley has said the rally is ending, according to the original source. Neither view could be independently confirmed.
Behind that view sits cyclicality. Heavy capex (capital spending on new plants and equipment) to meet AI demand could eventually flood the market with memory chips.
The hedge or collar case
A fund sitting on a large Micron gain may prefer protecting it to selling it. Because Micron’s beta is above 2, near-the-money puts give that protection efficiently.
A collar takes this further: the holder sells call options, which give someone else the right to buy the shares, and uses that income to pay for the puts. Call premium tends to be rich after earnings, so the puts become risk management, not a short.
The relative-value case
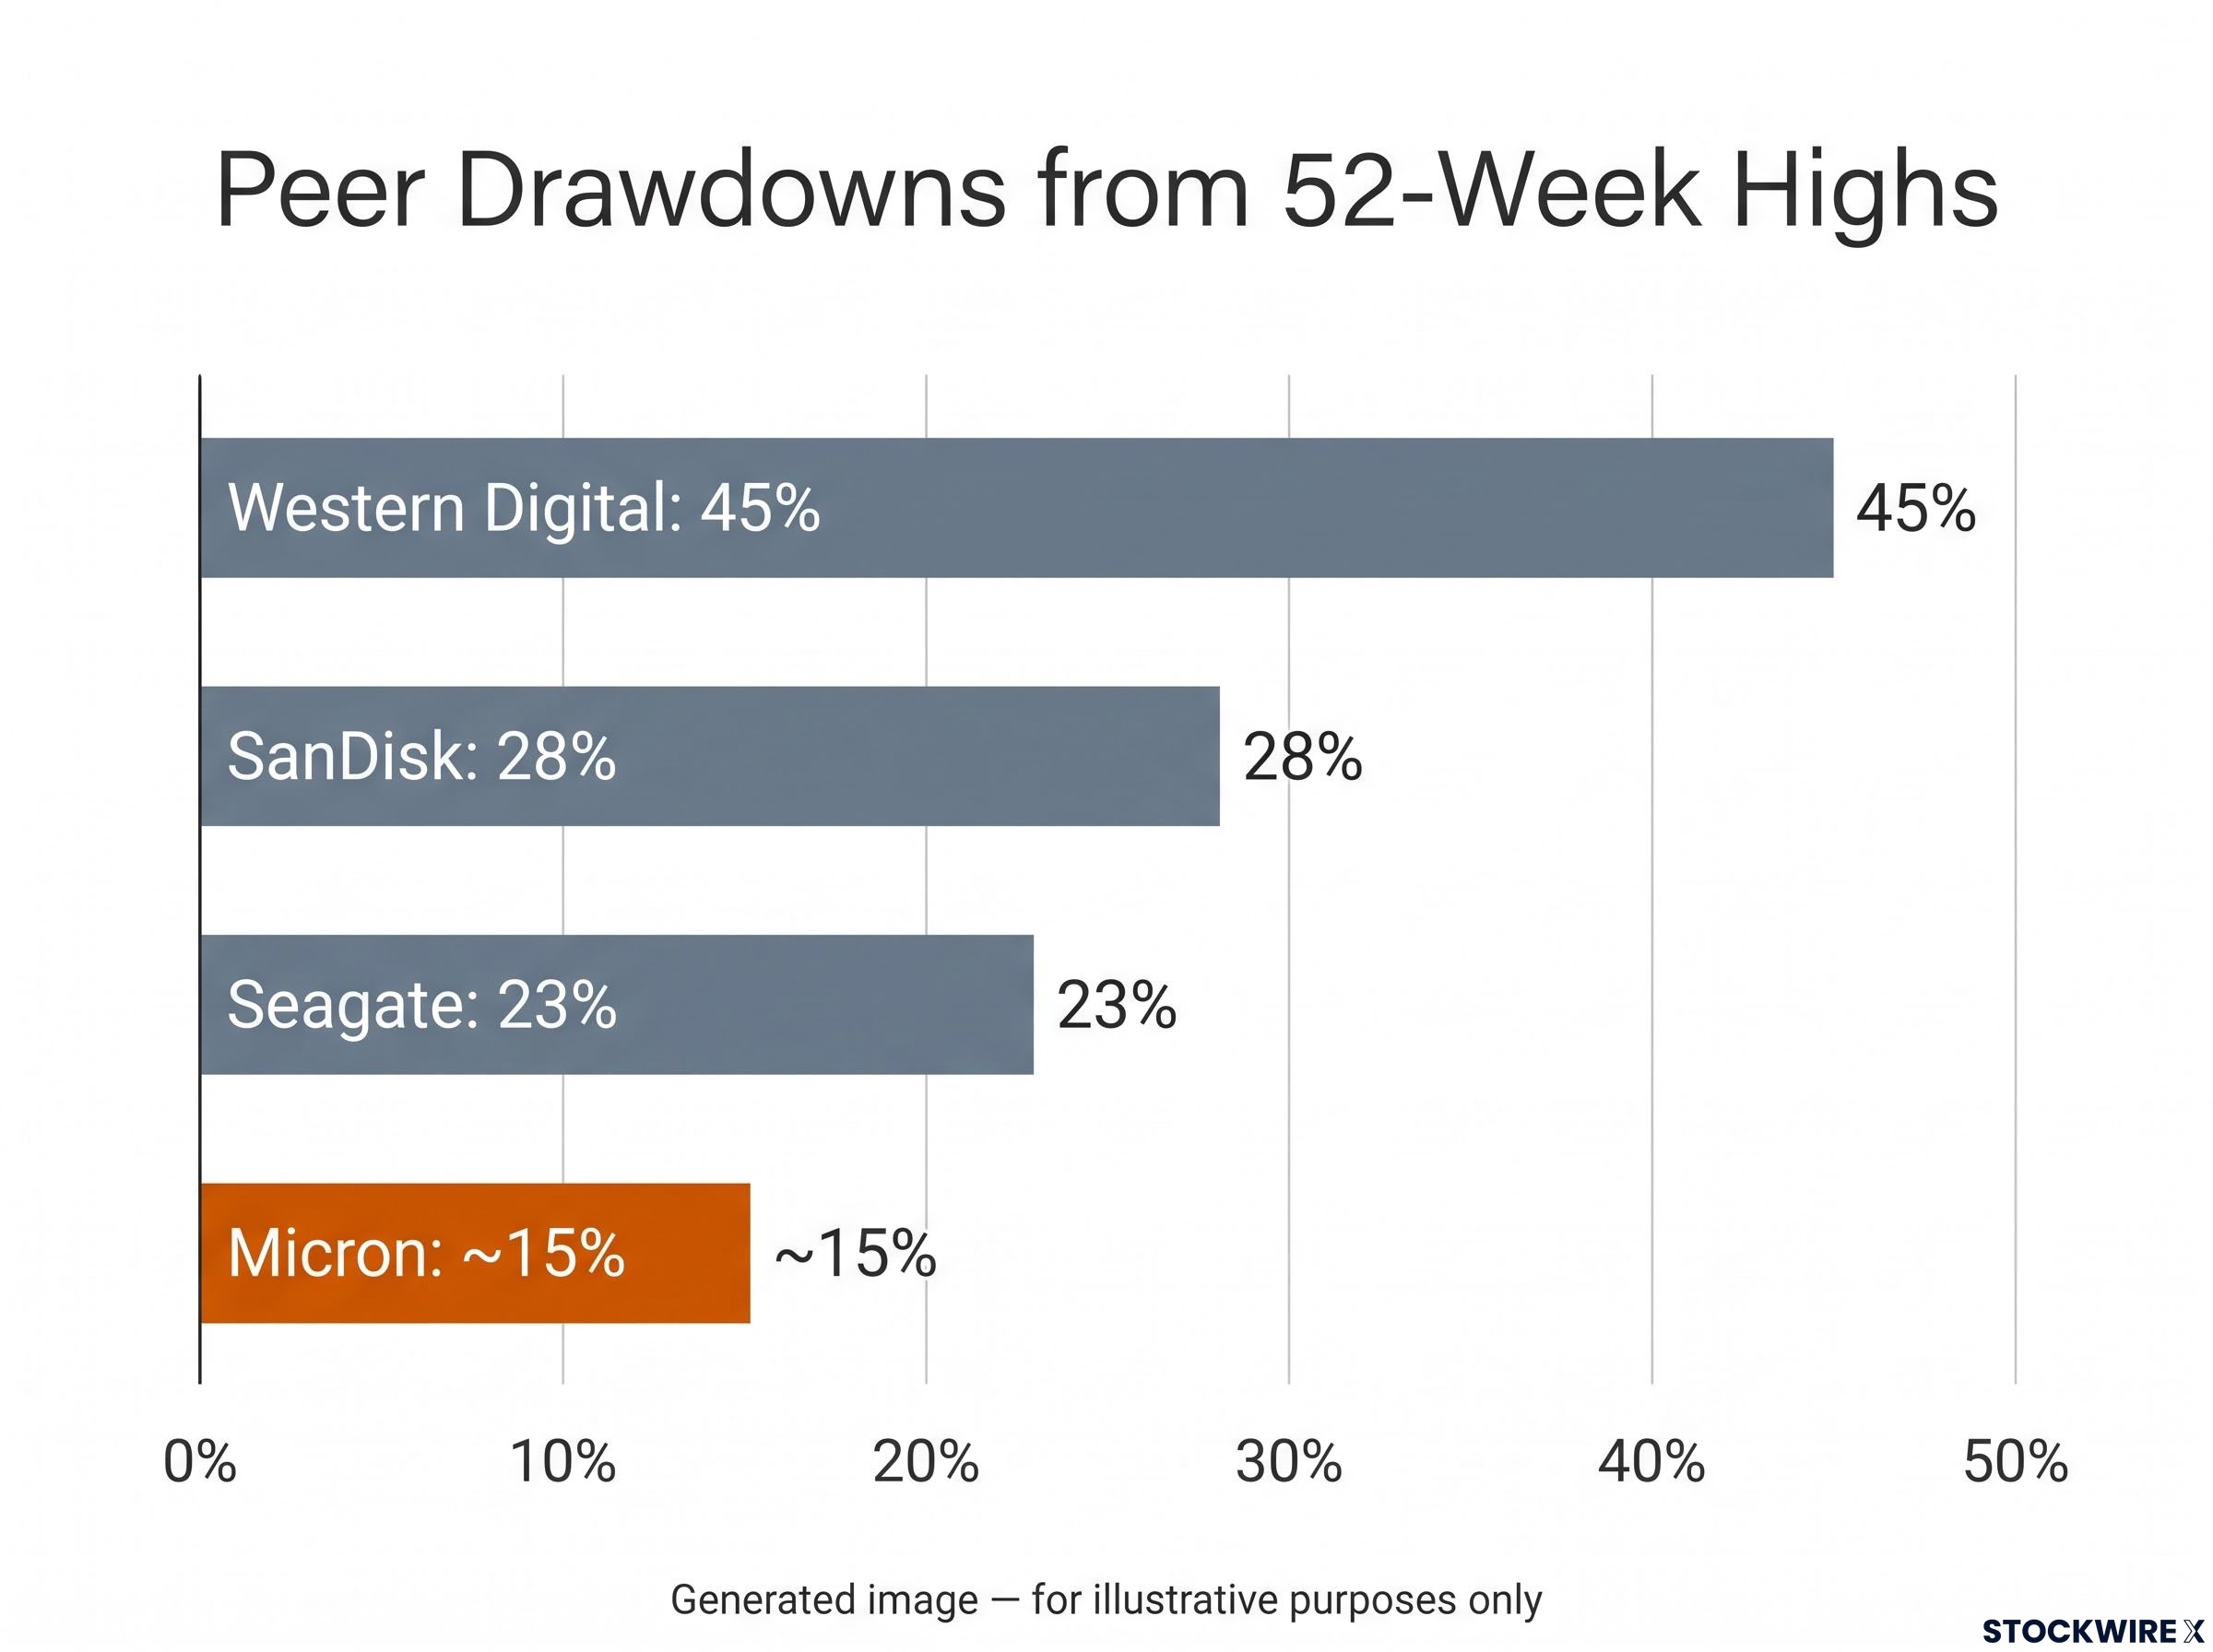
A third possibility is a bet that Micron will do worse than its peers. The peer drawdowns from 52-week highs come from the original source and have not been independently refreshed: Western Digital about 45%, SanDisk 28%, Seagate 23%, and Micron only about 15%.
Supply headlines add fuel. Toshiba announced plans to double hard drive supply in 2027, and Western Digital and Seagate each fell about 10% that day. SK Hynix has a $28 billion buyback coming that may compete for investor capital. Neither detail could be independently confirmed.
A rarer fourth motive is a volatility trade aimed at the term structure, meaning the pattern of implied volatility across different expiry dates.
| Interpretation | What the buyer believes | Evidence for | Evidence against |
|---|---|---|---|
| Directional bear | Good news is priced in; the cycle turns | Muted post-earnings reaction; capex risk | About 6x forward earnings; guidance above consensus |
| Hedge or collar | Protect a large gain without selling | Beta above 2; rich call premium | Other legs of the trade are not visible |
| Relative-value short | Micron is over-earning versus peers | Smallest drawdown in the group | Peer and supply data unconfirmed |
The takeaway is uncomfortable but useful: you cannot assume a single motive without seeing the rest of the position. If you copy the trade, you are copying a decision whose purpose you do not know.
How much weight should a single options print carry?
That ambiguity points to a broader limit on what flow data can tell you. A few caveats apply to any single print:
- Large blocks are often one leg of a spread, collar or ratio trade, and the other legs may not appear in the headline.
- The aggregate $28M figure is unconfirmed beyond the original source.
- A block can be a hedge, a roll to a later date, or a spread, not just a naked bearish bet.
- Protective put programmes have preceded drawdowns in some cycles, while in others the stock consolidated or rose.
Unusual options activity alerts confirm that abnormal volume hit a strike, but they cannot say whether the trade was a directional bet, a hedge or one leg of a spread, which is why a single print deserves limited weight.
The cyclicality argument still deserves a fair hearing. Revenue growth of 379% and margins of 87% are extremes historically associated with late-cycle, commodity-like industries. In past cycles, large capacity expansions eventually pressured prices and margins even while near-term demand stayed strong.
The bullish case is just as concrete. Earnings coverage from CNBC, Yahoo Finance and others points to tight supply of AI-linked products, continued pricing power in DRAM and NAND memory, and demand driven by AI data-centre build-outs rather than traditional PC upgrade cycles.
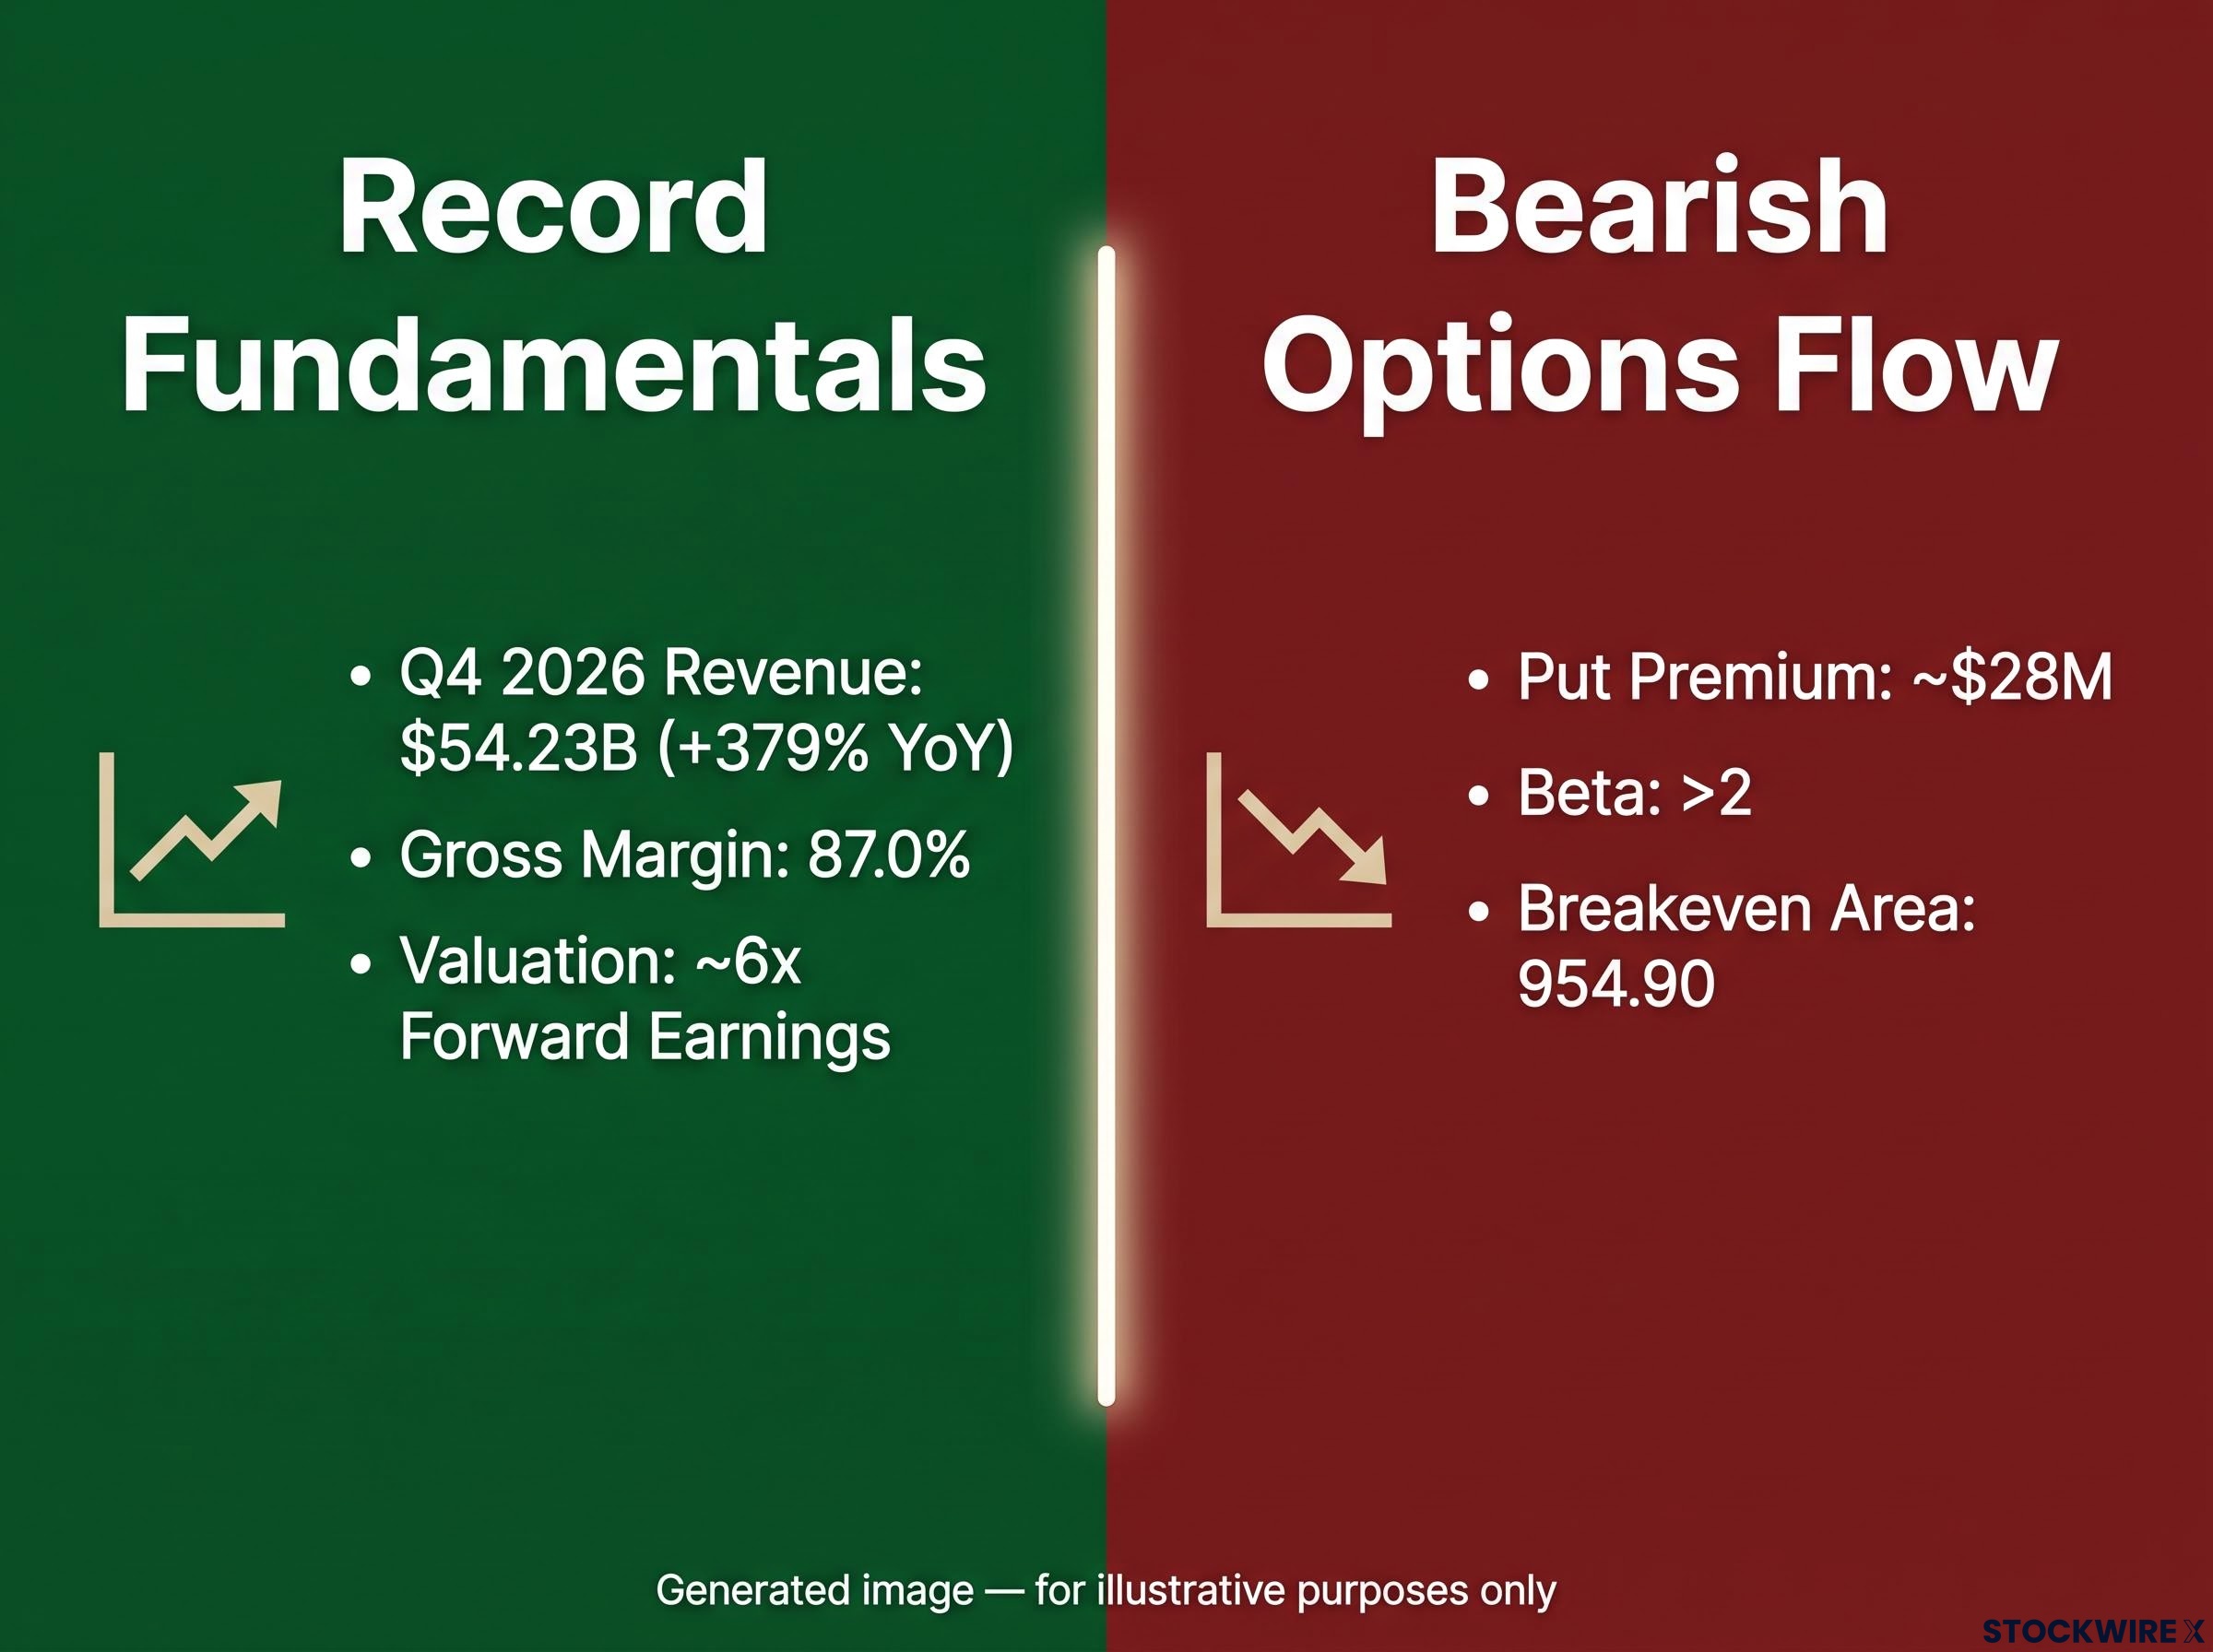
The core tension According to the Tasty Live presenter, the contrast is about expectations: Micron has strong fundamentals and a cheap valuation, set against bearish flow.
Whether these puts are outright shorts will depend on how the stock trades from here. For you, that means treating the flow as one input into a view on expectations versus fundamentals, never as a standalone sell signal. Check what is priced in, check the supply picture, and wait for price action to confirm.
Judging the flow without chasing it: what to watch from here
Record fundamentals and bearish flow can both be rational at once. The gap between them is about expectations, not about whether Micron’s business is strong.
Three things are worth tracking:
- Price action around the 954.90 breakeven area and into January expiry.
- Supply and capex news from memory peers, including Toshiba and SK Hynix.
- Further evidence on whether the flow is outright or part of a hedge.
Before you act, decide what you are doing: hedging a gain, taking a view, or simply observing. Size any position to match that decision, not the headline.
This article is for informational purposes only and should not be considered financial advice. Investors should conduct their own research and consult with financial professionals before making investment decisions. Past performance does not guarantee future results, and forward-looking views are speculative and subject to change based on market developments and company performance.