
At today’s average 30-year fixed rate of 6.87%, the mathematical gap between paying off a mortgage and investing in the stock market has collapsed to near zero for millions of American homeowners. The advice that once seemed straightforward, invest the difference and let compounding do the work, was calibrated for a world where mortgages sat at 3% and the S&P 500’s historical average created a comfortable seven-percentage-point spread. In May 2026, that spread is less than half a percentage point for borrowers who do not itemise deductions, and the decision is genuinely close for most.
This guide delivers a sequenced, rate-anchored decision framework rather than a universal answer. By the end, readers will know exactly where their mortgage rate sits relative to the thresholds that matter, which financial steps to complete before the mortgage-versus-invest question even becomes relevant, and what combination of factors tips the decision in their specific situation.
The financial landscape has shifted, and most popular advice has not caught up
The “always invest the difference” guidance that dominates popular finance books and social media carries an embedded assumption most readers have never examined: a wide spread between borrowing costs and expected market returns. In 2021, a homeowner locking in a 3% mortgage and directing surplus cash toward equities could reasonably expect a 7% after-tax return from a diversified stock portfolio. That four-percentage-point gap made the investing case almost automatic.
The gap no longer exists for most borrowers.
As of 8-9 May 2026, the average 30-year fixed rate sits at 6.87% according to Freddie Mac’s weekly survey, with Mortgage News Daily reporting 6.92% and Bankrate at 6.89%. Institutional 10-year U.S. equity return forecasts cluster between 5% and 6.5% nominal: Vanguard projects 4.3%-6.3%, JPMorgan approximately 6.0%, and BlackRock 5.2%-6.8%. For a non-itemising homeowner, the spread between the guaranteed prepayment return and the variable equity forecast is now marginal at best.
The institutional equity return forecasts for 2026 that underpin this framework are themselves shaped by a macro backdrop in which the Federal Reserve has held rates at 3.50%-3.75% for five consecutive meetings, core PCE has climbed to 3.2%, and JPMorgan has raised its stagflation scenario probability to 35%, all of which explain why Vanguard, JPMorgan, and BlackRock are converging on the 5%-6.5% nominal range rather than the historical 10% figure.
Freddie Mac’s Primary Mortgage Market Survey has tracked weekly 30-year fixed mortgage rates since 1971, making it the benchmark data source that lenders, analysts, and policymakers use to assess where borrowing costs stand relative to historical norms.
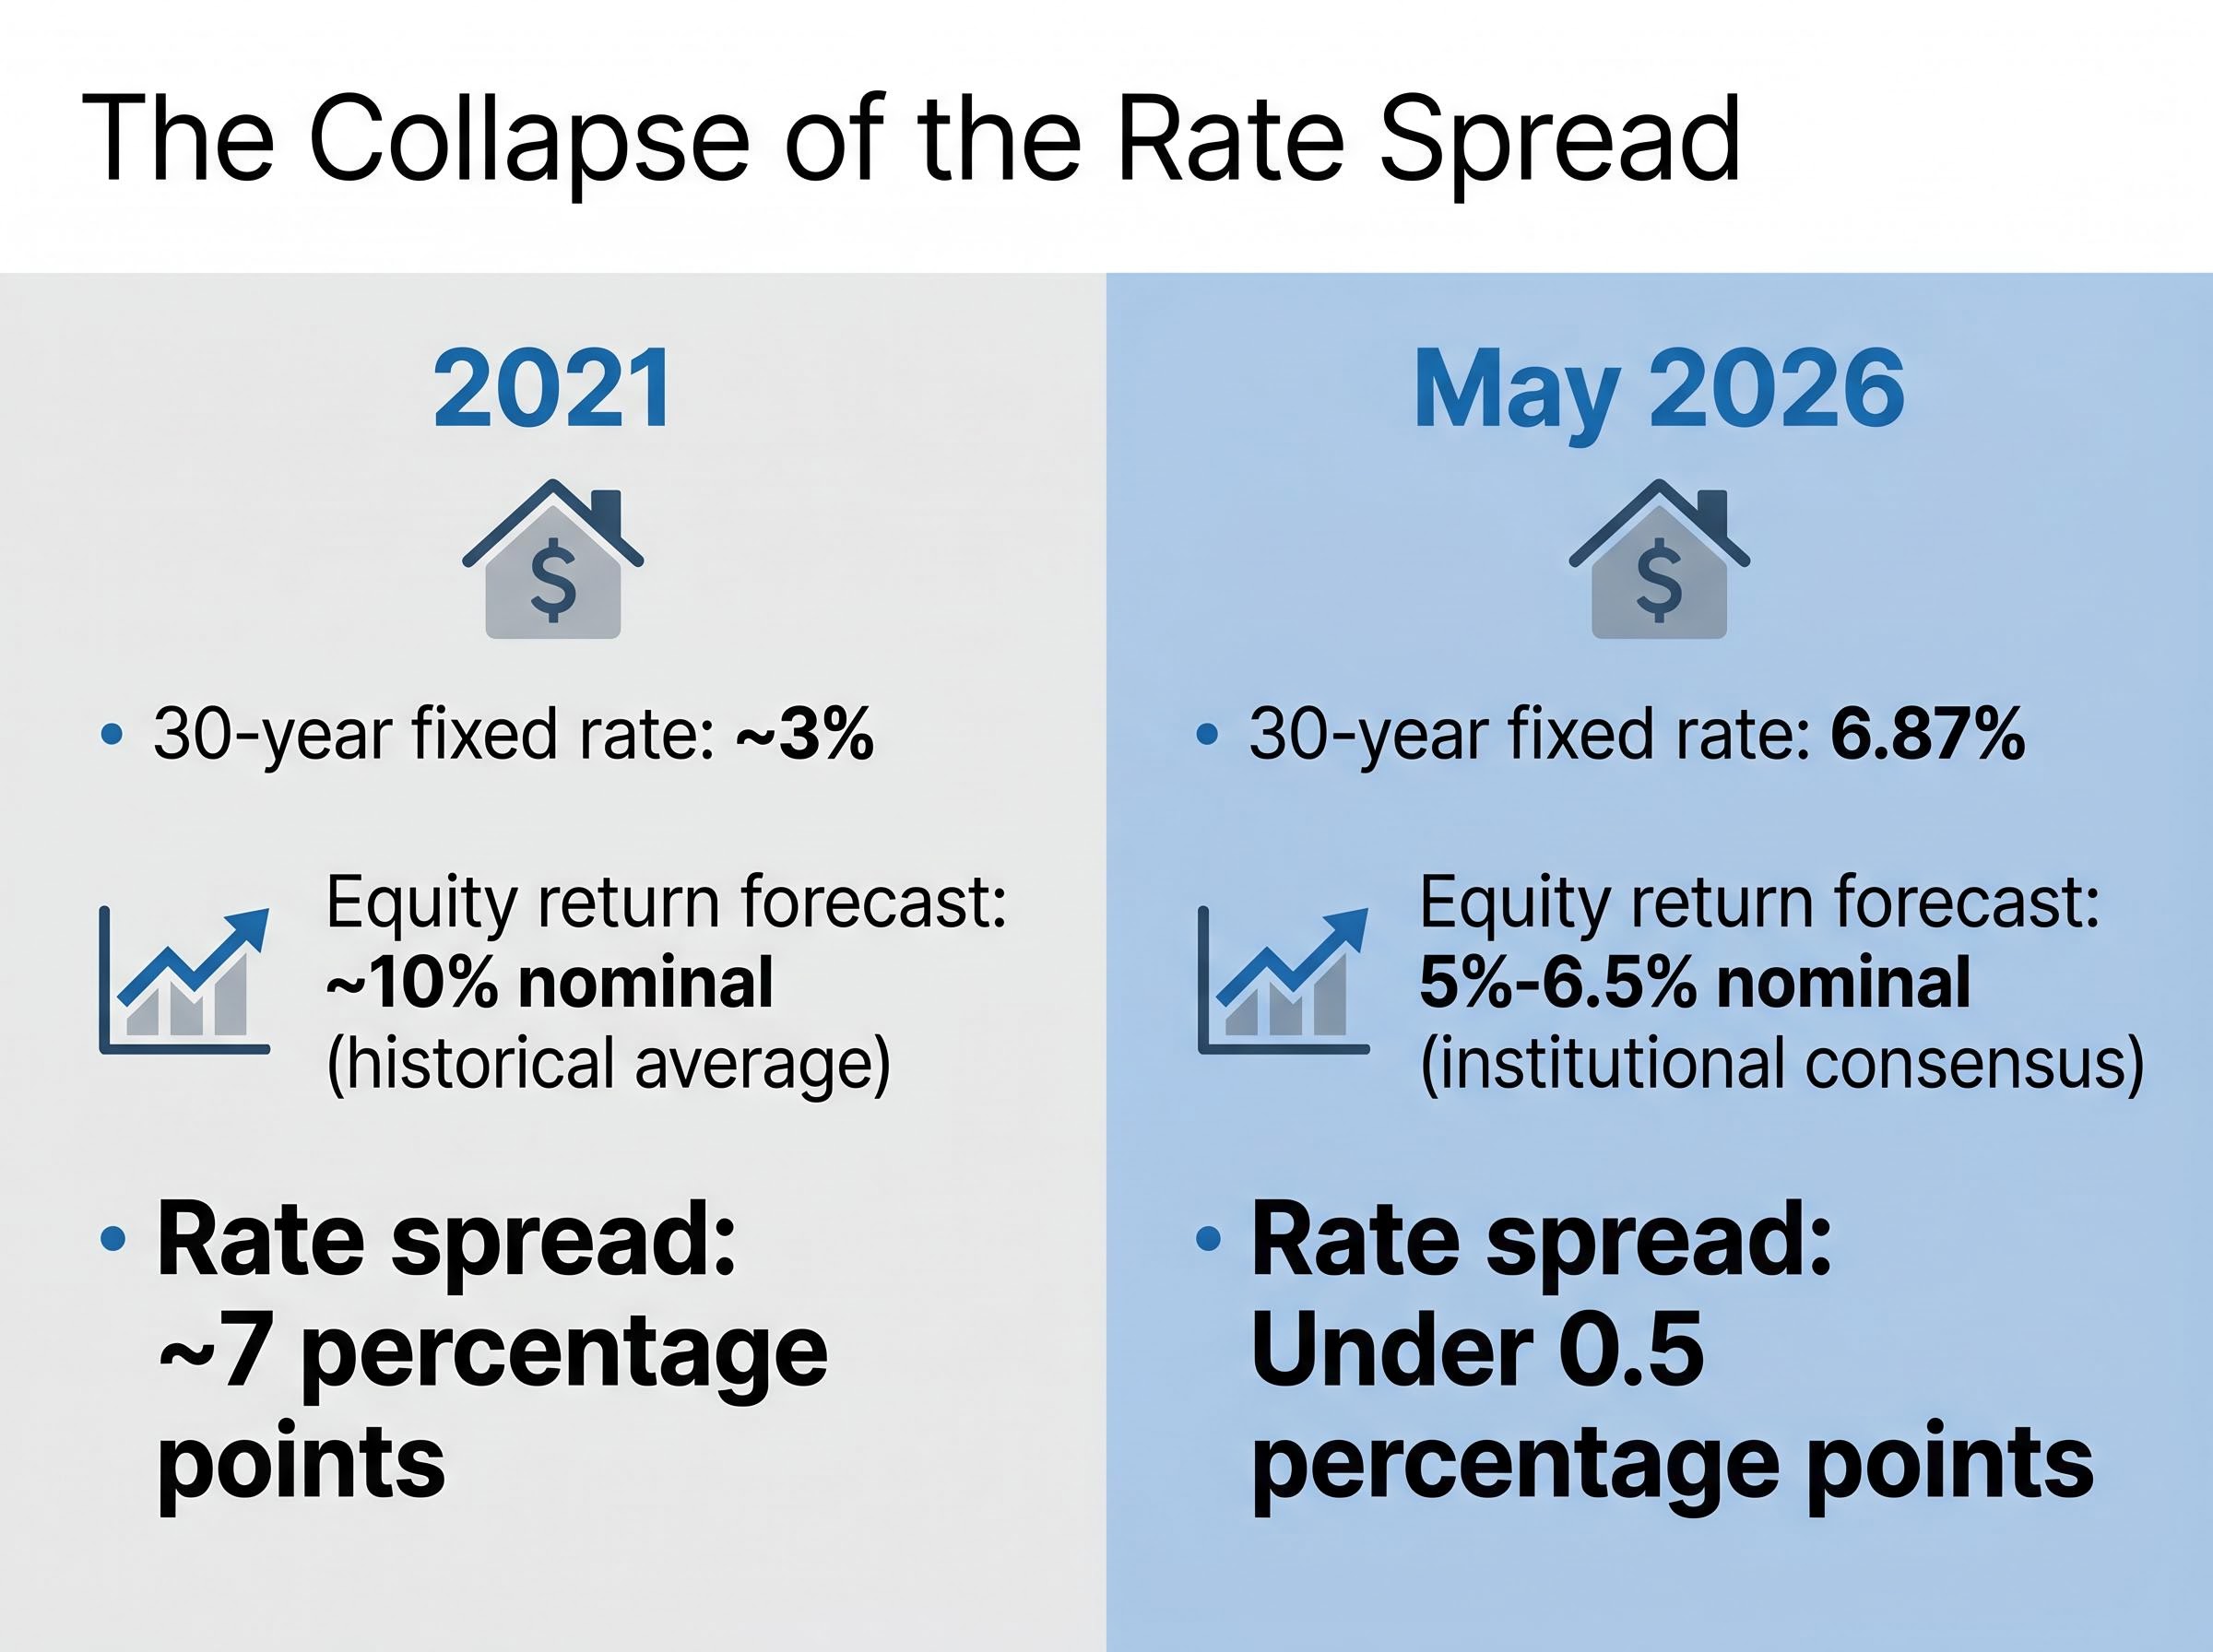
“In 2021, investing over prepayment meant a four-percentage-point spread in your favour. In May 2026, that spread is less than half a point for most borrowers.”
The decision is now genuinely rate-specific, not universal. A borrower’s exact mortgage rate is the single most important variable.
| Condition | 2021 | May 2026 |
|---|---|---|
| Average 30-year fixed rate | ~3% | 6.87% |
| Realistic equity return forecast | ~10% nominal (historical average) | 5%-6.5% nominal (institutional consensus) |
| Rate spread (non-itemiser) | ~7 percentage points | Under 0.5 percentage points |
| Verdict | Investing strongly favoured | Decision is genuinely close |
When big ASX news breaks, our subscribers know first
What to tackle before the mortgage-versus-invest question becomes relevant
For most households, the mortgage-versus-invest question is premature. A strict four-step priority sequence should be completed first, and skipping it is not a shortcut; it is the most expensive financial mistake available.
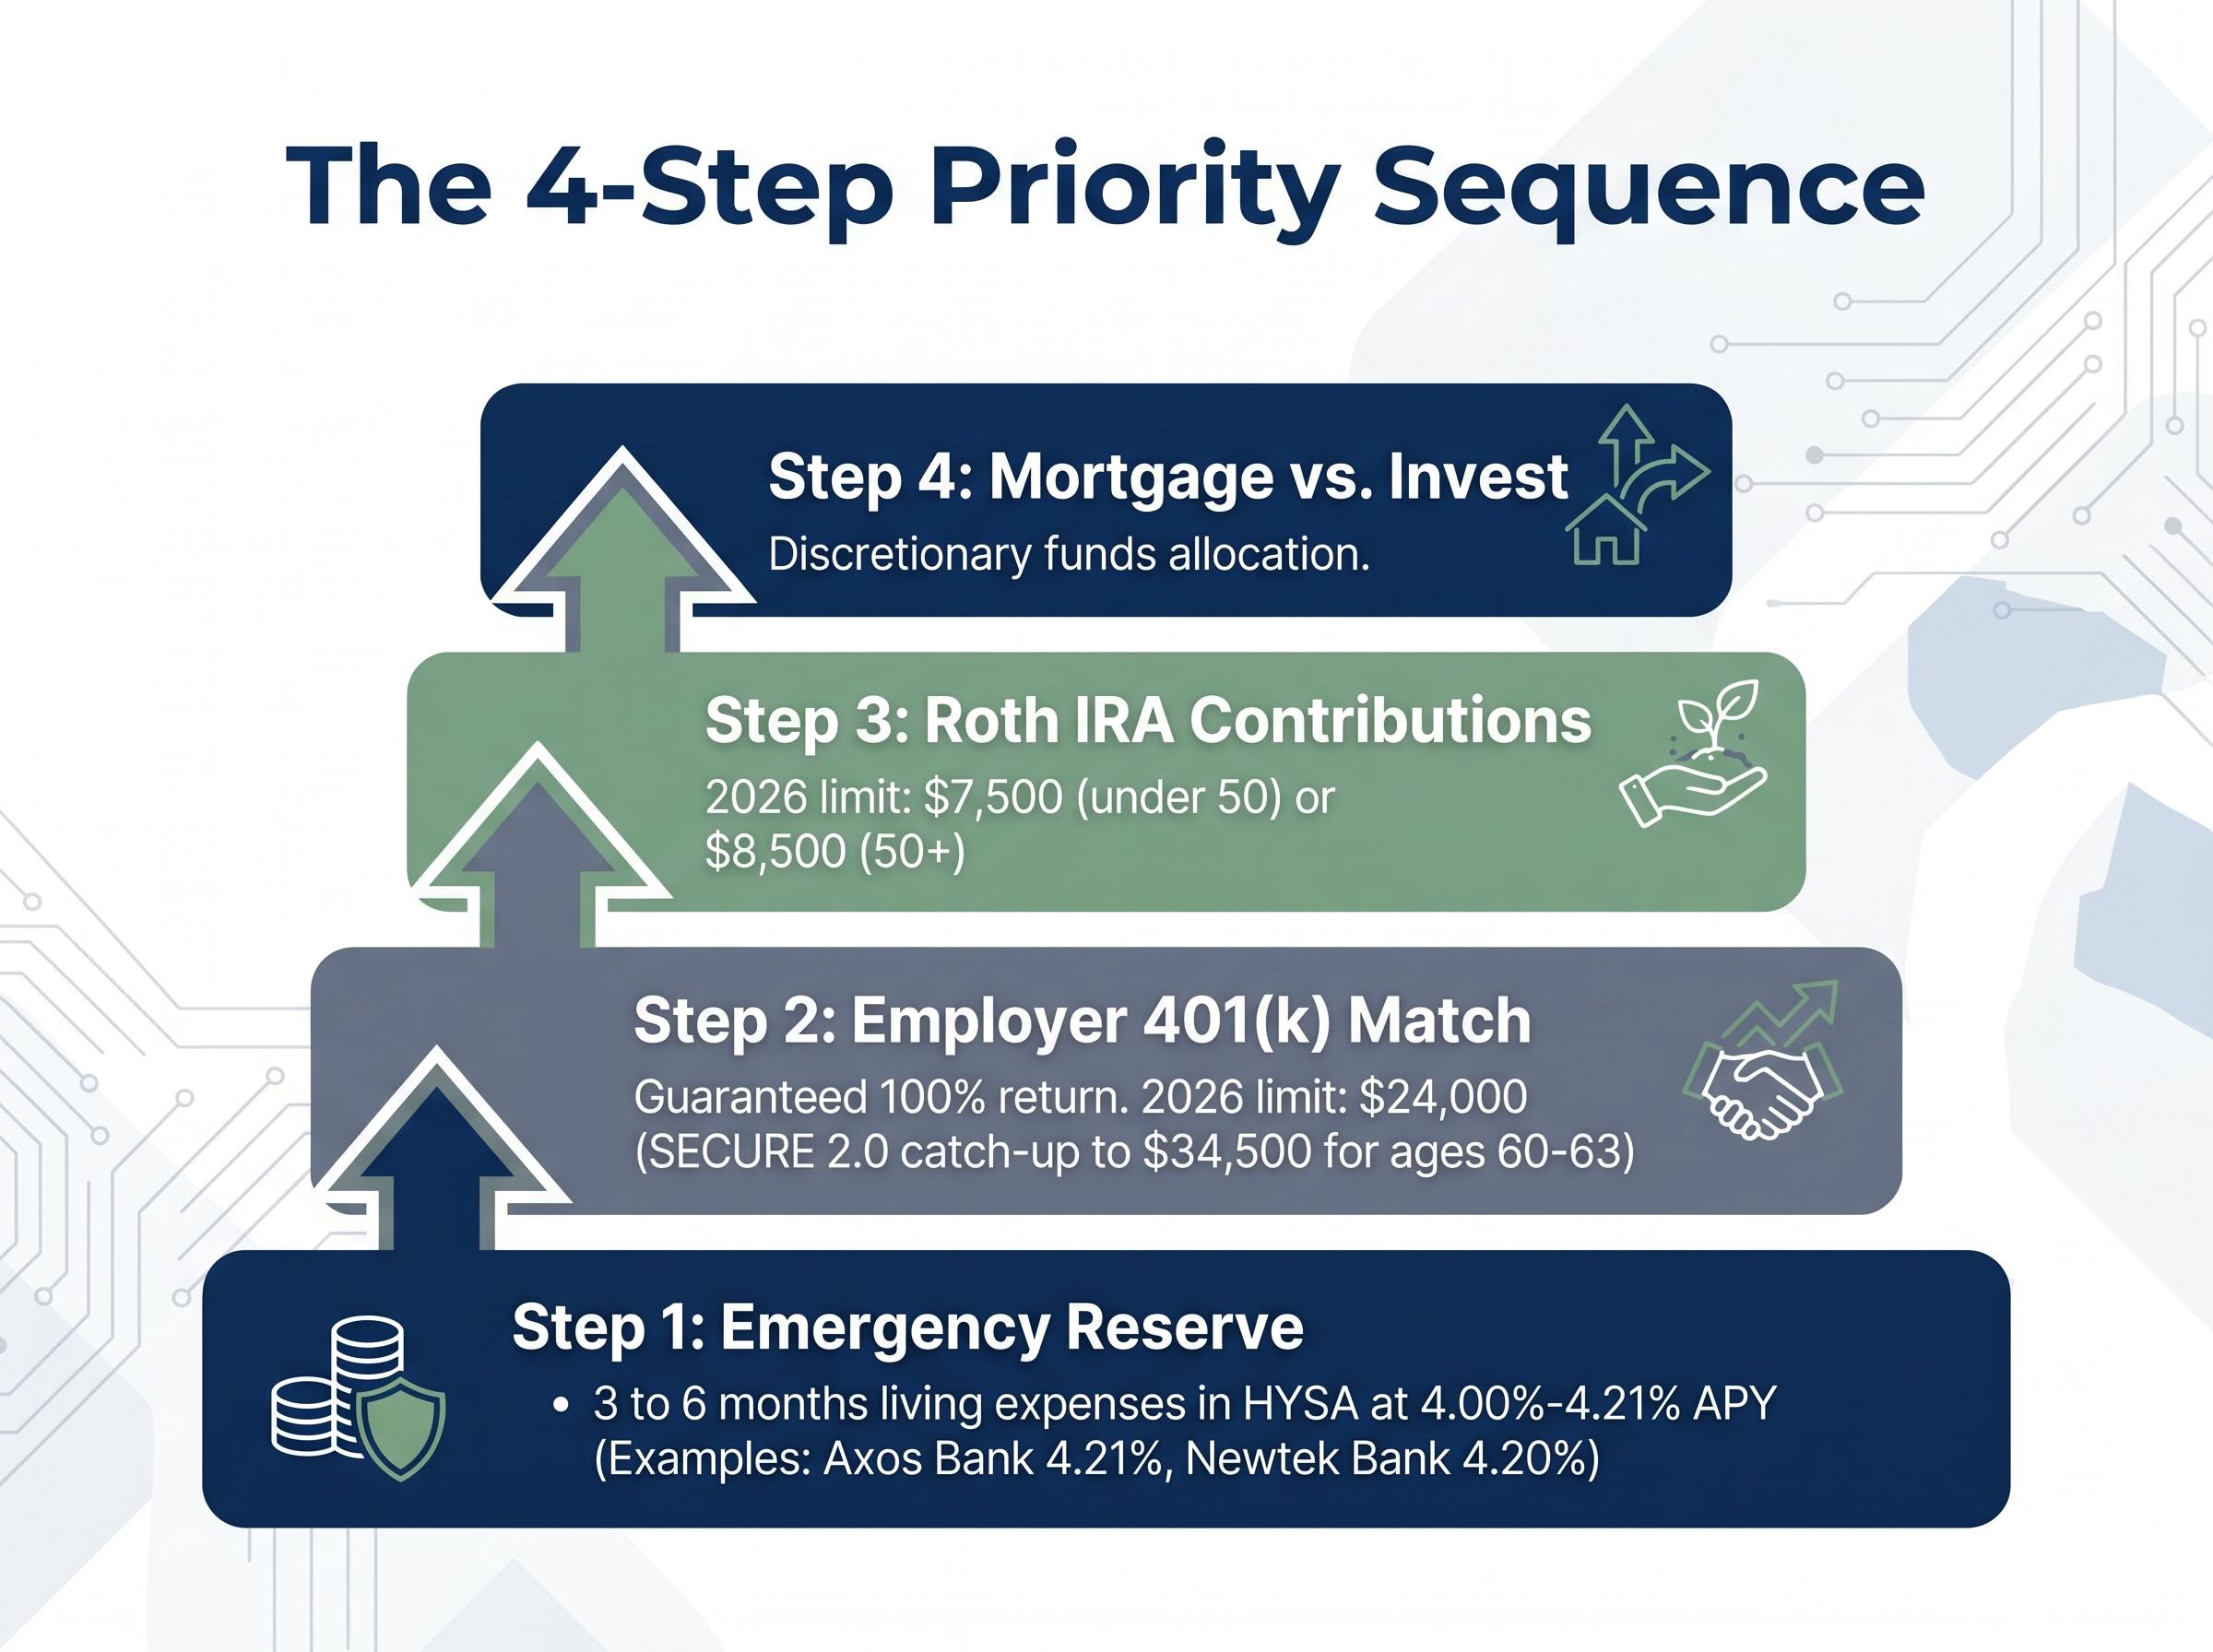
- Fund the emergency reserve. Three to six months of living expenses in a high-yield savings account earning 4.00%-4.21% APY (competitive rates from institutions such as Axos Bank at 4.21% and Newtek Bank at 4.20%) provides a non-negotiable buffer. Underfunding this reserve is one of the most common triggers for forced high-cost borrowing.
- Capture the full employer 401(k) match. A dollar-for-dollar match is a guaranteed 100% return on each contributed dollar. No mortgage prepayment at 6.9% and no equity investment at 6% comes close. Leaving match money uncaptured to prepay a mortgage is a decision to forfeit free money.
- Maximise Roth IRA contributions. The 2026 Roth IRA limit is $7,500 (under 50) or $8,500 (age 50 and older), with income phase-outs beginning at $153,000 MAGI for single filers and $240,000 for married filing jointly. Roth IRAs offer permanent tax-free compounding and a unique feature often overlooked: contributed principal can be withdrawn at any time without penalty, which directly addresses the liquidity concern that pushes some borrowers toward prepayment.
IRS Notice 2025-67 sets out the official 2026 cost-of-living adjustments for retirement accounts, including the Roth IRA income phase-out thresholds and contribution limits that determine how much tax-advantaged capacity a household has before discretionary funds reach the mortgage-versus-invest decision.
- Then, and only then, address the mortgage-versus-invest decision with remaining discretionary funds.
“The employer 401(k) match is the only guaranteed 100% return available to most workers. Prepaying a mortgage before capturing it is a decision to leave free money on the table.”
The 2026 standard 401(k) contribution limit is $24,000, with catch-up provisions for older workers that meaningfully expand tax-advantaged capacity.
A note for borrowers age 50 and older
SECURE 2.0 provisions have created enhanced catch-up contribution limits for workers aged 60-63, bringing the total 401(k) limit to $34,500 for this cohort. For near-retirement homeowners, maximising these limits before directing funds to mortgage prepayment serves two purposes: it expands the tax-advantaged compounding runway, and it directly reduces sequence-of-returns risk during the years when portfolio drawdowns are most damaging. The mortgage-versus-invest question becomes the dominant allocation decision only after these limits are fully utilised.
For readers approaching retirement who want to operationalise the sequence-of-returns protection that mortgage elimination partially provides, our dedicated guide to the retirement bucket strategy covers how to size all three buckets based on your income gap, which instruments belong in each bucket, and when to begin the transition so no forced equity liquidation is required in a bear market scenario.
What your mortgage rate actually tells you about which path makes sense
The rate-anchored framework below is not a set of arbitrary rules. It is the logical output of comparing a guaranteed return (mortgage prepayment at the borrower’s rate) against a variable return (equity investing at institutional consensus forecasts of 5%-6.5% nominal). Three zones emerge.
| Mortgage Rate Zone | Default Strategy | Who This Typically Applies To | Caveat |
|---|---|---|---|
| Below 5% | Investing favoured | Pandemic-era borrowers (2020-2022) | Spread remains wide enough that prepayment offers little mathematical justification |
| 5%-6.5% | Hybrid; personal factors dominate | Majority of current U.S. borrowers | Risk tolerance, tax bracket, and time horizon determine the split |
| Above 6.5%-7% | Prepayment favoured | Loans originated late 2023 to early 2025 | Case weakens for high-bracket itemisers |
| Itemisers (any zone) | Recalculate using after-tax rate | High earners with large deductions exceeding standard deduction | May shift effective zone downward by 1-2 percentage points |
Borrowers with sub-5% pandemic-era mortgages retain a spread wide enough that prepayment offers minimal mathematical advantage over investing. For the 7%-8% cohort, the guaranteed prepayment return meaningfully exceeds even the optimistic end of the institutional equity forecast range on a risk-adjusted basis.
Calculating your actual after-tax mortgage cost
For borrowers who itemise deductions, the nominal mortgage rate overstates the true cost of the debt. The formula is straightforward: effective after-tax rate equals the mortgage rate multiplied by (1 minus the marginal tax rate).
At a 6.9% nominal mortgage rate, the effective after-tax rates are:
- 24% tax bracket: approximately 5.24%
- 32% tax bracket: approximately 4.69%
- 37% tax bracket: approximately 4.35%
At the 37% bracket, a 6.9% nominal rate becomes an effective 4.35% cost, which sits firmly in the zone where investing carries a meaningful advantage against institutional equity forecasts of 5%-6.5%.
However, most U.S. homeowners do not itemise in 2026. The standard deduction for married filing jointly is approximately $29,200, and unless total itemised deductions (mortgage interest, state and local taxes capped at $10,000, and charitable giving) exceed that threshold, the full nominal rate is the relevant comparison figure. For the majority, the full 6.87%-6.92% applies.
The honest case for paying down your mortgage faster
At 6.87%-6.92%, mortgage prepayment delivers a guaranteed, risk-free effective return that exceeds the low-end institutional equity forecast and matches the midpoint on a risk-adjusted basis. The math deserves to be stated plainly rather than dismissed as a conservative or emotional choice.
The case rests on four distinct advantages:
- Guaranteed return. Prepaying a 6.87% mortgage delivers exactly 6.87% on every dollar applied, with zero variance. Equity markets offer a projected 5%-6.5% nominal return with an annual standard deviation of approximately 15%-20%.
- Behavioural return gap. The average investor underperforms the market by 1%-2% annually due to panic selling and mistimed re-entry. That behavioural drag further narrows or eliminates the invest-the-difference advantage in practice.
- Retirement expense reduction. Eliminating a fixed mortgage payment before retirement removes a mandatory expense, reduces sequence-of-returns risk during the most financially vulnerable years, and avoids forced asset liquidation during market downturns.
- No tax on interest savings. The guaranteed return from prepayment is not subject to capital gains tax, unlike investment returns.
“At 6.87%, prepaying your mortgage delivers a guaranteed return that beats U.S. Treasury bonds by 2.5 percentage points and HYSA rates by nearly 2.7 points, with zero market risk.”
Modelled scenarios reinforce the point: at a 6% market return, the prepayment strategy outperforms investing by approximately $40,000 over 30 years. At 5%, the advantage widens to approximately $100,000. A borrower who directs an additional $500 per month toward principal can eliminate roughly $38,000 in future interest within the first five years alone.
The case weakens for high-bracket itemisers whose effective rate drops below 5%, and for investors with long horizons and high risk tolerance who can weather multi-year drawdowns without selling. For everyone else at current rates, prepayment is not merely the safe choice; it is the mathematically defensible one.
The case for investing, and where prepayment quietly becomes a liability
Prepayment’s virtues, guaranteed return, no market risk, emotional satisfaction, carry a cost that becomes visible only when circumstances change. Home equity is real wealth that cannot be spent without either selling the property or taking on new, higher-cost debt. Aggressive prepayment concentrates financial resources in the least liquid asset most Americans own.
The core vulnerabilities are:
- Liquidity concentration. Every extra dollar sent to the mortgage is a dollar that cannot be accessed quickly. In an emergency, that wealth is effectively locked.
- Loss of low-cost leverage. A fixed-rate mortgage is the lowest-cost borrowing most Americans can access. Early payoff permanently surrenders that leverage.
- Upside forgone in strong markets. At higher equity return outcomes, the opportunity cost of prepayment is substantial and compounding.
“If you lose your job and need $40,000, a brokerage account delivers it in three business days. A HELOC takes six weeks to approve and may be denied at the exact moment you need it most.”
The emergency access comparison deserves concrete numbers. Accessing $40,000 through a HELOC in 2026 costs an estimated $1,000-$3,000 in closing costs plus 8%-9% interest, takes 4-6 weeks to approve, and can be denied if the applicant has recently lost employment. The same $40,000 from a taxable brokerage account arrives in approximately three business days, with an estimated capital gains tax cost of $3,000-$4,000 on appreciated holdings.
When the math swings decisively toward investing
At an 8% equity return, the invest-the-difference strategy outperforms prepayment by approximately $90,000 over 30 years. At 10%, the advantage widens to approximately $200,000.
These scenarios are not guaranteed, but they are historically plausible over 30-year horizons. For younger borrowers with sub-5% pandemic-era mortgages and high risk tolerance, the combination of a wide rate spread and decades of compounding makes the investing path difficult to argue against on purely mathematical grounds. The capital gains tax liability on a $600,000 portfolio where $400,000 represents gains would be approximately $60,000 at the 15% federal long-term rate, a meaningful cost but one that still leaves a substantial outperformance margin intact.
Equity compounding over long horizons is structurally front-loaded in the second decade rather than the first, meaning younger borrowers with sub-5% mortgages and 25-plus years of investment runway face a compounding penalty for early prepayment that grows larger with every year the principal is diverted away from equities.
A structured hybrid allocation for borrowers in the gray zone
For the majority of borrowers sitting in the 5%-6.5% range, neither pure path dominates. Modelled at a 6.5% mortgage rate and 7% market return, the invest-the-difference strategy leads by approximately $21,000 after tax over 30 years, less than a 2.5% difference in outcome. At a 6% return, prepayment leads by approximately $40,000. At 8%, investing leads by approximately $90,000.
The margin is thin enough that a structured hybrid allocation is not a compromise. It is the practically optimal strategy for most borrowers in this zone.
- Complete the four priority steps outlined earlier (401(k) match, Roth IRA, emergency fund, then discretionary allocation).
- Determine rate zone using the mortgage rate and, if applicable, the after-tax effective rate calculation.
- Apply the corresponding split ratio. At 5%-6% mortgage rates, a 40%-60% split (40% extra principal, 60% investing) serves as a reasonable default. At 6%-6.5%, consider flipping to 60%-40%. Above 6.5%, tilt toward prepayment unless the borrower is a high-bracket itemiser.
| Mortgage Rate | Itemiser Status | Risk Tolerance | Recommended Allocation |
|---|---|---|---|
| Below 5% | Any | Any | 80%-100% investing |
| 5%-6% | Non-itemiser | Moderate-high | 40% prepayment / 60% investing |
| 5%-6% | Itemiser (24%+ bracket) | Moderate-high | 20% prepayment / 80% investing |
| 6%-6.5% | Non-itemiser | Moderate | 60% prepayment / 40% investing |
| 6%-6.5% | Itemiser (32%+ bracket) | Moderate-high | 40% prepayment / 60% investing |
| Above 6.5% | Non-itemiser | Low-moderate | 80%-100% prepayment |
| Above 6.5% | Itemiser (37% bracket) | High | 40% prepayment / 60% investing |
The psychological dimension matters here as well. For borrowers who would not consistently invest discretionary funds during market downturns, prepayment functions as a forced savings mechanism with a guaranteed return. That is meaningfully better than investing in theory but not in practice.
Behavioural return drag costs the average investor an estimated 1%-2% per annum through panic selling and mistimed re-entry, which is why the hybrid allocation table above should be treated as a commitment device rather than a starting point for active rebalancing.
The allocation is not permanent. Mortgage rates, equity return expectations, and personal circumstances shift. Revisit the framework annually, or whenever a refinance, income change, or material shift in Treasury yields or equity forecasts warrants reassessment.
How your mortgage rate determines which strategy wins
At May 2026 mortgage rates, neither prepayment nor investing delivers a decisive, guaranteed mathematical victory for most borrowers. That is itself the most important conclusion.
Below 5%, investing is strongly favoured. Above 6.5%, prepayment carries a clear risk-adjusted edge for non-itemisers. Between 5% and 6.5%, a structured hybrid allocation matched to the borrower’s rate, tax situation, and risk tolerance is the most defensible path.
Behavioural consistency outperforms theoretical optimality. A borrower who reliably prepays at 6.5% will outperform one who plans to invest but sells during a downturn. A borrower who invests consistently through market cycles will outperform one who prepays but panics in retirement. The framework above provides the starting allocation. Discipline provides the returns.
Revisit these thresholds annually, particularly after a refinance, a significant income change, or a material shift in Treasury yields or equity return forecasts.
This article is for informational purposes only and should not be considered financial advice. Investors should conduct their own research and consult with financial professionals before making investment decisions. Past performance does not guarantee future results. Financial projections are subject to market conditions and various risk factors.