A fund that screens well for dividend yield is not necessarily a fund that has performed well. The distinction sounds subtle, but it is structural: dividend yield is a ratio of distributions to price, which means a falling share price mechanically inflates the number that catches your eye on a screener. The metric does not lie, exactly. It just rewards the wrong thing.
Fidelity MSCI Real Estate Index ETF (FREL) makes a useful lens for this problem because it is a straightforward, low-cost fund that does precisely what its category promises. It tracks a broad U.S. real estate index, charges 0.084% in fees, and pays quarterly distributions. The issue is not the fund. The issue is what happens when a strategy is built around a single number that looks generous partly because of a legal structure most investors never examine.
Here is what the 30-year compounding math actually shows about a yield-first approach, including the specific dollar gap between chasing dividend yield and building a portfolio around total return. The difference is not marginal. It is measured in millions.
Why a higher yield on your screener can mean a worse investment
Dividend yield is annualised distributions divided by the current share price. That formula contains a trap most screeners will never flag for you.
When a fund’s price falls and its distribution holds steady, yield rises. Nothing about the fund improved. No new tenants signed leases. No rents increased. The price dropped, and the ratio responded. A fund whose price goes sideways while distributions remain roughly constant will register as increasingly high-yielding over time, even when its total return record has been unremarkable.
“A fund whose price stagnates while continuing to pay similar dividends will appear higher-yielding over time, even if its total return has been mediocre.”
This is where the psychological appeal does its damage. Quarterly cash hitting your brokerage account feels like evidence that the investment is working. It is tangible. It is regular. And it masks a distinction that matters enormously over decades: the difference between income generation and wealth creation.
The quarterly cash feels like a reward, but dividend mechanics ensure the share price falls by approximately the payment amount on the ex-dividend date, leaving total wealth unchanged before tax at the moment of distribution.
Two conditions mechanically produce a higher yield without any fundamental improvement:
- The fund’s price falls while distributions hold steady
- The fund’s price stagnates while the broader market advances, making the yield look comparatively generous
One condition should produce a higher yield:
- Distributions rise on a stable or appreciating price, reflecting genuine improvement in the underlying assets
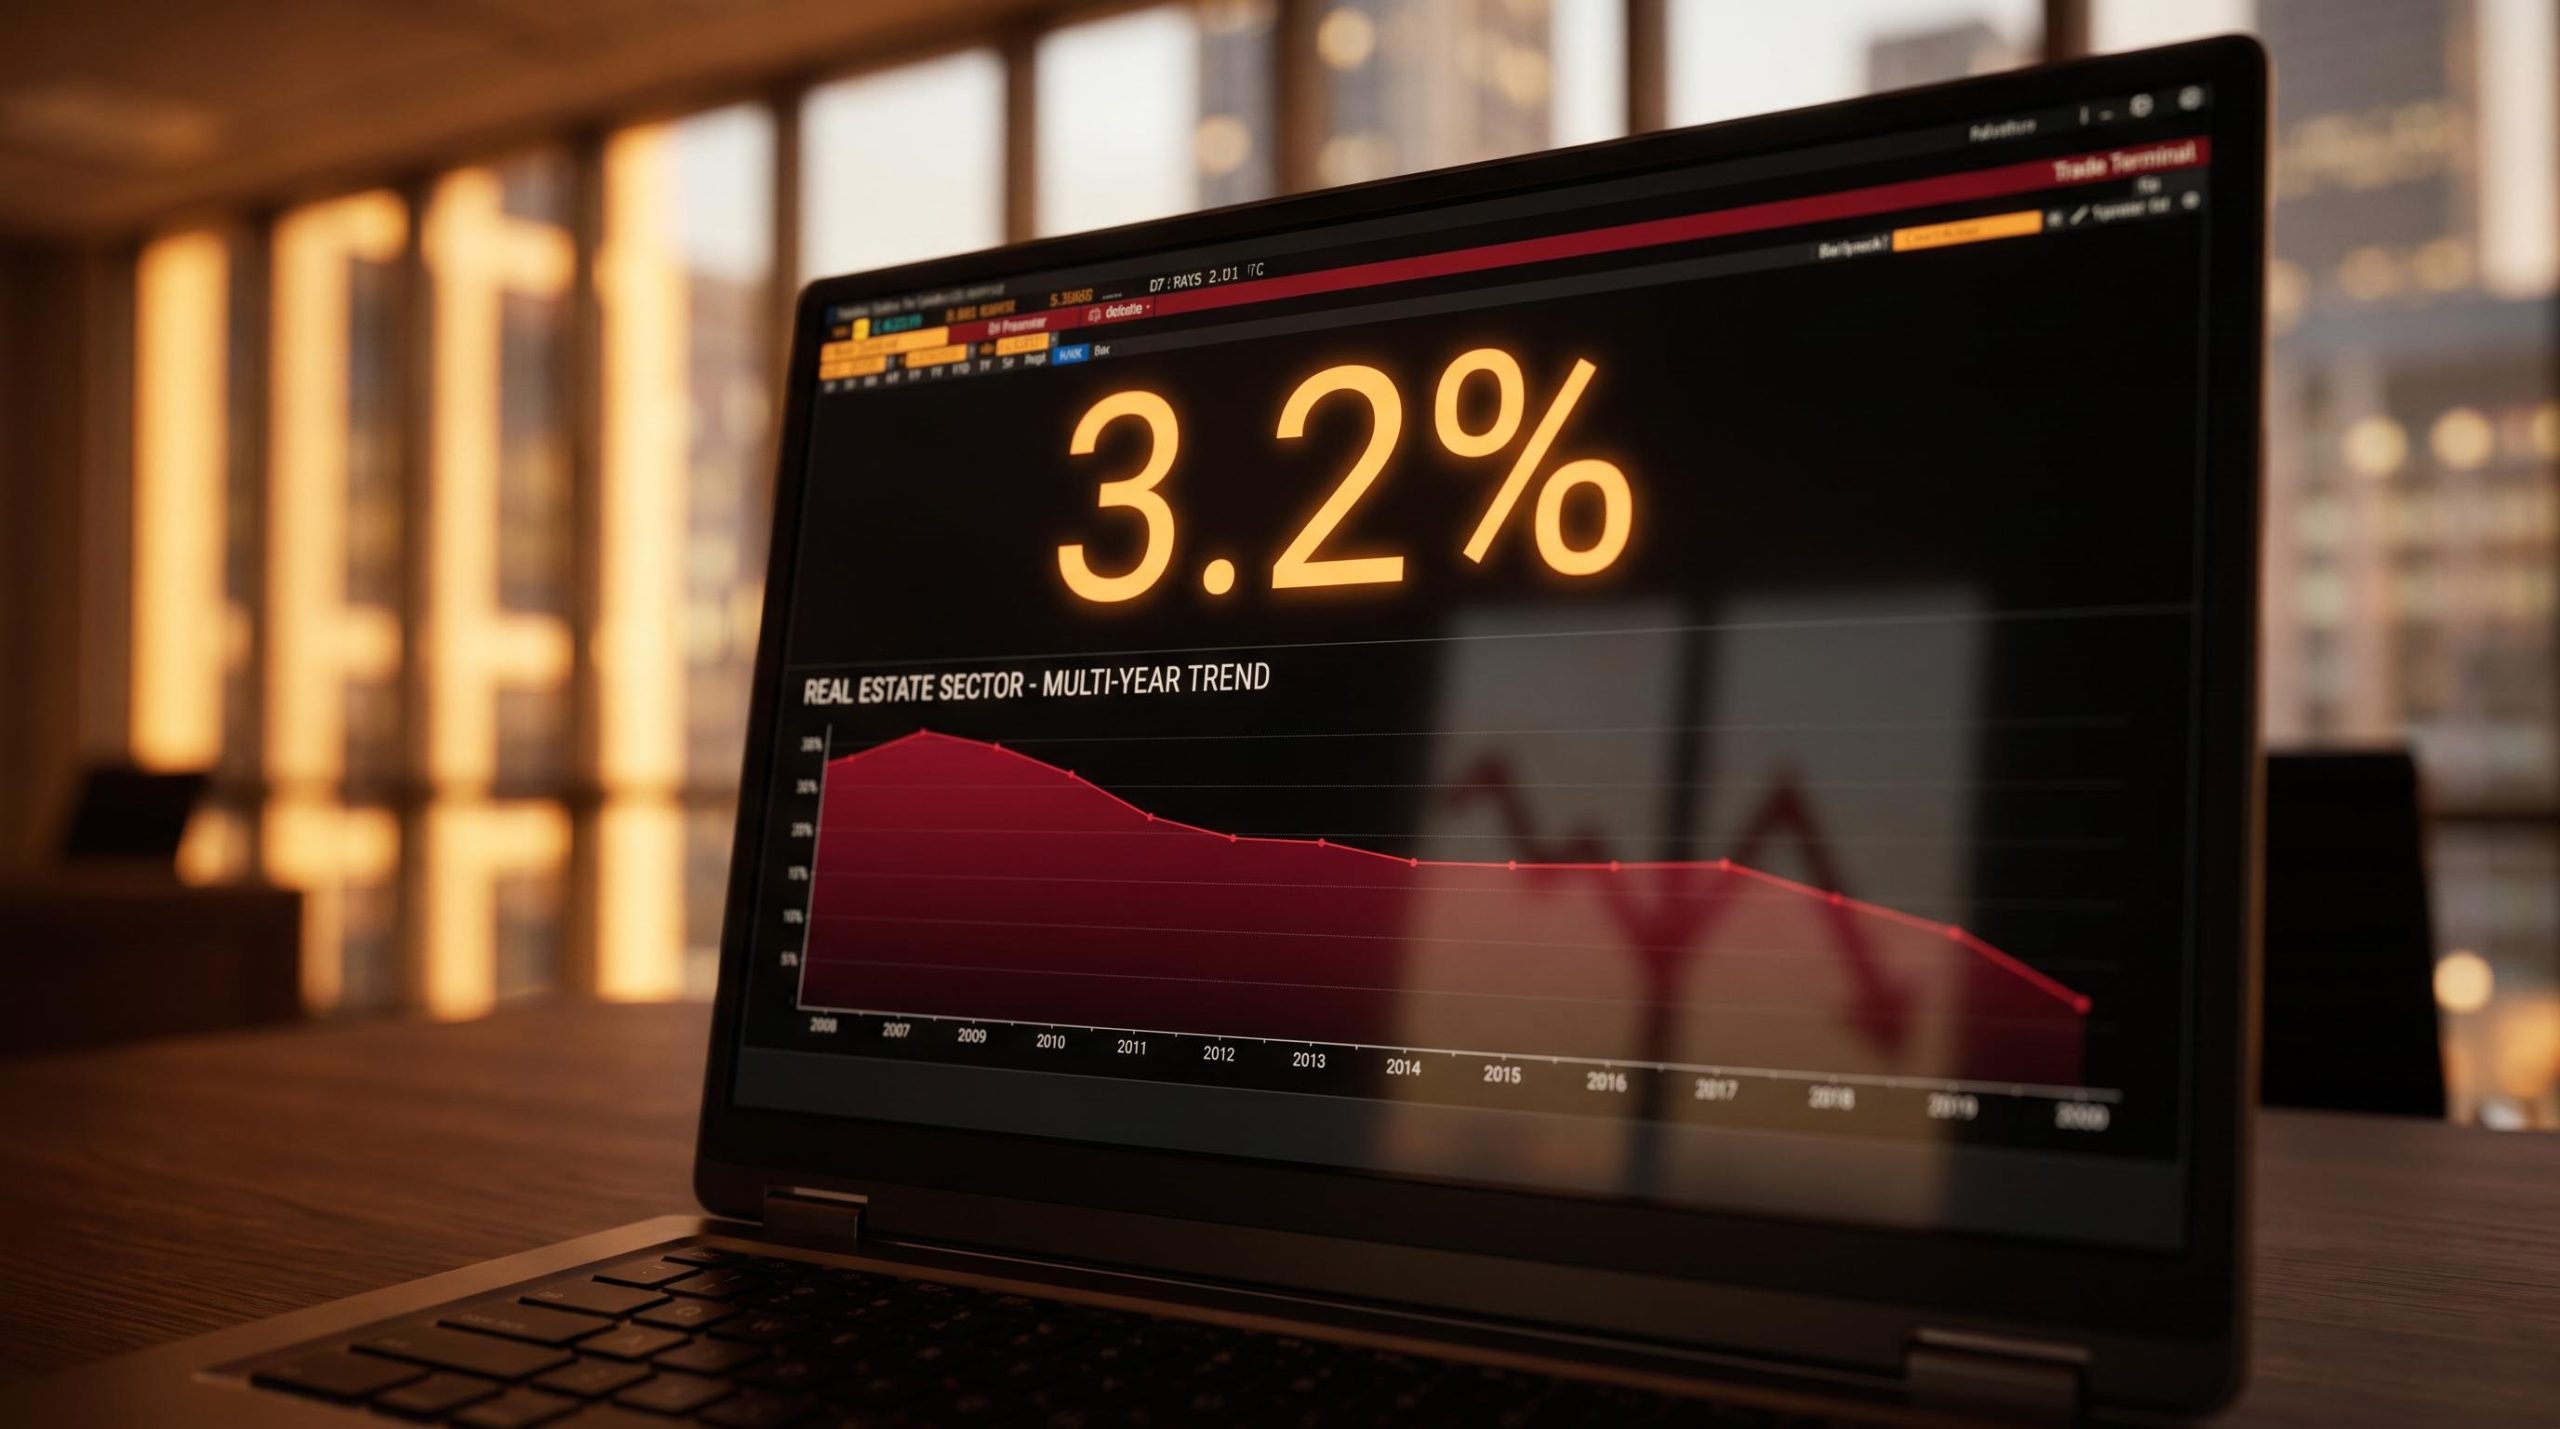
FREL’s trailing yield of approximately 3.2-3.3% is real. The distributions are real. But the yield number you see on a screener can be telling you that price has underperformed more than it is telling you the fund is generous. That distinction is worth checking before building a portfolio around it.
When big ASX news breaks, our subscribers know first
The legal reason REIT funds are wired to pay out more than almost anything else
Real estate investment trusts (REITs), which are companies that own and operate income-producing property, must distribute at least 90% of their taxable income to shareholders as dividends under U.S. law. This is not generosity. It is a legal requirement to maintain their tax-advantaged status.
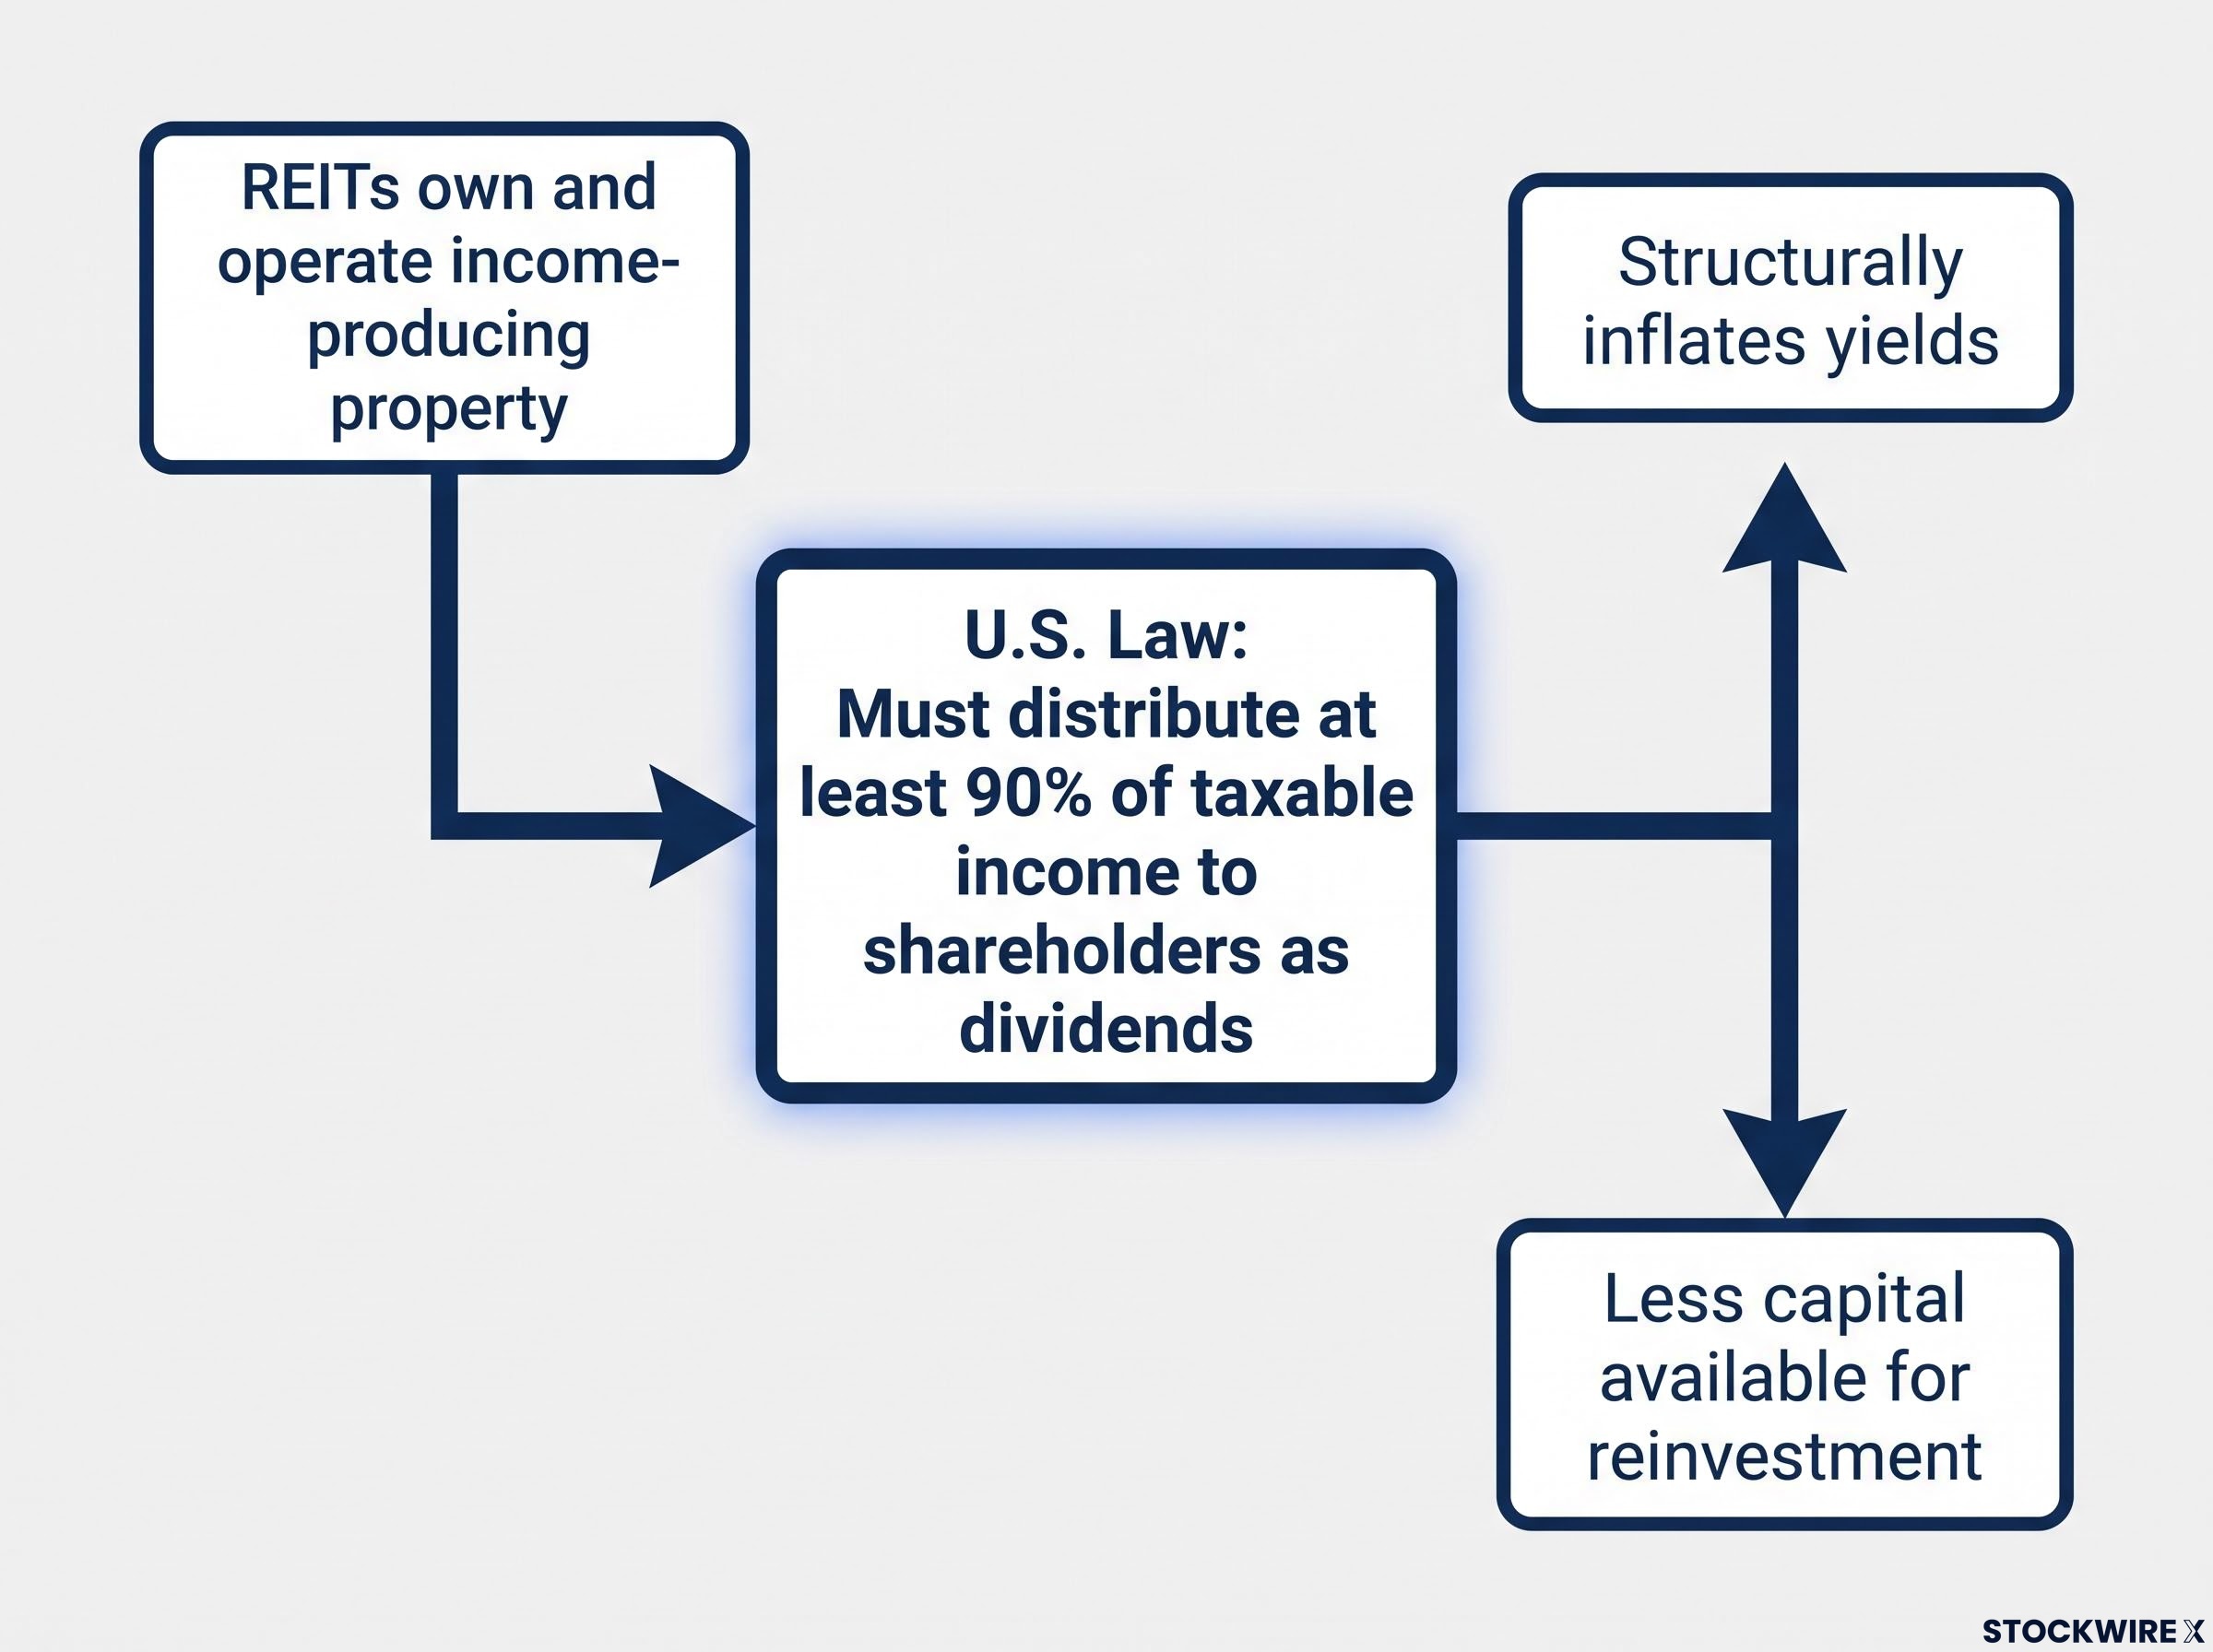
That mandate structurally inflates REIT yields relative to almost every other fund category. It also means far less capital is available for reinvestment, acquisitions, or new development. Technology companies plough earnings back into growth. REITs are legally required to pay most of theirs out. Over time, this tends to cap price appreciation compared with sectors that reinvest aggressively.
FREL is a sensible fund for what it is. It delivers exactly what the REIT sector structurally offers: steady income plus modest long-term growth. But its structural income characteristics make it especially prone to yield-chasing misinterpretation, because the elevated yield is a category artefact as much as a financial achievement.
| Metric | FREL |
|---|---|
| Expense ratio | 0.084% |
| Trailing yield | ~3.2-3.3% |
| Trailing 12-month distributions | ~$0.96-$0.97/share (quarterly) |
| 10-year annualised total return | ~5.6% |
| Worst calendar year | -26.14% (2022) |
Any comparison you make between a REIT fund’s yield and the yield from a sector with no such distribution obligation needs to account for this structural reality. The 90% payout is a legal artefact, not a differentiator to chase.
What 2022 showed about the limits of dividend stability
2022 offered a direct test of the “safe income” narrative. As the Federal Reserve raised interest rates aggressively, FREL declined approximately 25-26% for the calendar year, its worst annual performance at -26.14%.
Dividends kept arriving. The quarterly distributions continued. And the portfolio’s value fell by more than a quarter.
Rising rates compressed REIT valuations through two simultaneous mechanisms: higher discount rates applied to future cash flows, which reduced the present value of expected rental income, and increased borrowing costs for property owners, which squeezed margins. For investors who had concentrated in REITs primarily for their yield, the income-safety narrative collided with significant mark-to-market losses.
Dividend stability does not equal capital stability. That sentence is worth reading twice if current income is a primary reason you hold any position.
The 2022 drawdown traced directly through the REIT valuation channels that connect rate movements to property asset prices: higher discount rates compress the present value of future rental income, while rising debt costs squeeze margins simultaneously, creating a compounding pressure that dividend continuity cannot offset.
What three strategies and 30 years of compounding actually show
The compounding data transforms this from an abstract principle into a dollar figure you can evaluate against your own goals. Three strategies, each starting from $100,000, each using a fund’s historical average annualised return held constant. All return and expense ratio data verified against Fidelity’s official fund fact sheets.
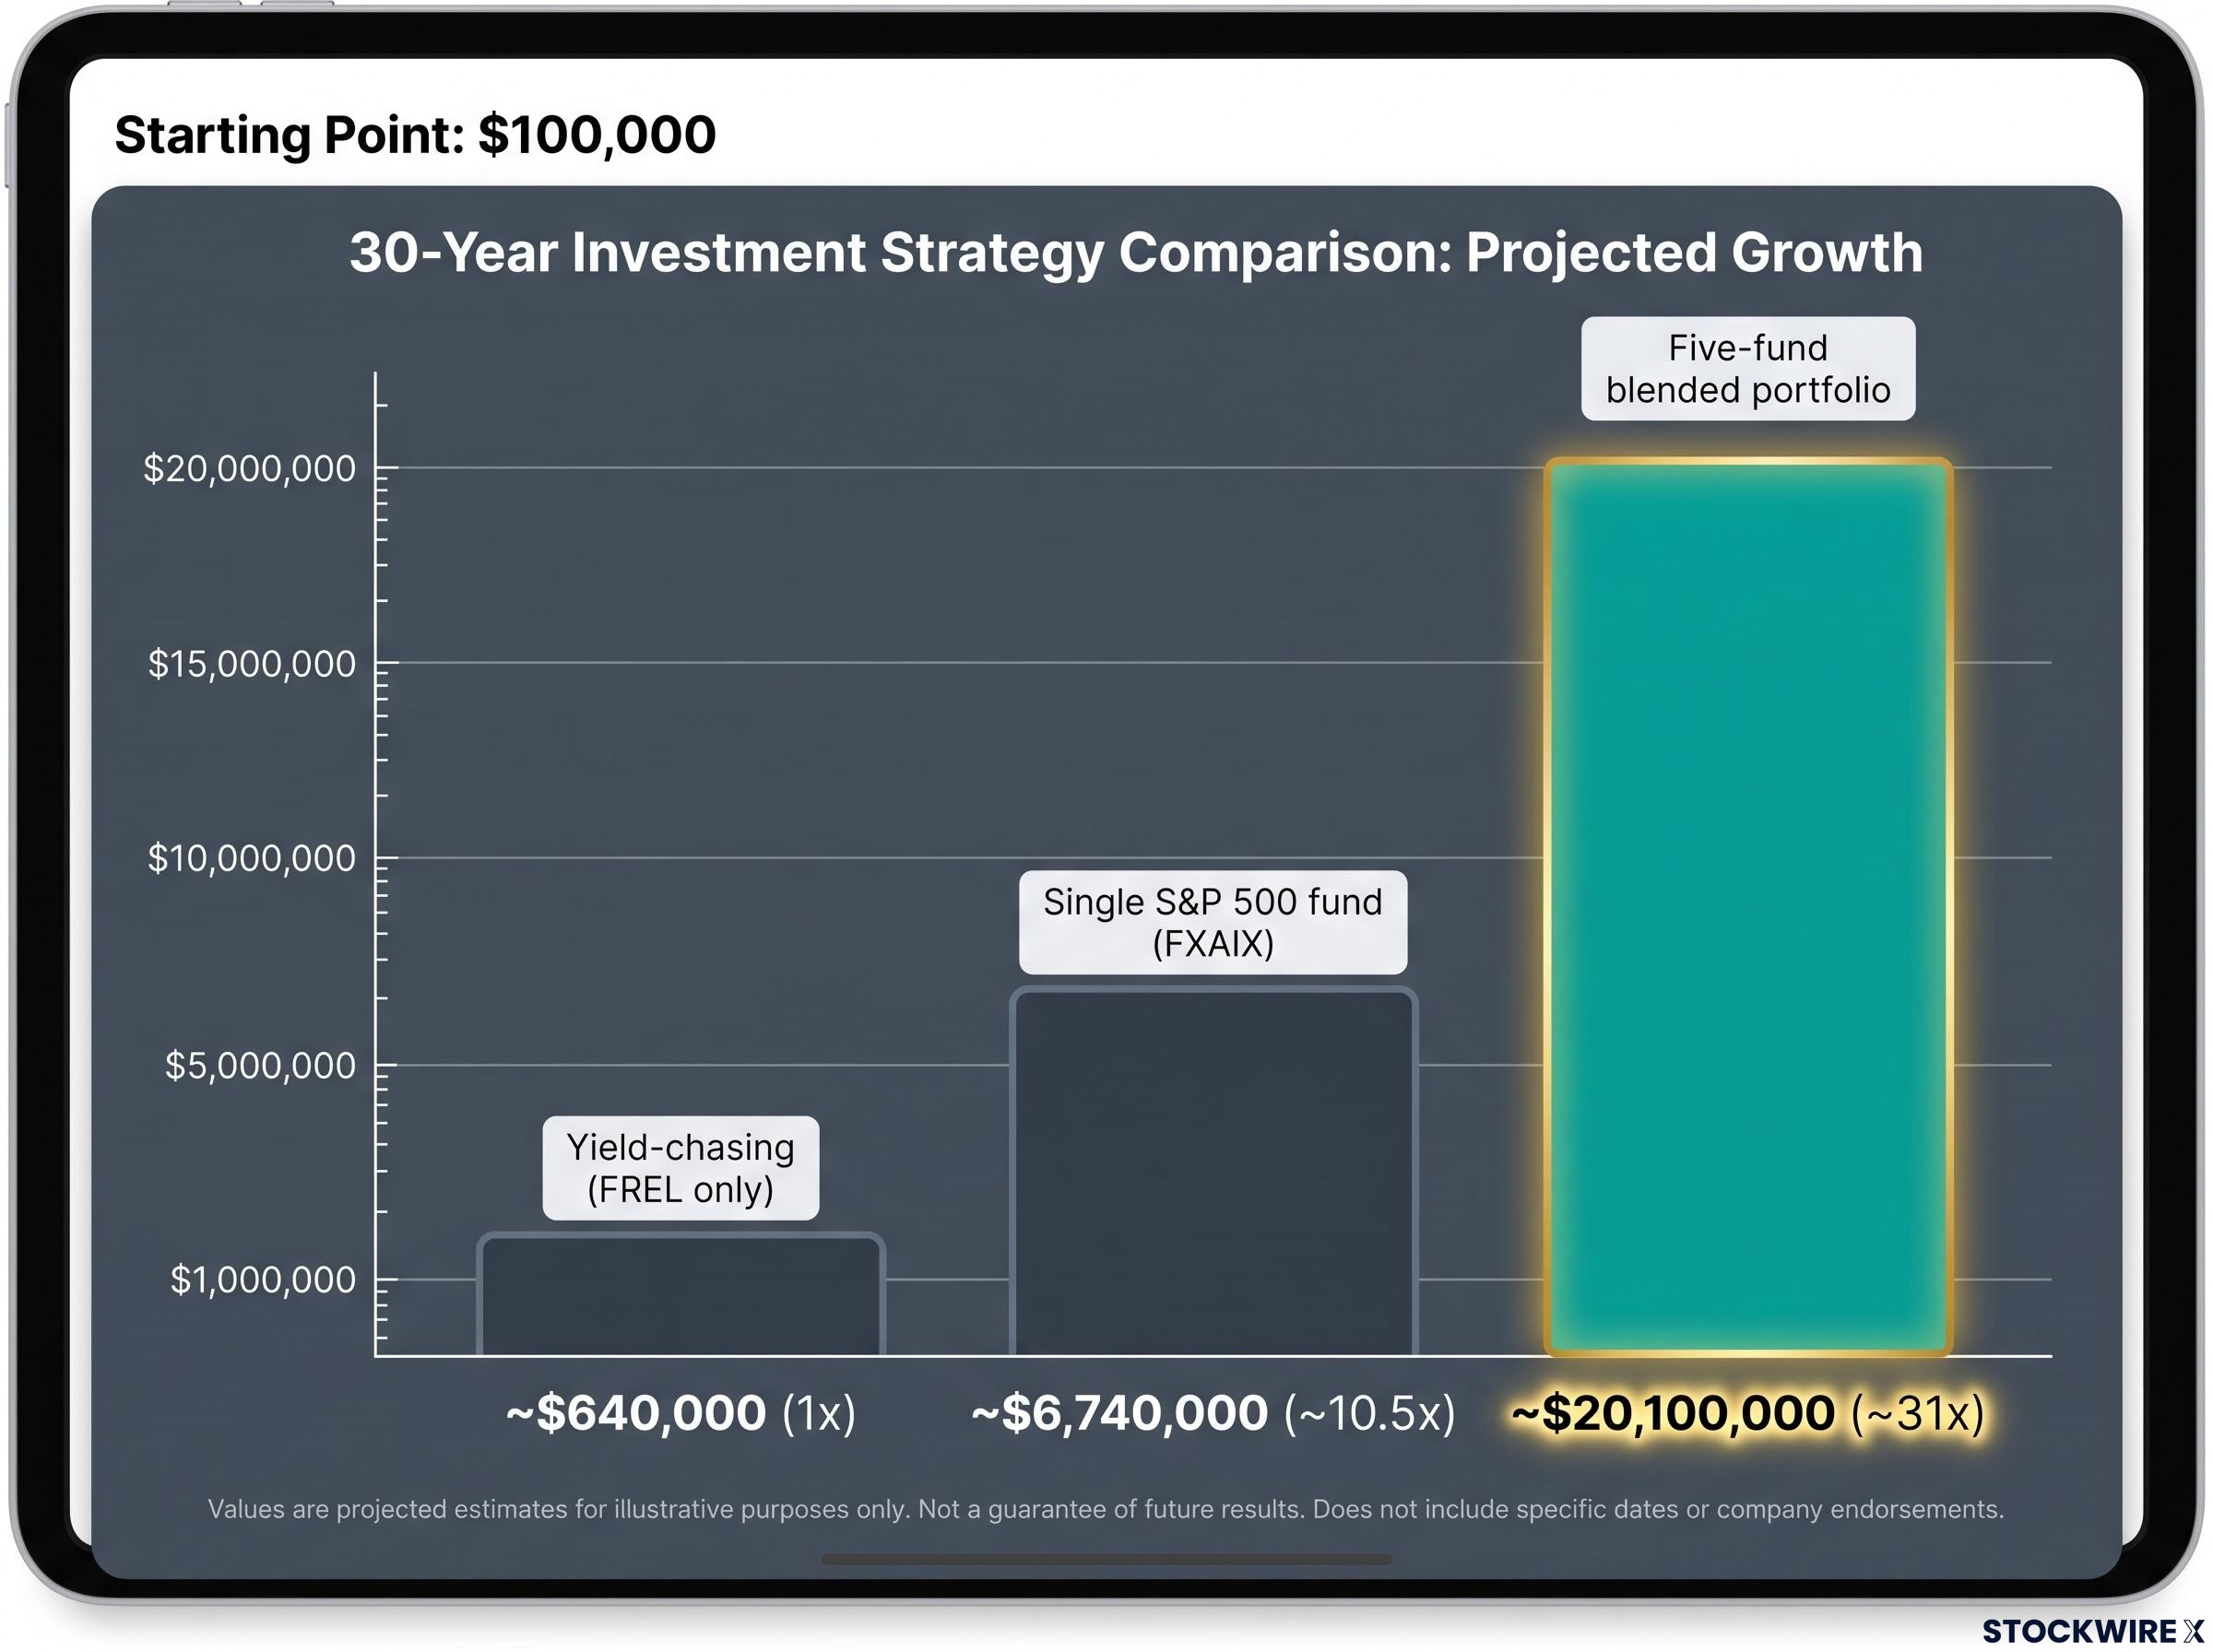
| Strategy | Year 10 | Year 20 | Year 30 | 30-Year Multiplier vs. Yield-Chasing |
|---|---|---|---|---|
| Yield-chasing (FREL only) | ~$182,000 | ~$332,000 | ~$640,000 | 1x |
| Single S&P 500 fund (FXAIX) | ~$470,000 | ~$1,666,000 | ~$6,740,000 | ~10.5x |
| Five-fund blended portfolio | ~$420,000 | ~$2,550,000 | ~$20,100,000 | ~31x |
At year 1, the yield-chasing approach feels financially rewarding. Visible quarterly distributions arrive in your account. The blend actually trails the single-fund approach at that point (approximately $113,560 versus $115,100) because returns are averaged across five positions. The yield-focused investor sees cash. The blended investor sees nothing particularly exciting.
Then time does its work. The blend overtakes the single-fund approach before year 10. By year 20, the gap is approximately $900,000. By year 30, the five-fund blended portfolio produces an outcome more than 30 times larger than the yield-chasing approach.
The five-fund blended portfolio produces an outcome more than 30 times larger than the yield-chasing approach at the 30-year mark: approximately $20.1 million versus approximately $640,000.
By the 30-year mark, the yield-chasing portfolio generates dividend income of around $21,000 annually, equivalent to approximately $1,760 each month, with no shares sold to fund it. That looks like a success until you place it next to the withdrawal capacity of a $20 million blended portfolio. Even at a conservative 4% spending rate, that portfolio supports $800,000 in annual withdrawals. The contrast is what matters before you decide how much capital to direct toward current income.
The short-term cost of diversification the data does not hide
In calendar year 2022, the blended five-fund portfolio posted a loss of roughly 22%, while the single FXAIX fund fell closer to 18% over the same period. The diversified portfolio experienced a steeper drawdown that year.
This is a real cost. Diversification does not eliminate the capacity for sharper short-term losses, and in hostile macro environments, it can amplify them. The blend’s 30-year advantage does not immunise it from painful individual years.
The honest framing is this: the blend’s steeper 2022 drawdown is an argument for emotional preparation, not an argument against diversification. If you understand that a blended portfolio can lose more in any single year than a simpler one, you are less likely to abandon the strategy at the worst possible moment.
Using dividend income as a deliberate tool instead of a default strategy
Dividend-heavy funds and REIT exposure are not bad investments. They serve specific and legitimate functions within a broader framework:
- They provide regular cash flow that can support spending needs or rebalancing
- They diversify away from pure growth or technology concentration
- They offer psychological stability during volatile markets, because something tangible is always being paid out
FREL is a perfectly sensible component in a diversified portfolio seeking real estate exposure and moderate income. Neither the yield-chasing approach nor the single-fund approach is unreasonable on its own terms. Both pursue legitimate goals. Neither, however, is structured to maximise 30-year terminal value.
For investors who do intend to hold REIT funds as a deliberate income allocation, payout ratio analysis provides a more reliable sustainability signal than yield alone, with ratios above 90% for non-REIT corporations often flagging distributions that outpace free cash flow.
A better construction framework organises around three principles:
- Long-term wealth accumulation is driven by high-expected-return assets, even if they pay little or no current income
- Current income needs are met with deliberate, sized allocations to dividend-paying funds, bonds, and REITs, accepting lower total return in exchange for cash flow as a conscious trade-off
- Income vehicles are appropriately sized as tools within that framework, not treated as the default home for capital simply because their yields look attractive on a screener
The investor most drawn to visible income because of financial anxiety is often the one who can least afford the lower terminal wealth a yield-first strategy produces. A yield-chasing investor who finishes with a portfolio under $1 million and modest annual dividends had the same starting capital as a blend investor who could plausibly end with several million and six-figure annual withdrawal capacity. For a reader who genuinely needs current income, a deliberate allocation to FREL or similar funds is a sound and honest trade-off. The problem is when that allocation happens by accident because a number looked good on a screener rather than because it was sized consciously against a long-term plan.
What the compounding gap means for decisions you are making now
Yield is a ratio that can mislead by design. REIT structures amplify that misleading quality through legal mandate. And the 30-year math translates it into a specific dollar cost measured in millions, not thousands.
FREL is not the problem. The strategy built around a single metric is. The reader who understands this is now equipped to make a deliberate, sized decision: how much capital should serve current income needs, and how much should compound toward long-term accumulation. That decision should be arrived at through planning, not through screener behaviour.
For readers wanting to move from the compounding framework described here to a concrete implementation plan, our dedicated guide to long-term wealth accumulation covers how equity compounding mechanics, ETF selection, and tax-efficient account structures work together across 10-20 year horizons.
This article is for informational purposes only and should not be considered financial advice. Investors should conduct their own research and consult with financial professionals before making investment decisions. Past performance does not guarantee future results. Financial projections are subject to market conditions and various risk factors.