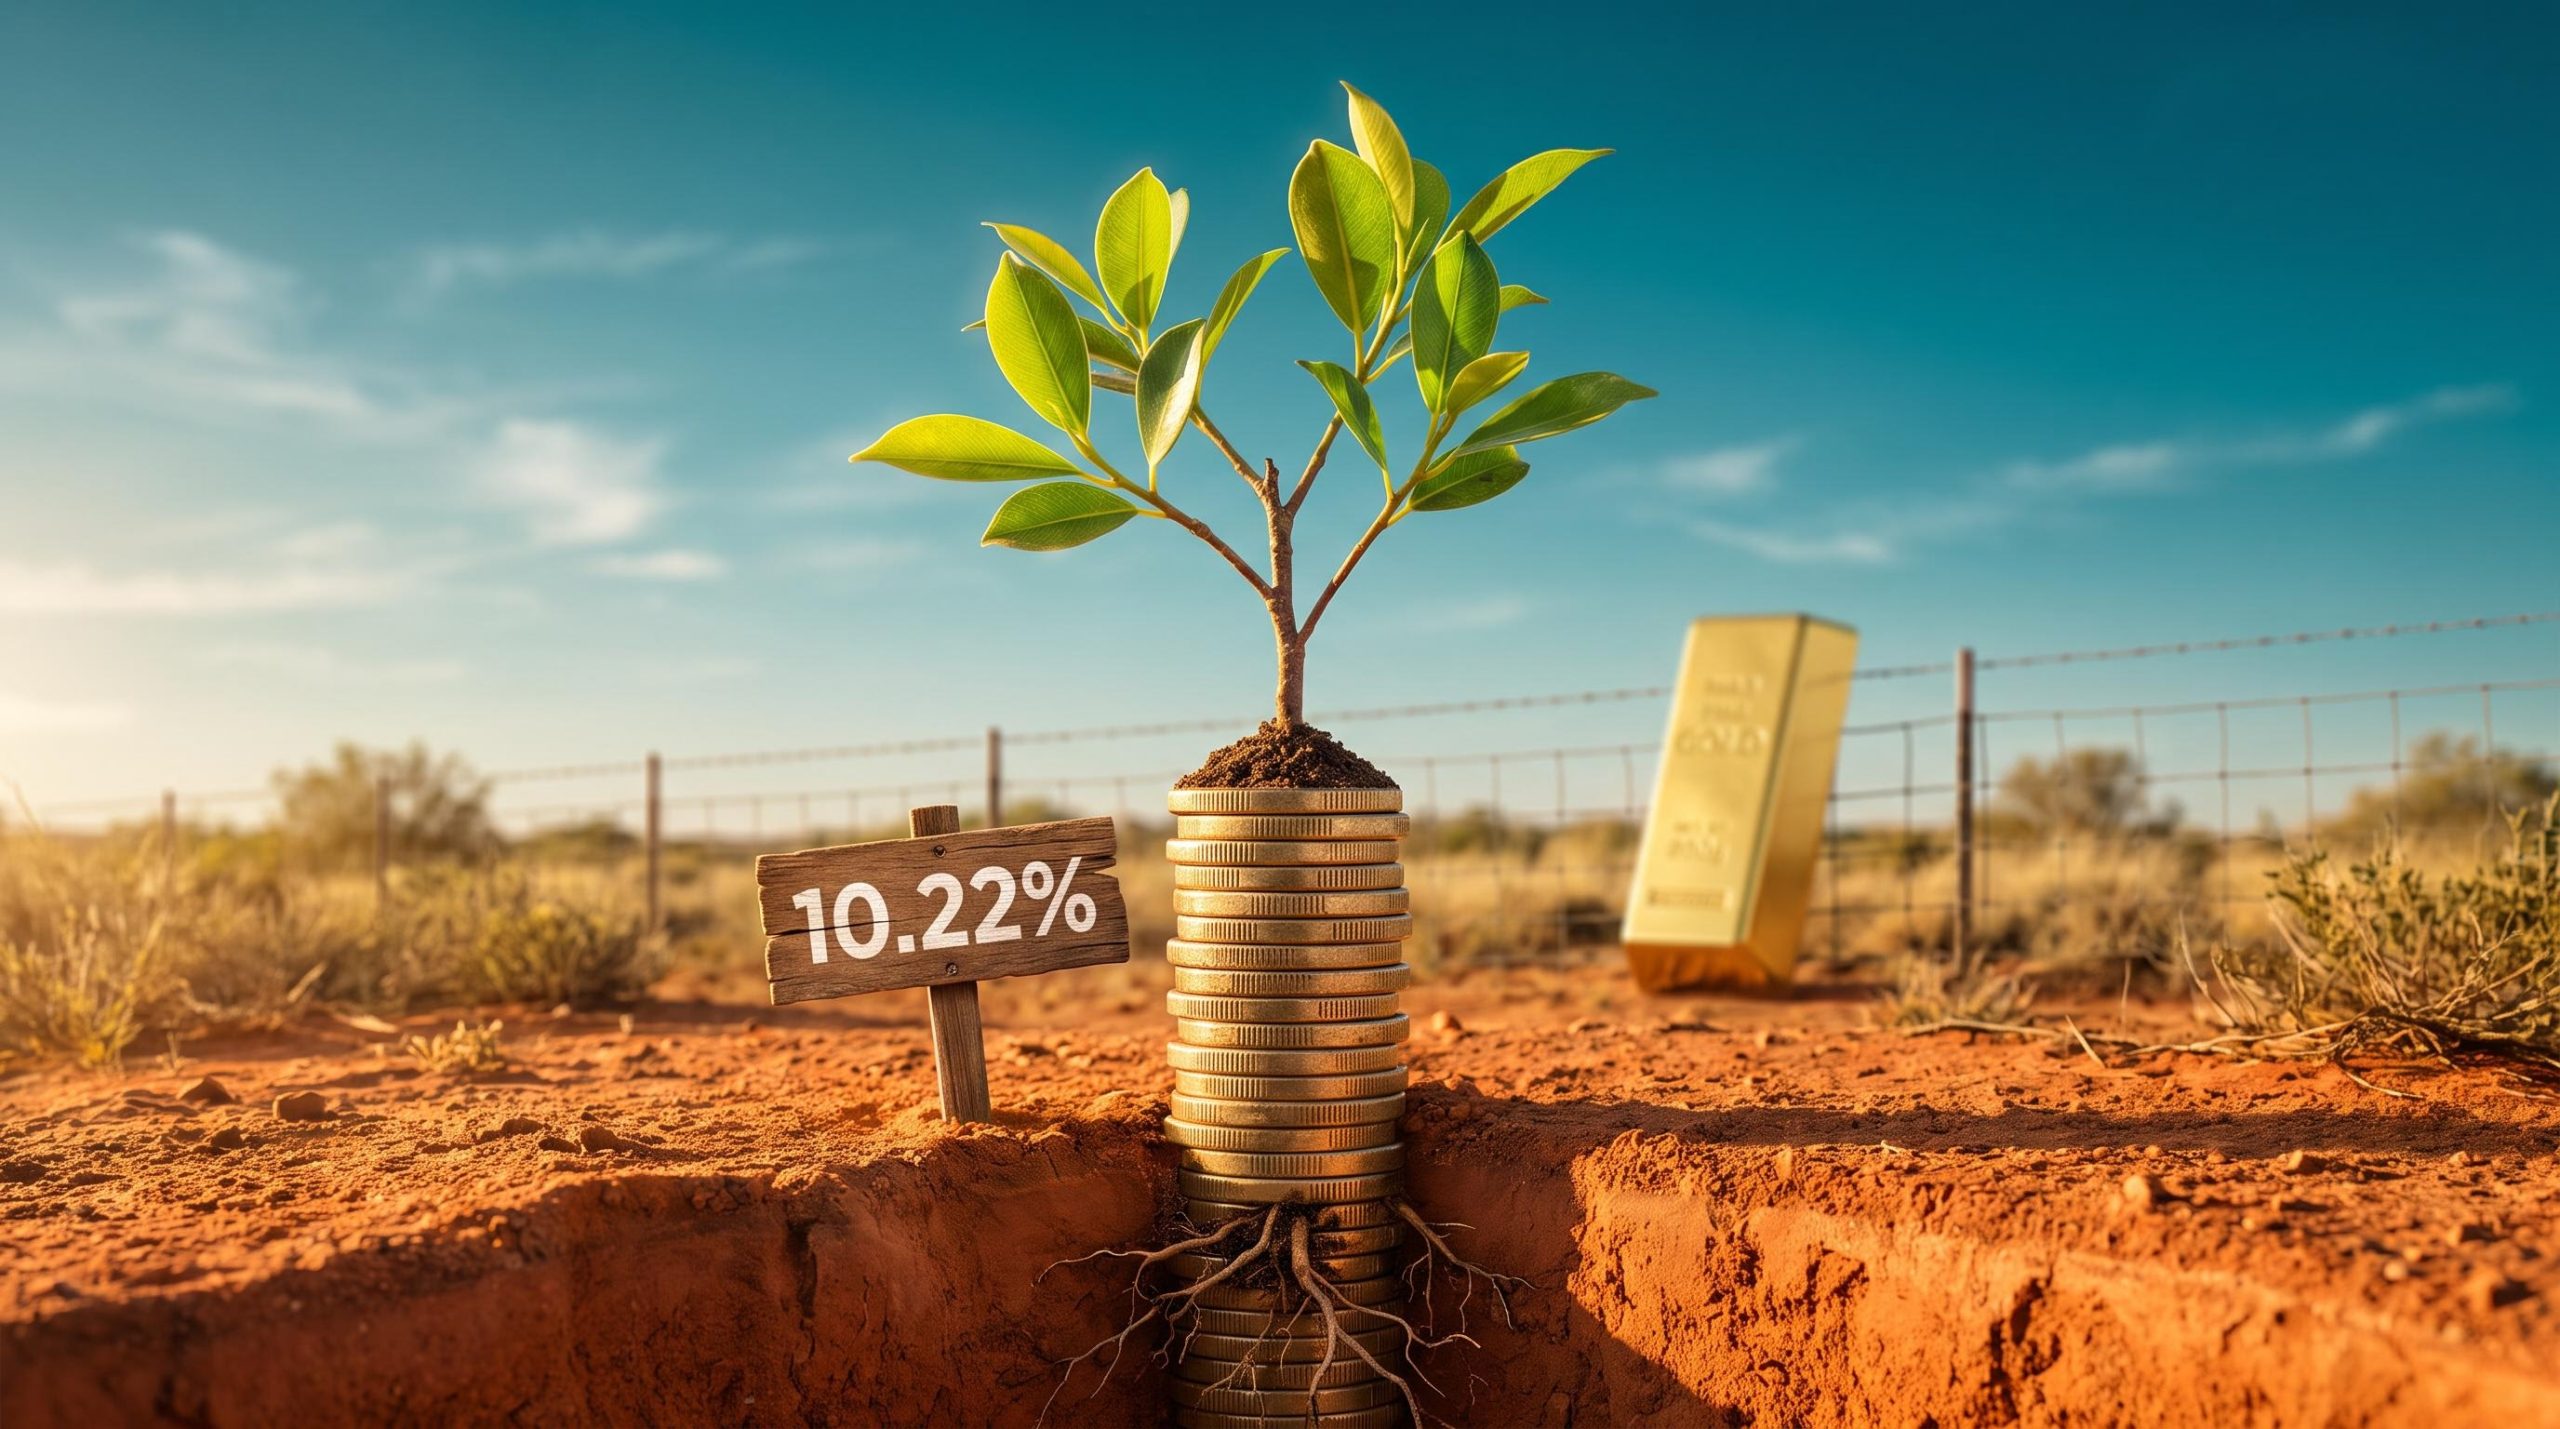
The highest-yielding share on the ASX is not automatically your best income share. Across more than five decades of S&P 500 data, companies that grew or started paying dividends returned 10.22% a year. Companies that cut or scrapped them returned -0.96% a year. That gap is the case for dividend growth stocks: what a company does with its dividend has mattered more than how large the dividend is.
The evidence was refreshed on 14 October 2026, when Hartford Funds and Ned Davis Research released the latest edition of their long-running study. Morningstar Australia has also tested a rough ASX version of the same idea.
The timing matters for local investors. The S&P/ASX 200 yielded about 3.2% in June 2026, against a 10-year average of 4.1%. Chasing headline yield is getting harder, so the direction of a payout deserves more of your attention.
Here is what the research actually proves, where it falls short, and a practical checklist for spotting companies likely to keep lifting their payouts.
What does the evidence say about dividend growers in the US and Australia?
The US record
The Hartford and Ned Davis study, “The Power of Dividends: Past, Present, and Future”, sorts S&P 500 companies by what they did with their dividend from 1973 to 2025. Growers and initiators raised or started a payout. “No change” companies held their dividend per share steady. Cutters and eliminators reduced or removed theirs.
The categories overlap, so one company can sit in more than one bucket. Even so, the pecking order is stark.
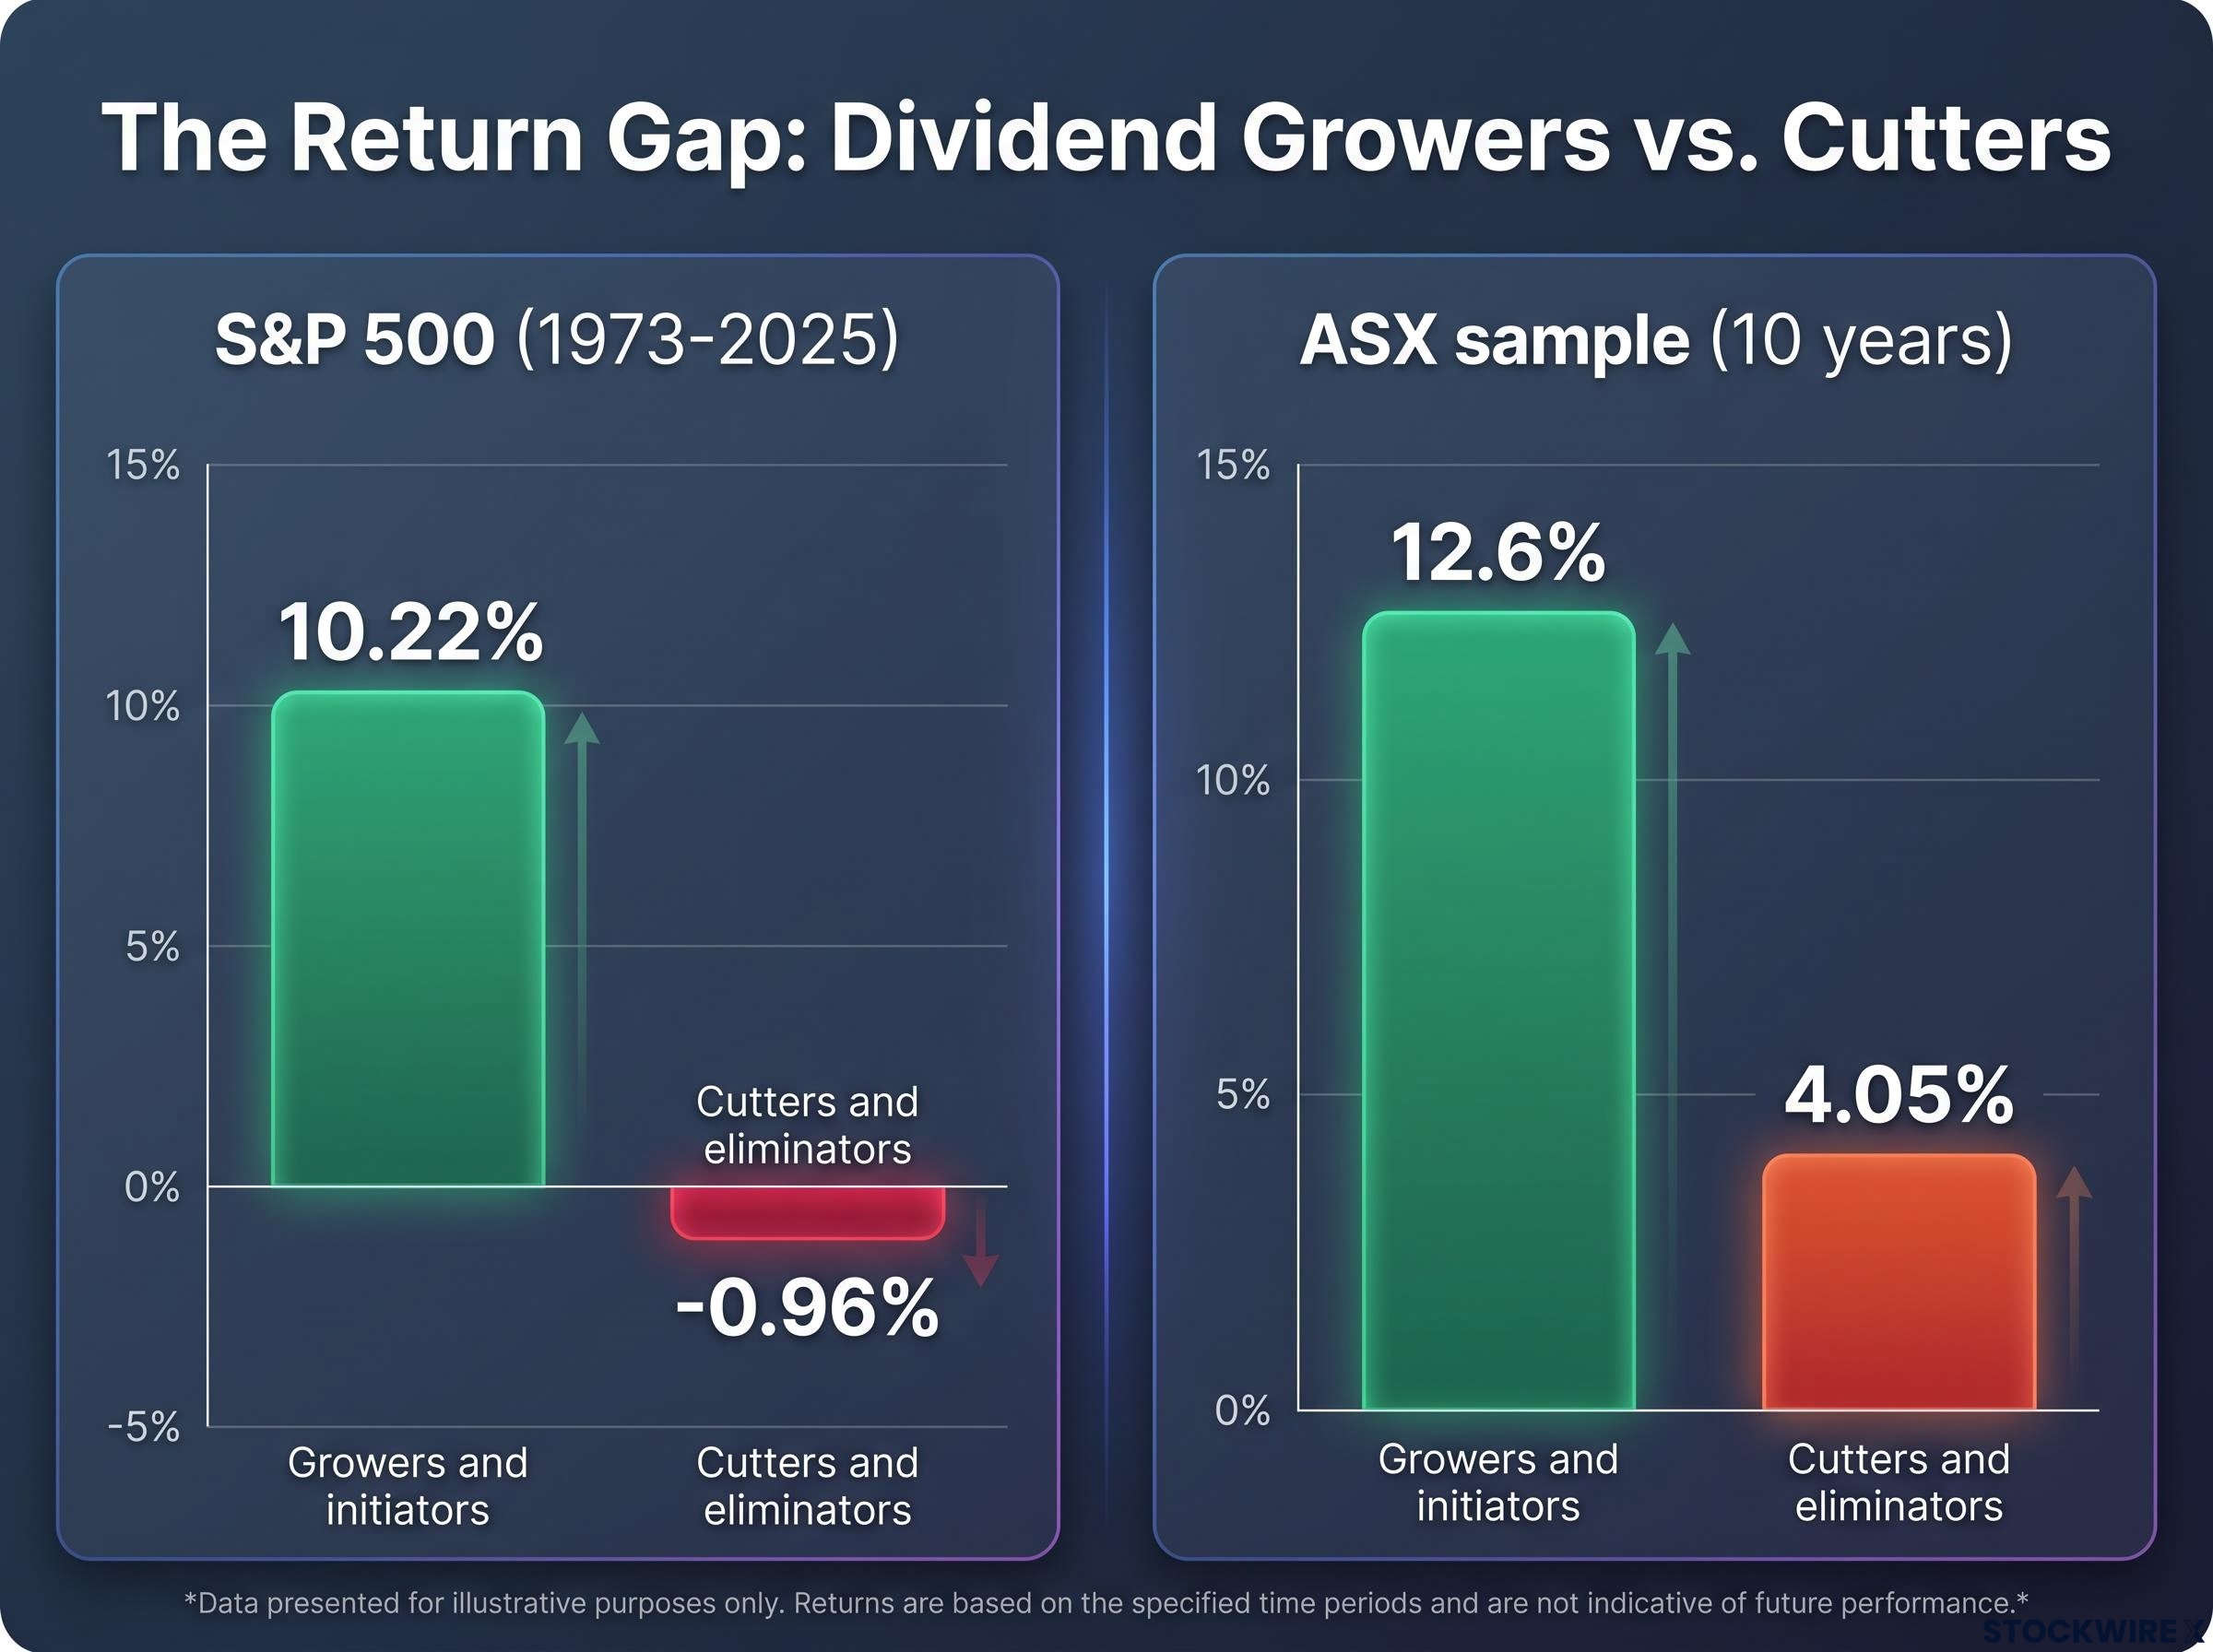
The gap that matters Growers and initiators: 10.22% a year. Cutters and eliminators: -0.96% a year (S&P 500, 1973-2025).
Dividends also did a lot of the heavy lifting overall, contributing an average 33% of S&P 500 total return between 1940 and 2025. Hartford reports that growers and initiators have historically shown lower volatility too. That is an association. It does not prove that raising the dividend caused the better result.
The ASX replication
Mark LaMonica at Morningstar Australia built an approximate local version. He used the 179 ASX shares in Morningstar’s coverage over the past 10 years, included franking credits in returns and dropped the “no change” group because only four companies qualified.
| Category | S&P 500 (1973-2025) | ASX sample (10 years) |
|---|---|---|
| Growers and initiators | 10.22% | 12.6% |
| Payers | 9.20% | 7.61% |
| No change | 6.87% | n/a (dropped) |
| Non-payers | 4.21% | 9.8% |
| Cutters and eliminators | -0.96% | 4.05% |
| Equal-weighted index | 7.74% | 8.70% |
Growers came out on top again. The rest of the picture is messier: ASX cutters still made money, and non-payers beat payers. The two datasets point the same way for growers, but they are not directly comparable.
Morningstar also reported on 8 April 2026 that its 20-company “dividend champions” portfolio returned 17.93% a year over 10 years, against 9.81% for the ASX 200. That is one portfolio’s result, not a rule. The lens to carry forward is that a dividend’s direction has historically told you more than its size.
Your starting point is the dividend yield, which divides annual dividends per share by the current share price, so a falling share price can lift the figure without the company paying a cent more.
When big ASX news breaks, our subscribers know first
Why might companies that raise dividends outperform?
What a dividend raise signals
Start with a simple question: what does a company need in order to keep raising its dividend? It needs more cash each year, and that cash has to come from somewhere real. As LaMonica puts it, long-term dividend growth requires long-term earnings growth.
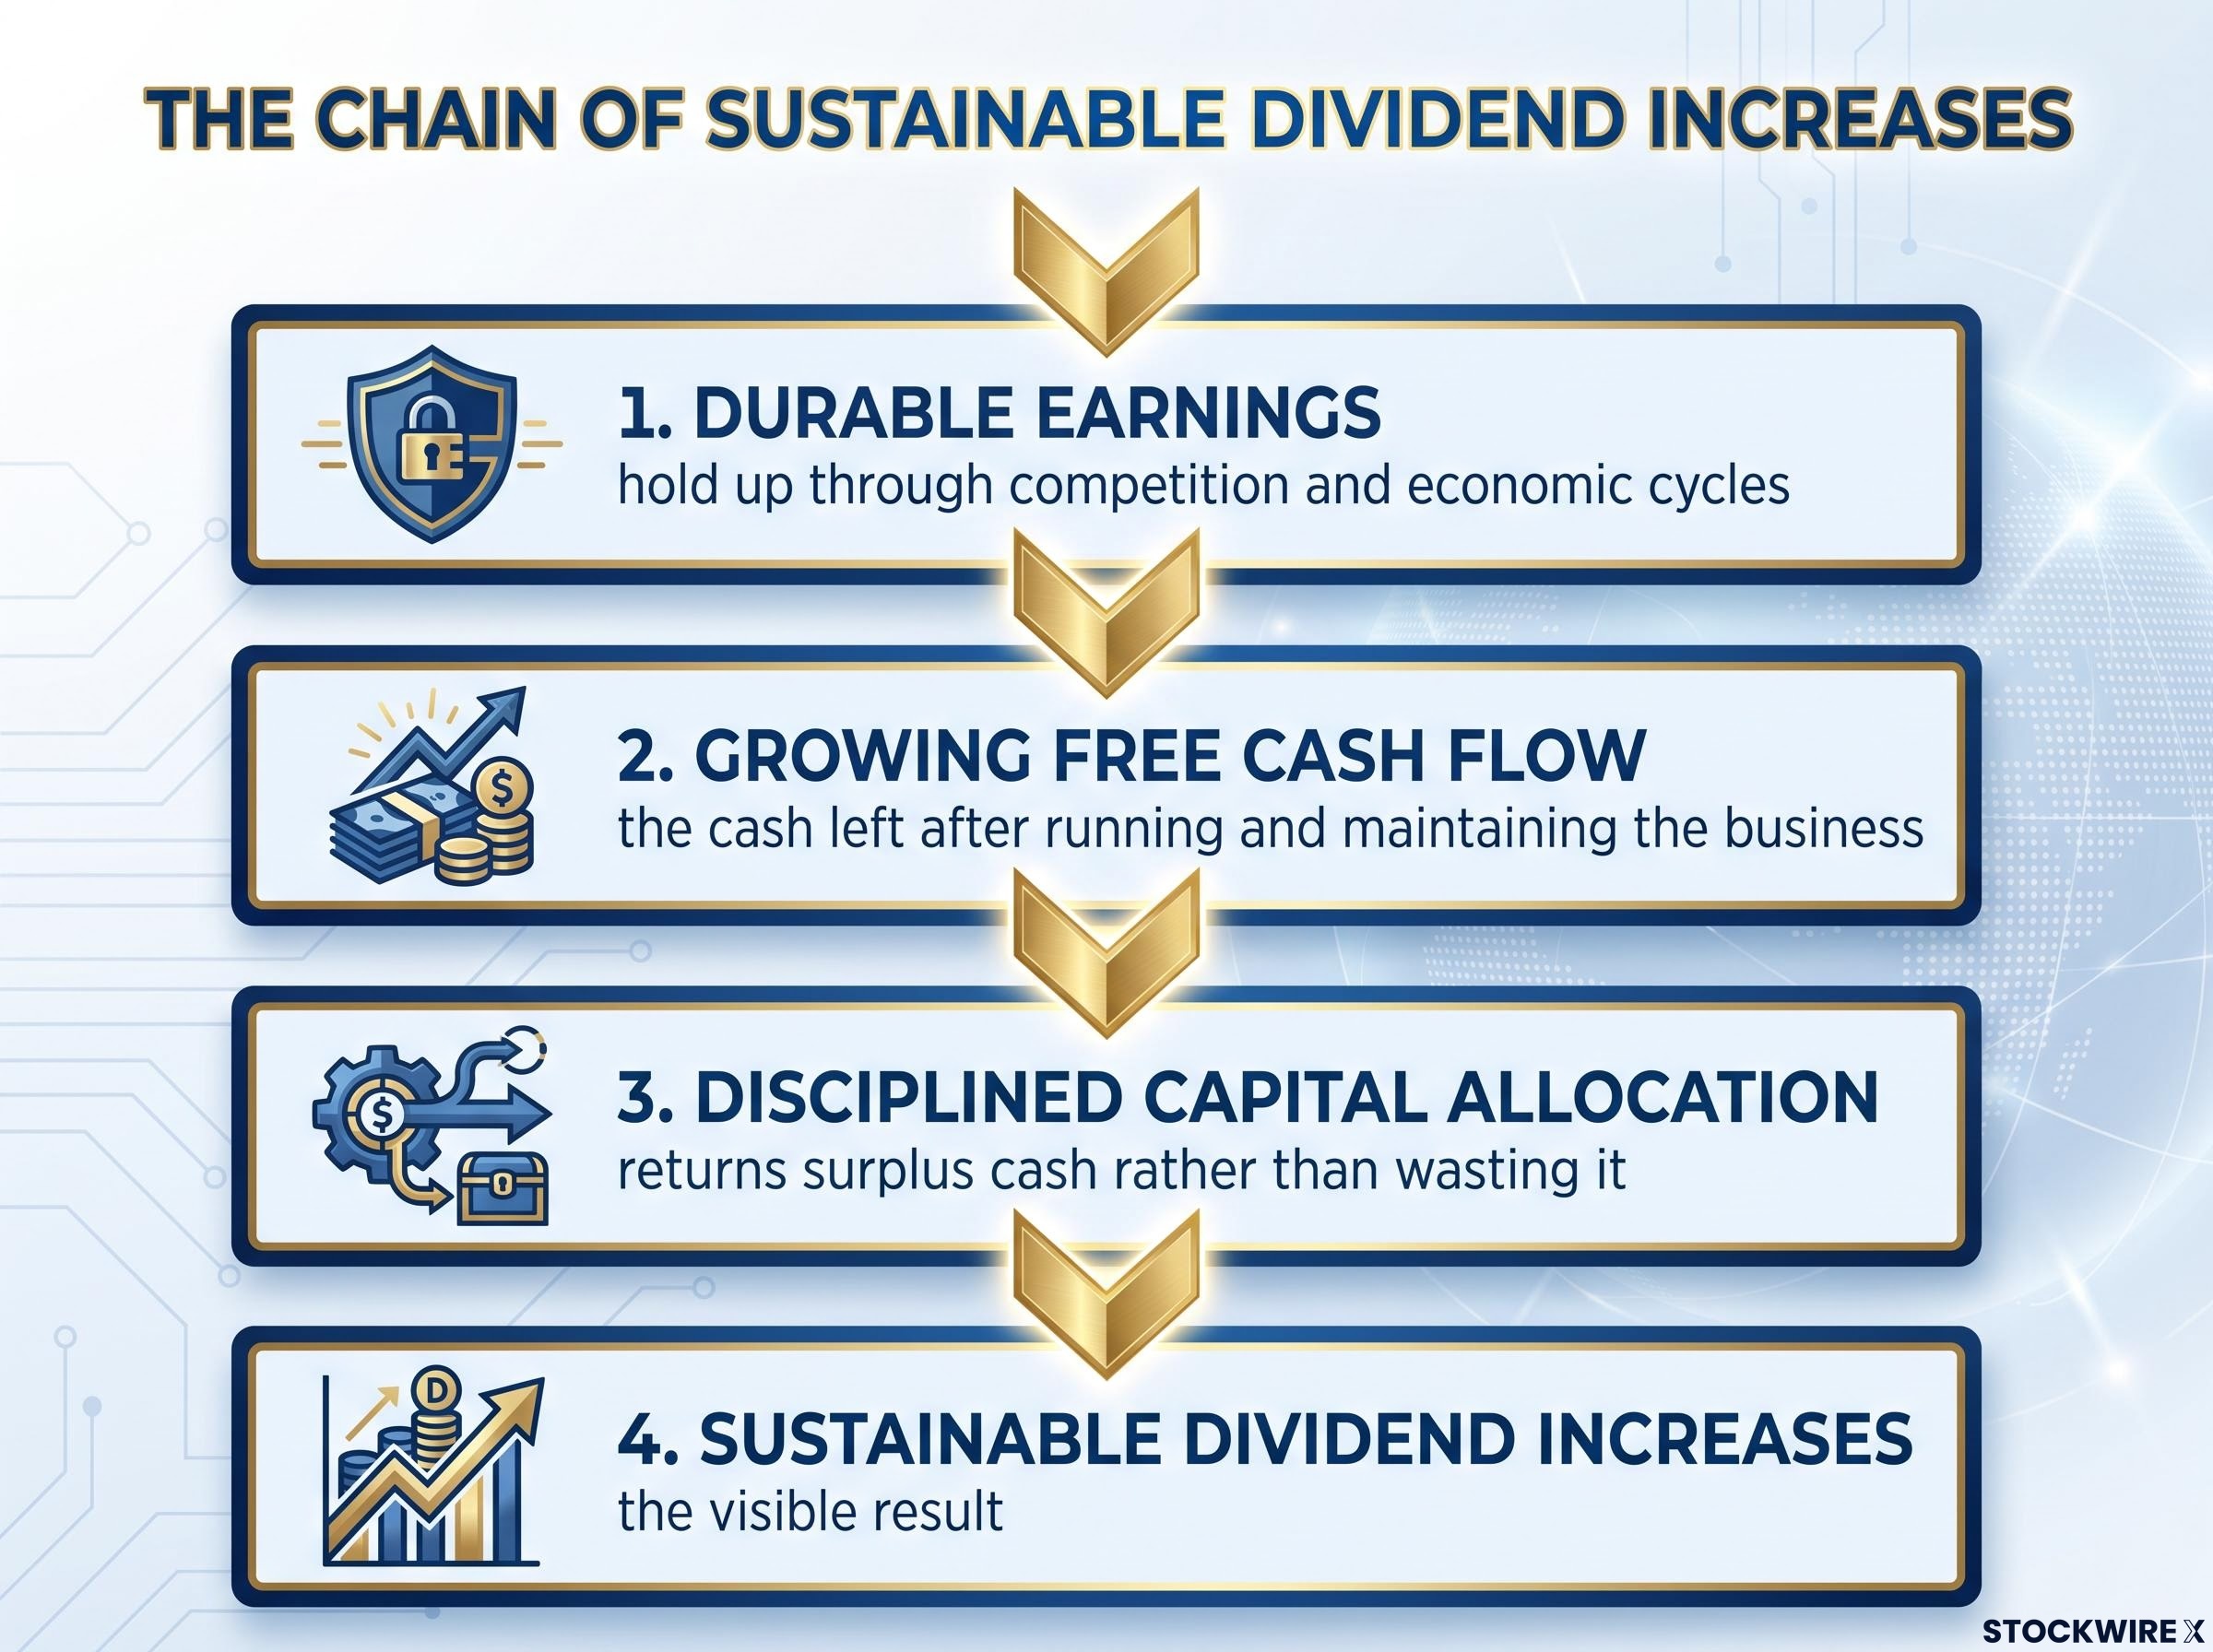
The chain usually runs like this:
- Durable earnings that hold up through competition and economic cycles.
- Growing free cash flow, the cash left after running and maintaining the business.
- Disciplined capital allocation, meaning management returns surplus cash rather than wasting it on poor acquisitions or overinvestment.
- Sustainable dividend increases as the visible result.
A moat often protects the first link. A moat is a lasting competitive advantage, such as a strong brand or high switching costs, that stops rivals eroding a company’s profits. It preserves pricing power and cash flow, which leaves more money for reinvestment and dividends. In Morningstar’s dividend champions analysis, 70% of the 20 selected companies had a narrow or wide moat.
S&P Dow Jones Indices treats dividend growth as a quality signal of profitability, financial strength and capital discipline. Some of its dividend-grower indices deliberately exclude the highest yielders, because a very high yield can reflect a falling share price and weakening fundamentals.
So when you see a rising dividend, you are really looking for evidence of a strong business underneath. The dividend is only the visible tip.
Where the signal can mislead
Raises tend to signal management confidence in future cash flows, while cuts tend to signal stress. The signal is useful, but it is imperfect.
Managers can delay a cut they know is coming, or borrow to keep a payout steady. In both cases the dividend looks healthy while the business behind it weakens.
Keep the caution in view The link between dividend growth and returns is an association, not proven causation. The raise is usually a symptom of quality, not the cause of returns.
What are the limits of the evidence, and where do Australian investors get caught?
Why the data has limits
Headline results feel reassuring, but there are good reasons to hold them loosely. The first is survivorship bias: the tendency for studies to look better than reality because failed or delisted companies drop out of the sample. Morningstar flagged this for its comparisons, and noted that strong performers may have joined its coverage during the decade.
The ASX sample is also small. It covered 179 shares, and one category had only four members. On top of that, the categories describe policy rather than permanent identity, so a company can be a payer, then a grower, then a cutter.
A pattern across an index is no guarantee for any single share you own.
Traps to avoid in practice
Morningstar’s dividend-trap analysis, updated 8 October 2026, names three warning signs:
- Very high payout ratios, meaning the company pays out most of its profit and keeps little for reinvestment or a bad year.
- High indebtedness, which competes with shareholders for cash.
- A gap between accounting profit and cash flow, where reported earnings are not backed by real cash.
A high trailing yield can simply mean the share price has fallen. LaMonica adds a local wrinkle: payout ratios are less useful as a screen in Australia because they are typically high across the market.
ASX payout ratios average 70-75% of earnings, well above developed-market norms, which narrows the buffer when profits disappoint and makes dividend trap warning signs easier to miss.
Cyclical miners show how fast things move. In October 2024, Morningstar projected falling dividends at BHP, Rio Tinto and Fortescue. Then BHP and Rio raised their payouts in 2026, according to an ASX Investor Update on 25 September 2026.
| Company | Recent move | Lesson |
|---|---|---|
| Fortescue | Dividend cut 23% | A high past yield can mislead in a volatile commodity cycle |
| BHP | Payout raised 51% | Projected falls reversed; always check the date on a forecast |
| Rio Tinto | Payout raised 30% | Mining dividends can swing sharply in both directions |
| Sandfire Resources | Dividend reinstated | Cyclical payouts can stop and restart |
Franking can also lull you into complacency. It improves after-tax value for eligible holders, but it does not make an unsafe dividend safe.
Concentration is the final trap. Australian dividends lean heavily on banks, miners and insurers, so a yield-led portfolio can quietly become a sector bet. Morningstar also notes that dividend payers tend to lag in speculative, momentum-driven markets. Context matters as well: the ASX 200 returned 7.0% in FY2026, with 4.23% coming from dividends and 2.77% from capital growth.
How do you pick dividend growth stocks on the ASX?
The five-step screen
Drawing on guidance from Morningstar’s Mark LaMonica and Shani Jayamanne, here is an order you can apply to any share on your watchlist this week:
- Moat. Check what keeps or wins customers in the industry. Red flag: no clear advantage over rivals.
- Predictability. Check how much of the result sits within management’s control. Red flag: cyclical earnings that produce a high yield just before profits fall.
- Yield versus the company’s own history. Compare today’s yield with the company’s past yield as a rough valuation guide. Red flag: an unusually high yield you cannot explain. For context, the market itself yields 3.2% against a 4.1% 10-year average.
- Debt and interest cover. Interest cover measures how many times profit covers interest costs. Red flag: rising interest bills, which reduce the cash available for dividends.
- Return on invested capital (ROIC). ROIC measures the profit a company earns on the money invested in its operations. Red flag: a generous dividend funded by weak returns, which may point to a mature or declining business.
Each test maps to a risk covered earlier, from cyclical miners to debt-funded payouts.
Do not rank by yield alone A share’s position at the top of a yield table tells you little about whether its payout will grow.
The best candidate is often a business with a modest yield today and strong, durable returns on capital. Keep in mind that Australian payout ratios are materially higher than US ones, and local investors accept more variable dividends. Treat this screen as a framework for research rather than a guarantee, and adapt it to your own circumstances.
Franking and the after-tax view
Under ATO rules, you generally include both the cash dividend and the attached franking credit in your assessable income, then receive a tax offset equal to the credit. To claim it, you generally need to hold the shares for at least 45 days, subject to the small-shareholder exemption and other conditions.
Treat franking as an after-tax adjustment, not a sign of quality. Keep cash yield and grossed-up yield separate when comparing shares. Overseas investors, and anyone who cannot use the credits, should not value franking the same way.
What the evidence supports, and what it does not
Growing dividends have historically marked healthier businesses, in the US and, more loosely, on the ASX. The link is still an association, though, and the Australian test is small and imperfect. Your practical edge comes from screening for quality, not from chasing yield.
Use the five tests as a starting filter. Check current figures and their dates before acting, because mining forecasts have already shown how quickly they can age. If you need guidance specific to your situation, consider speaking with a licensed adviser.
As reporting season unfolds, watch payout sustainability and cash-flow coverage closely, especially in cyclical sectors such as mining.
Investors ready to turn the screen into holdings can use our comprehensive walkthrough of building an ASX dividend income portfolio, which explains how dividend reinvestment plans compound income.
This article is for informational purposes only and should not be considered financial advice. Investors should conduct their own research and consult with financial professionals before making investment decisions. Past performance does not guarantee future results. Financial projections are subject to market conditions and various risk factors.