
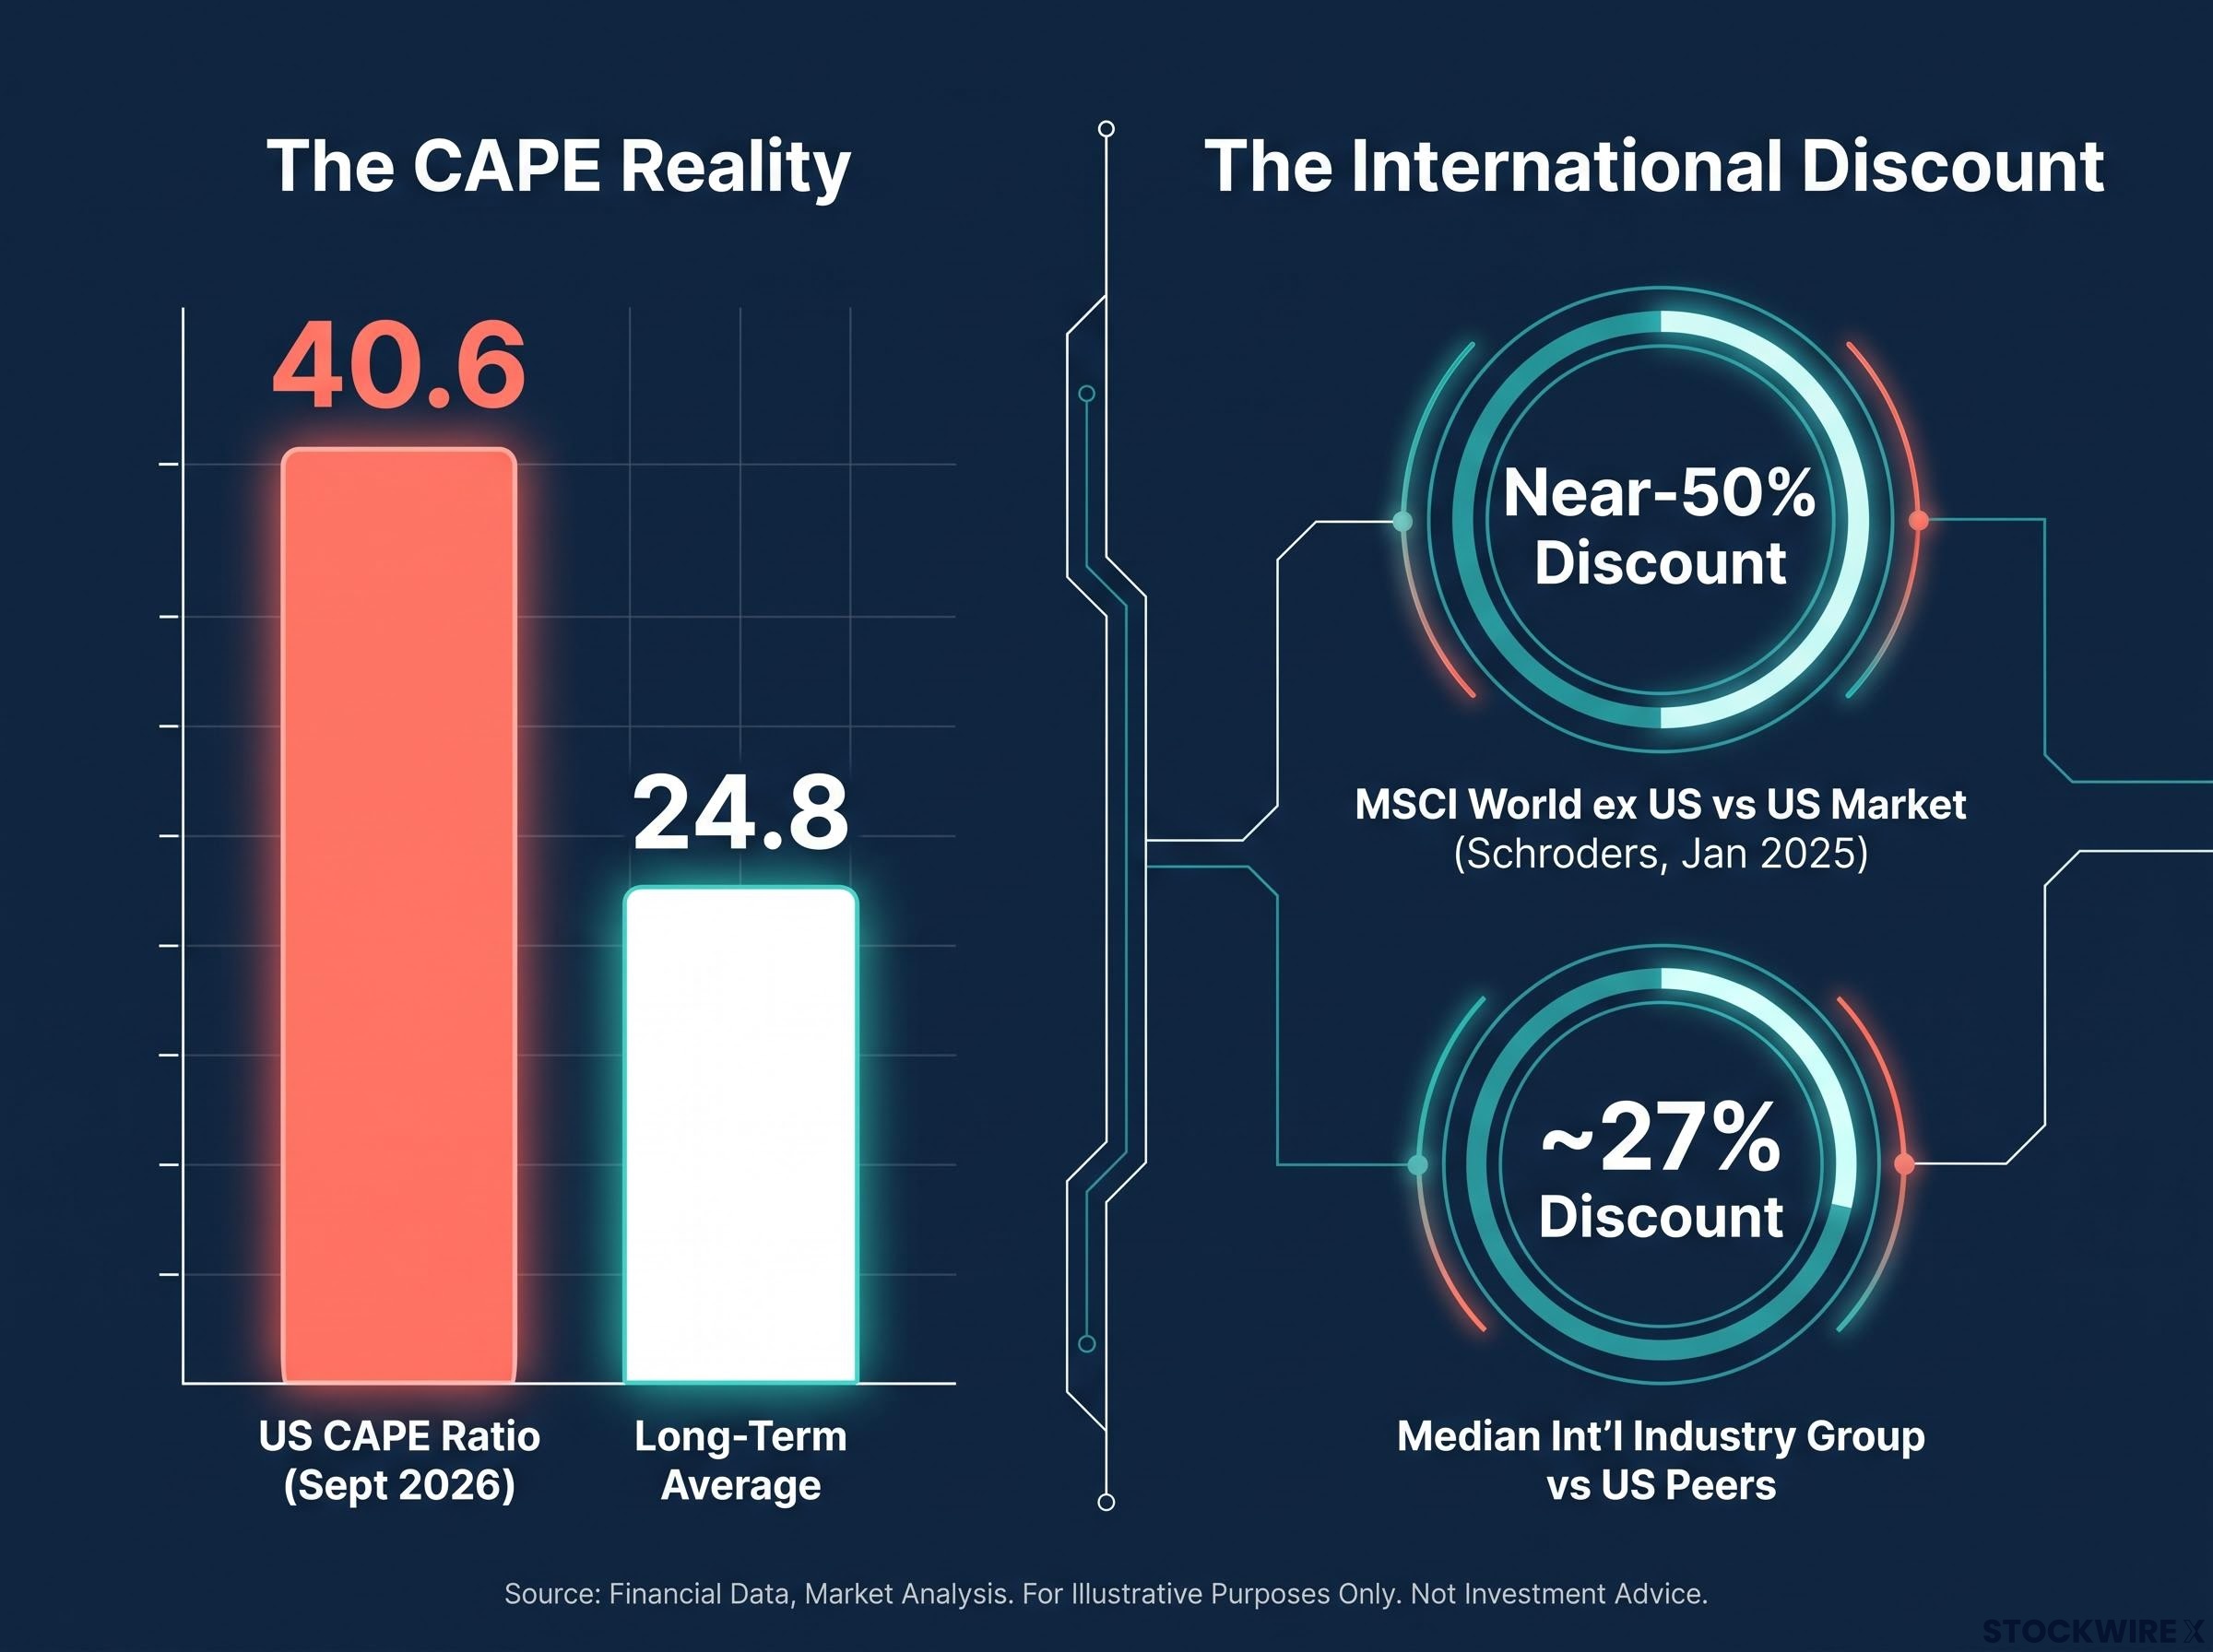
Here is a number worth sitting with before you look at your own portfolio: the MSCI World ex US index currently trades at roughly half the price-to-earnings multiple of the US market. That is not a small gap. It is close to a 50% discount.
If you are holding US equities today, or considering adding to them, that discount is the price you are choosing to pay for staying put. The US market’s cyclically adjusted price-to-earnings (CAPE) ratio sits near 40.6 as of September 2026, well above its long-term average of 24.8, while comparable international markets sit close to fair value against their own history. This is not the usual grumble about US stocks being expensive. It is a quantifiably extreme point in a divergence that has run for two decades, and GMO’s most recent public projections point to negative real returns for US large caps over seven years while international deep value and emerging-market value are projected firmly positive.
If you have a long horizon and a meaningful sum to invest, this gives you a practical framework for deciding whether global value equities belong in your portfolio: where the case is strongest, where the risks are genuine, and what a real position might look like.
The numbers that make the valuation case hard to ignore
Start with the broadest measure and work down, because the case gains weight as you narrow it.
At the index level, the MSCI World ex US trades at a near-50% discount to the US market on a trailing price-to-earnings basis, according to Schroders analysis from January 2025. Price-to-earnings simply compares what you pay for a share against the profit that share generates; a lower multiple means you pay less for each dollar of earnings.
That headline discount could be dismissed as a quirk of sector mix. It is not. Schroders found that across individual industry groups, the median discount for international stocks against their US peers runs at roughly 27% on both forward and trailing measures. When you strip out the composition effect and compare like with like, the gap holds.
Then there is the long-run picture. The Shiller CAPE ratio smooths earnings over a decade to filter out cyclical noise, and on that measure the US premium is more extreme than any major market except India.
The Shiller CAPE ratio data, maintained by Professor Robert Shiller at Yale and updated regularly from 1871 to the present, underpins the long-term average of 24.8 used throughout this analysis and gives you a direct way to track where the US market stands against its own full historical range.
The Shiller CAPE reading The US market’s CAPE ratio stands at approximately 40.6 as of September 2026, against a long-term average of 24.8 (Shiller data via YCharts).
Why has this persisted? Because it is not purely a mispricing story. US technology and quality franchises have genuinely dominated, delivering roughly two decades of superior earnings growth that investors have rewarded with higher multiples. Prometeia’s research adds a sharper point: the CAPE gap between US and euro-area equities has widened since the Global Financial Crisis and cannot be explained by sector composition or interest rates alone.
The concentration dynamic compounds the valuation argument: market leadership rotation away from US Technology tracks a recurring historical pattern in which the dominant cohort of one decade delivers annualised returns roughly 3-5 percentage points below the broad global market over the subsequent decade, according to BlackRock Investment Institute research across the Nifty Fifty, Japan Inc., and TMT bubble episodes.
| Market | Trailing P/E Discount to US | CAPE Context | Schroders Assessment |
|---|---|---|---|
| United States | Benchmark | ~40.6 (vs 24.8 average) | Extended |
| MSCI World ex US | Near 50% | Near fair value vs own history | Historically cheap vs US |
| Median industry group (intl) | ~27% (fwd & trailing) | Varies by market | Cheaper on like-for-like basis |
Here is what the size of this gap really means for you. Buying US large caps at today’s multiples requires an extraordinary continuation of earnings outperformance just to justify the price. Sit with what has to keep going right for that bet to pay off, because valuation is the single most reliable long-run predictor of equity returns.
When big ASX news breaks, our subscribers know first
What institutional return forecasts are actually projecting
Valuation tells you where the market is priced. Forward-looking forecasts tell you what that pricing implies for returns, and two credible institutions are pointing the same way.
GMO’s Q2 2025 seven-year forecasts, based on data as of 30 June 2025, project real returns after inflation under a normal interest rate environment. The contrast is stark. US large equities are projected at negative 5.4% per year, while International Deep Value sits at positive 7.2%, Emerging Value at positive 6.3%, and Japan Small Value at positive 7.7%.
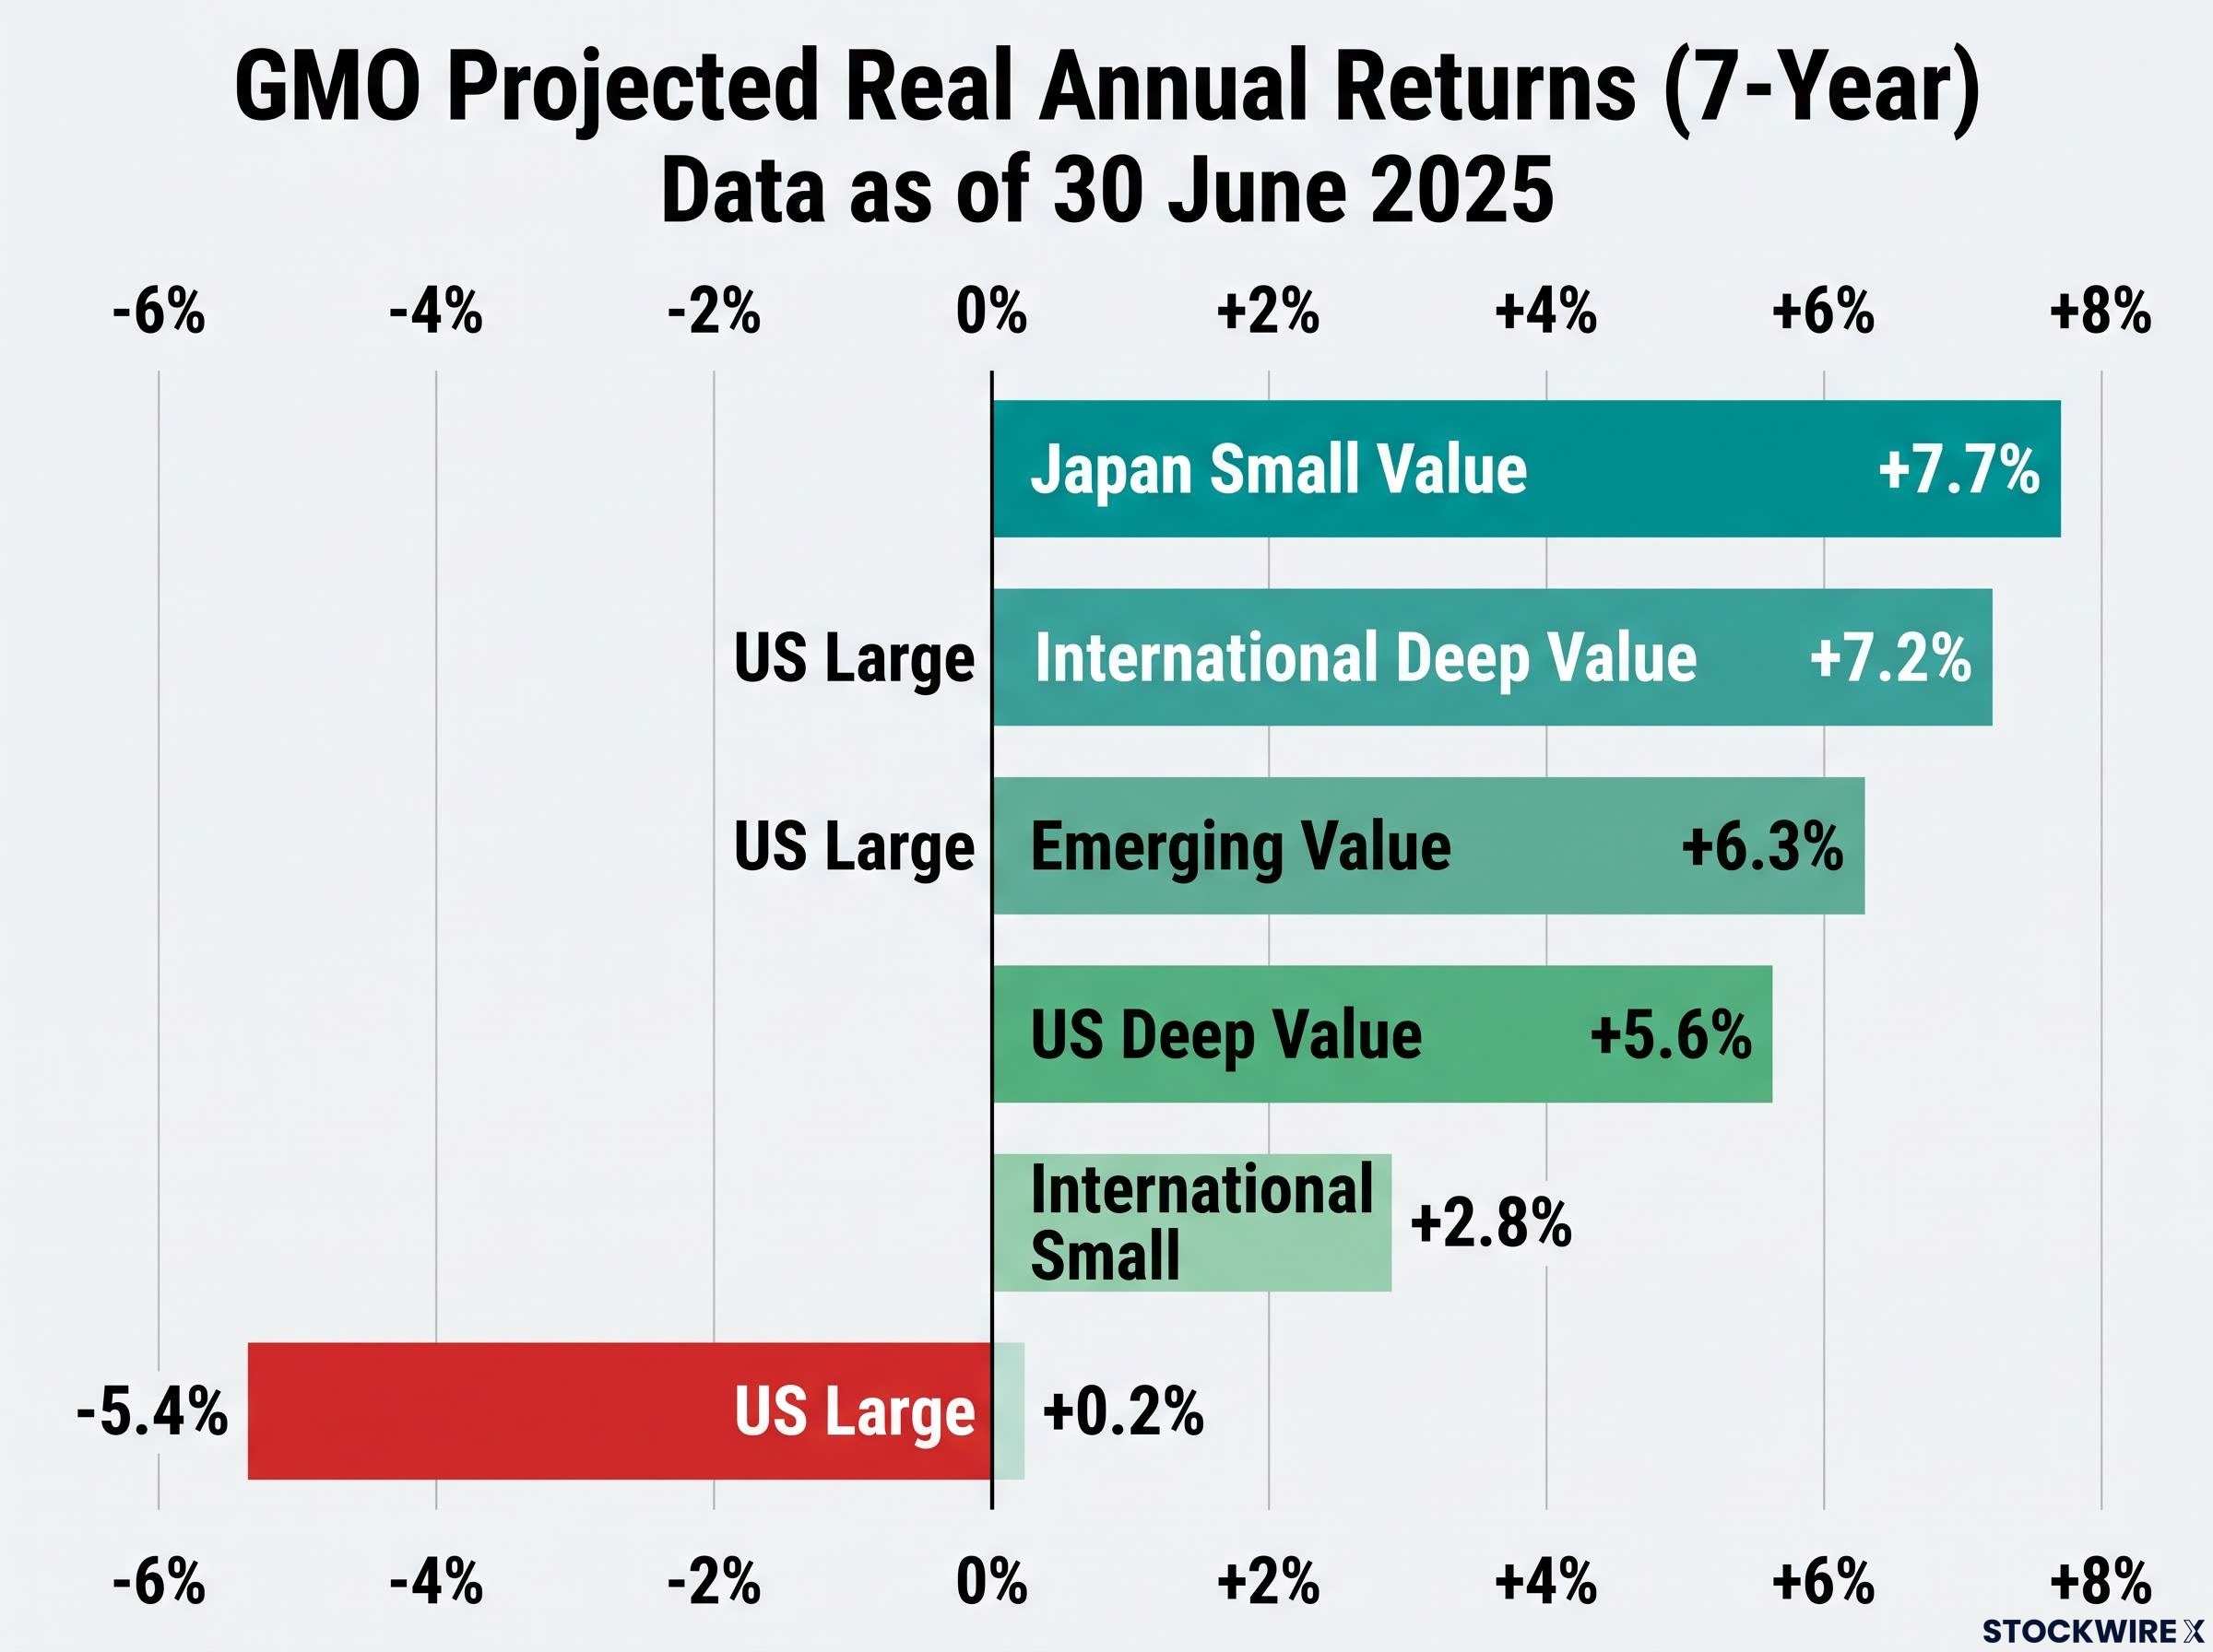
The figure that anchors the case GMO projects US large-cap equities to deliver a negative 5.4% real annual return over seven years, as of 30 June 2025.
A negative real return is not merely underperformance. It means the purchasing power of that capital shrinks each year after inflation. Over seven years, that compounds into a material erosion of what your money can actually buy.
| Asset Class | Projected Real Annual Return (7-Year) | Source | Base Date |
|---|---|---|---|
| US Large | -5.4% | GMO / RankiaPro | 30 June 2025 |
| US Deep Value | +5.6% | GMO / RankiaPro | 30 June 2025 |
| International Large | +0.2% | GMO / RankiaPro | 30 June 2025 |
| International Small | +2.8% | GMO / RankiaPro | 30 June 2025 |
| International Deep Value | +7.2% | GMO / RankiaPro | 30 June 2025 |
| Emerging Value | +6.3% | GMO / RankiaPro | 30 June 2025 |
| Japan Small Value | +7.7% | GMO / RankiaPro | 30 June 2025 |
These figures assume a normal interest rate environment and are forward-looking, so actual results may differ materially.
Vanguard’s decade-long view
Vanguard’s 2026 outlook reaches the same directional conclusion through a different door. Its ten-year projections put US equities at roughly 4.3% annual returns against approximately 6.1% for international equities, with international outperforming in around 70% of simulations.
Vanguard’s methodology is not GMO’s. One leans heavily on deep-value mean reversion; the other runs probability-weighted simulations across scenarios. That they converge on the same direction is the point.
The Vanguard figure is a median projection, not a guarantee. The 30% of simulations where the US wins are real outcomes, not rounding errors, and you cannot wave them away.
When two independent forecasters with different models land on the same directional read, treat that as a signal worth weighting, not a single data point to file next to conflicting opinions.
Bank of America’s S&P 500 return projections, which model cap-weighted annualised returns of negative 3% to positive 2% over the next decade, arrive through a different methodology than GMO’s but reinforce the same directional read: current multiples embed a level of optimism that leaves little room for the earnings disappointments that historical mean reversion typically delivers.
Why this matters more for investors with a ten-year-plus horizon
Forecasts are abstract until you connect them to how time actually works on a portfolio. This is where starting valuation and horizon interact, and it is the conceptual heart of the case.
The mechanism is mean reversion. When an asset trades at a steep discount to its intrinsic worth, time is on your side: dividends compound while you wait, and prices eventually drift back toward fair value. The longer your horizon, the more room that process has to play out.
Consider the illustrative arithmetic. A global value portfolio with price-to-earnings ratios near 10, dividend yields of 5-7%, and earnings growth of roughly 5% can generate close to 10% total annual returns. Look at where that return comes from.
- Yield contribution: the 5-7% dividend stream, paid regardless of what the share price does in a given year.
- Earnings growth contribution: roughly 5%, tracking underlying business expansion.
- Valuation normalisation: an optional bonus if the discount closes, not a requirement for the maths to work.
That structure is the opposite of a US large-cap growth position. When you buy at today’s high multiples, future returns depend almost entirely on continued earnings delivery and further multiple expansion. There is little income cushion underneath.
The dividend piece is where the difference becomes concrete during a downturn. For context, the broad MSCI World Value Index carries a dividend yield of 2.28% as of 31 August 2026, and the SPDR MSCI World Value ETF reports an index dividend yield of 2.65% as of September 2026. The deeper-value segments sit well above that, in the 5-7% range.
What reinvested dividends can do in a drawdown If a globally diversified value portfolio fell 50% alongside a broad selloff, reinvested dividends of roughly 5% annually over ten years could add 50-70% in cumulative return, potentially restoring or improving your position (original source framework).
Here is the read you should take. In a value portfolio, the income stream is doing structural work during a drawdown, not just offering emotional comfort. It buys more shares at depressed prices and compounds through the recovery, which is precisely the leverage a long horizon gives you.
The risks that make this rotation genuinely difficult
None of this is a certainty, and the case deserves its strongest counter-arguments stated plainly, not softened.
- US earnings exceptionalism may persist. Schroders weighs this directly: the US hosts a larger, more profitable technology sector, deeper and more liquid capital markets, and a sustained record of superior earnings growth. Markets outside the US are only “close to fair value,” which means a meaningful part of the discount may reflect genuine differences in earnings power rather than pure mispricing. If US margins stay structurally higher, value investors could be early or simply wrong.
- Cheap markets may be value traps. A low valuation can reflect real problems in earnings quality, governance, or sector composition. Prometeia found euro-area equities trade at lower CAPE ratios even after more aggressive rate cuts and lower corporate taxes, which suggests part of the discount may be structural rather than a mispricing waiting to correct. A discount justified by genuine weakness is not a catalyst for anything.
- Currency and liquidity risks. International and emerging-market positions carry exposures that US large-cap holders largely avoid.
- Macro tail risk. The original source flags, with reference to JP Morgan’s Michael Cembalest, the possibility of a debt crisis within roughly five years, a risk that would affect all equity markets.
Then there is scenario risk, which sits underneath all of the above. Vanguard’s simulations show US equities outperforming in about 30% of cases over the next decade. Anyone entering a global value rotation must be genuinely prepared to hold through extended stretches of continued US leadership.
Geopolitical fragmentation adds a layer of structural risk that sits underneath the valuation rotation: as major economies build separately investable industrial blocs through targeted semiconductor, EV, and green technology policy, the return correlation between regional equity markets declines, which simultaneously strengthens the diversification case and introduces jurisdictional and capital-control exposures that pure valuation analysis does not capture.
Implementation risks in practice
The practical frictions are real and worth naming.
- Currency exposure: international and EM value positions carry foreign currency risk that can either amplify or offset your local-currency returns.
- Liquidity: smaller and EM value segments can trade thinly at times, making large trades or hedging programmes more expensive and complex than dealing in US mega-caps.
- Tracking error: more concentrated value or EM allocations drift further from standard cap-weighted benchmarks, a live concern if you are judged against those benchmarks.
Where this leaves you is honest rather than comfortable. Entering global value is a probabilistic bet on mean reversion that demands patience. It is not a rotation into undervalued certainty, and understanding that is what lets you size the position sensibly instead of overcommitting.
Building a global value allocation without overcomplicating it
So how do you actually act on this without turning it into a research project? The core decision is simpler than it looks: how much global value weight to add, through which vehicle, and with what hedging posture.
At one end sits broad international index exposure, using something like MSCI ACWI ex US or MSCI World ex US as a straightforward diversifier. At the other sits a targeted position in deep value and EM value, where GMO’s projected return differential is sharpest, International Deep Value at positive 7.2% and Japan Small Value at positive 7.7%.
| Approach | Representative Index | Indicative Dividend Yield | Expected Return Guide | Key Trade-Off |
|---|---|---|---|---|
| Broad international | MSCI ACWI ex US / World ex US | Broad-market level | Vanguard ~6.1% (10-yr, intl) | Simple, but dilutes the value tilt |
| Value tilt | MSCI World Value | ~2.28% | Between broad and deep value | Moderate tilt, moderate conviction |
| Deep value / EM value | Deep Value, EM Value, Japan Small Value | 5-7% in deeper segments | GMO +6.3% to +7.7% (7-yr) | Highest projected return, highest risk and illiquidity |
On hedging, the trade-off is direct. Put option protection guards against downside but costs several percentage points of portfolio value each year, a material and permanent drag. Most value-oriented investors take a different route, using higher starting yields and diversification across geographically distinct markets to absorb shocks over time rather than paying ongoing premiums.
That choice reveals your own risk posture. Paying for puts is a decision to reduce volatility at the cost of expected return; building around high-yield value positions is a decision to let the income stream do the cushioning.
For a sense of the opportunity set, the research points to positions spread across geographies and sectors, illustrative rather than recommendations:
- Kazakh equities
- UK homebuilders
- Global automotive stocks
- Chinese technology names such as Xiaomi and Tencent
- Real estate investment trusts as a diversifying allocation
One caveat on fit. This approach suits investors with at least a ten-year horizon and a meaningful investable sum. If your balance is smaller, simpler positioning generally makes more sense than concentrated deep-value or EM exposure.
What the evidence asks of a long-horizon investor today
Pull the three strands together and they stop being separate data points. The valuation gap, the institutional return forecasts, and the dividend reinvestment mechanics reinforce one another: cheap starting prices, projected return spreads that favour value, and an income stream that compounds hardest when prices fall.
The spread itself is not marginal. GMO projects more than 12 percentage points per year between US large equities at negative 5.4% and International Deep Value at positive 7.2%. Vanguard’s median is gentler but points the same way, roughly 4.3% for the US against 6.1% international over ten years. Compounded over a decade, a gap that size is what determines whether you preserve or erode real purchasing power.
The honest caveat is timing. This valuation gap has persisted for years and could persist further, so the case rests on starting conditions and long-horizon compounding, not a near-term catalyst you can circle on a calendar.
Morningstar’s framing Valuation extremes tend to mean-revert, and investors who diversify into cheaper markets are better positioned for the eventual normalisation.
This is not an argument to sell your US holdings wholesale. It is a framework for one question you need to answer for yourself: given your horizon, your risk capacity, and your current portfolio, how much of that return differential are you currently leaving on the table?
For readers wanting to track how this valuation thesis has begun translating into actual market performance, our full explainer on the 2026 international stock rotation covers the specific geopolitical catalyst, country-level return data, and the forward P/E spread that Yardeni Research identified as the foundation of its ‘Go Global’ call.
This article is for informational purposes only and should not be considered financial advice. Investors should conduct their own research and consult with financial professionals before making investment decisions. Past performance does not guarantee future results. Financial projections are subject to market conditions and various risk factors, and these statements are speculative and subject to change based on market developments.