
Most investors hear “the Fed is hiking” and assume REITs must fall. The record from 2004, 2015 and 2022 says the size and speed of tightening matter more than the headline. On 16 September 2026, the Federal Reserve raised its target range to 3.75-4.00%, the first hike since July 2023, and the question for REITs and Fed rate hikes is which kind of cycle this turns out to be.
For a Singapore income investor, the answer matters now. Markets price roughly even odds of another 25 basis point (bp) move at the next meeting, and the distributions from S-REITs depend on how quickly global rates feed into local funding costs.
Here is a way to judge what sort of cycle you are facing, and which S-REITs are better placed to absorb it.
Why does the pace of Fed hikes matter more than the hikes themselves?
You might assume every hiking cycle hurts REITs. It does not, and the reason comes down to how a REIT is valued: by the present value of the rental income it is expected to earn. Raise the rate used to discount that income and the value falls, unless the income itself is rising.
Four channels explain the outcome.
Each of these rate transmission channels works in both directions, so the same mechanics that lift REIT valuations in a cutting cycle can reverse quickly when inflation forces central banks to keep tightening.
Valuations and cap rates
- Cap rates and valuations. The cap rate is the annual property income divided by the property’s value, and it tends to move with bond yields. Higher cap rates push valuations down and weaken price-to-NAV (the share price relative to net asset value per unit).
- Borrowing costs and debt structure. REITs with long maturities, fixed-rate debt and strong hedging reprice slowly. Those leaning on short-term floating debt see interest costs rise faster than rents, which cuts distribution per unit (DPU, the cash paid to each unitholder).
- Growth versus rates as the dominant driver. When hikes reflect a strong economy, rents and occupancy rise and can offset valuation pressure. Sectors with pricing power, such as industrial, logistics and data centres, tend to cope best.
- Yield spreads to government bonds. Investors judge REITs by the gap between DPU yield and government bond yields. Moderate cycles leave that gap intact; aggressive ones squeeze it.
Debt costs and yield spreads
Compare the two kinds of hike. In a growth-led cycle, cap rates drift up slowly while income climbs. In an inflation-fighting cycle, discount rates reset before fundamentals adjust.
The “double drag”: inflation-fighting hikes lift discount rates and threaten occupancy and rents at the same time.
So the useful question is not “will the Fed hike?” but “why is it hiking, and how fast?” That changes how you should read every rate headline.
When big ASX news breaks, our subscribers know first
What did 2004, 2015 and 2022 actually show about REIT returns?
The first reaction told you very little. According to the PhillipCapital webinar underlying this research, REIT performance one week after the first hike was positive in 2004, 2015 and 2022.
Twelve months on, the cycles diverged. The gradual 2004 cycle ran for 24 months and delivered positive longer-term returns. The 2022 cycle added 500 bp in 18 months, and 12-month returns turned negative.
| Cycle | Length and pace | Dominant driver | One-week reaction | Longer-term outcome |
|---|---|---|---|---|
| 2004 | 24 months, gradual | Growth | Positive | Positive |
| 2015 | Slow pace | Growth | Positive | Consistent with 2004 pattern |
| 2022 | 500 bp in 18 months | Inflation-fighting | Positive | Negative 12-month returns |
One limit applies: precise FTSE Nareit 12-month returns from each cycle’s first hike could not be located, so this comparison stays qualitative.
- An early rally after a hike is not confirmation of safety.
- Pace and driver of the full cycle shaped the outcome.
- Gradual, growth-led cycles have been kinder to REIT holders than rapid, inflation-led ones.
Where do S-REITs stand as the Fed moves to 3.75-4.00%?
The Fed backdrop
The 16 September 2026 decision was unanimous (12-0) and lifted the range from 3.50-3.75% to 3.75-4.00%. CME FedWatch showed about 51% odds of another 25 bp hike at the next meeting against 49% for a hold, according to Fox Business.
Pricing points to a mid-cycle adjustment rather than an aggressive shock. (The webinar cited a “2.75-4%” range; that appears to be an error.)
S-REIT balance sheets
The webinar expects about 20 bp of year-over-year interest savings, helped by favourable 3-month SORA (Singapore’s benchmark overnight rate), and put FY2026 distribution growth at 3.2%. That is the webinar’s own estimate, not a verified broker consensus.
SORA financing costs have fallen for the SGD-funded majority of S-REITs, though trusts carrying EUR or JPY debt face a different trajectory because those benchmarks have risen.
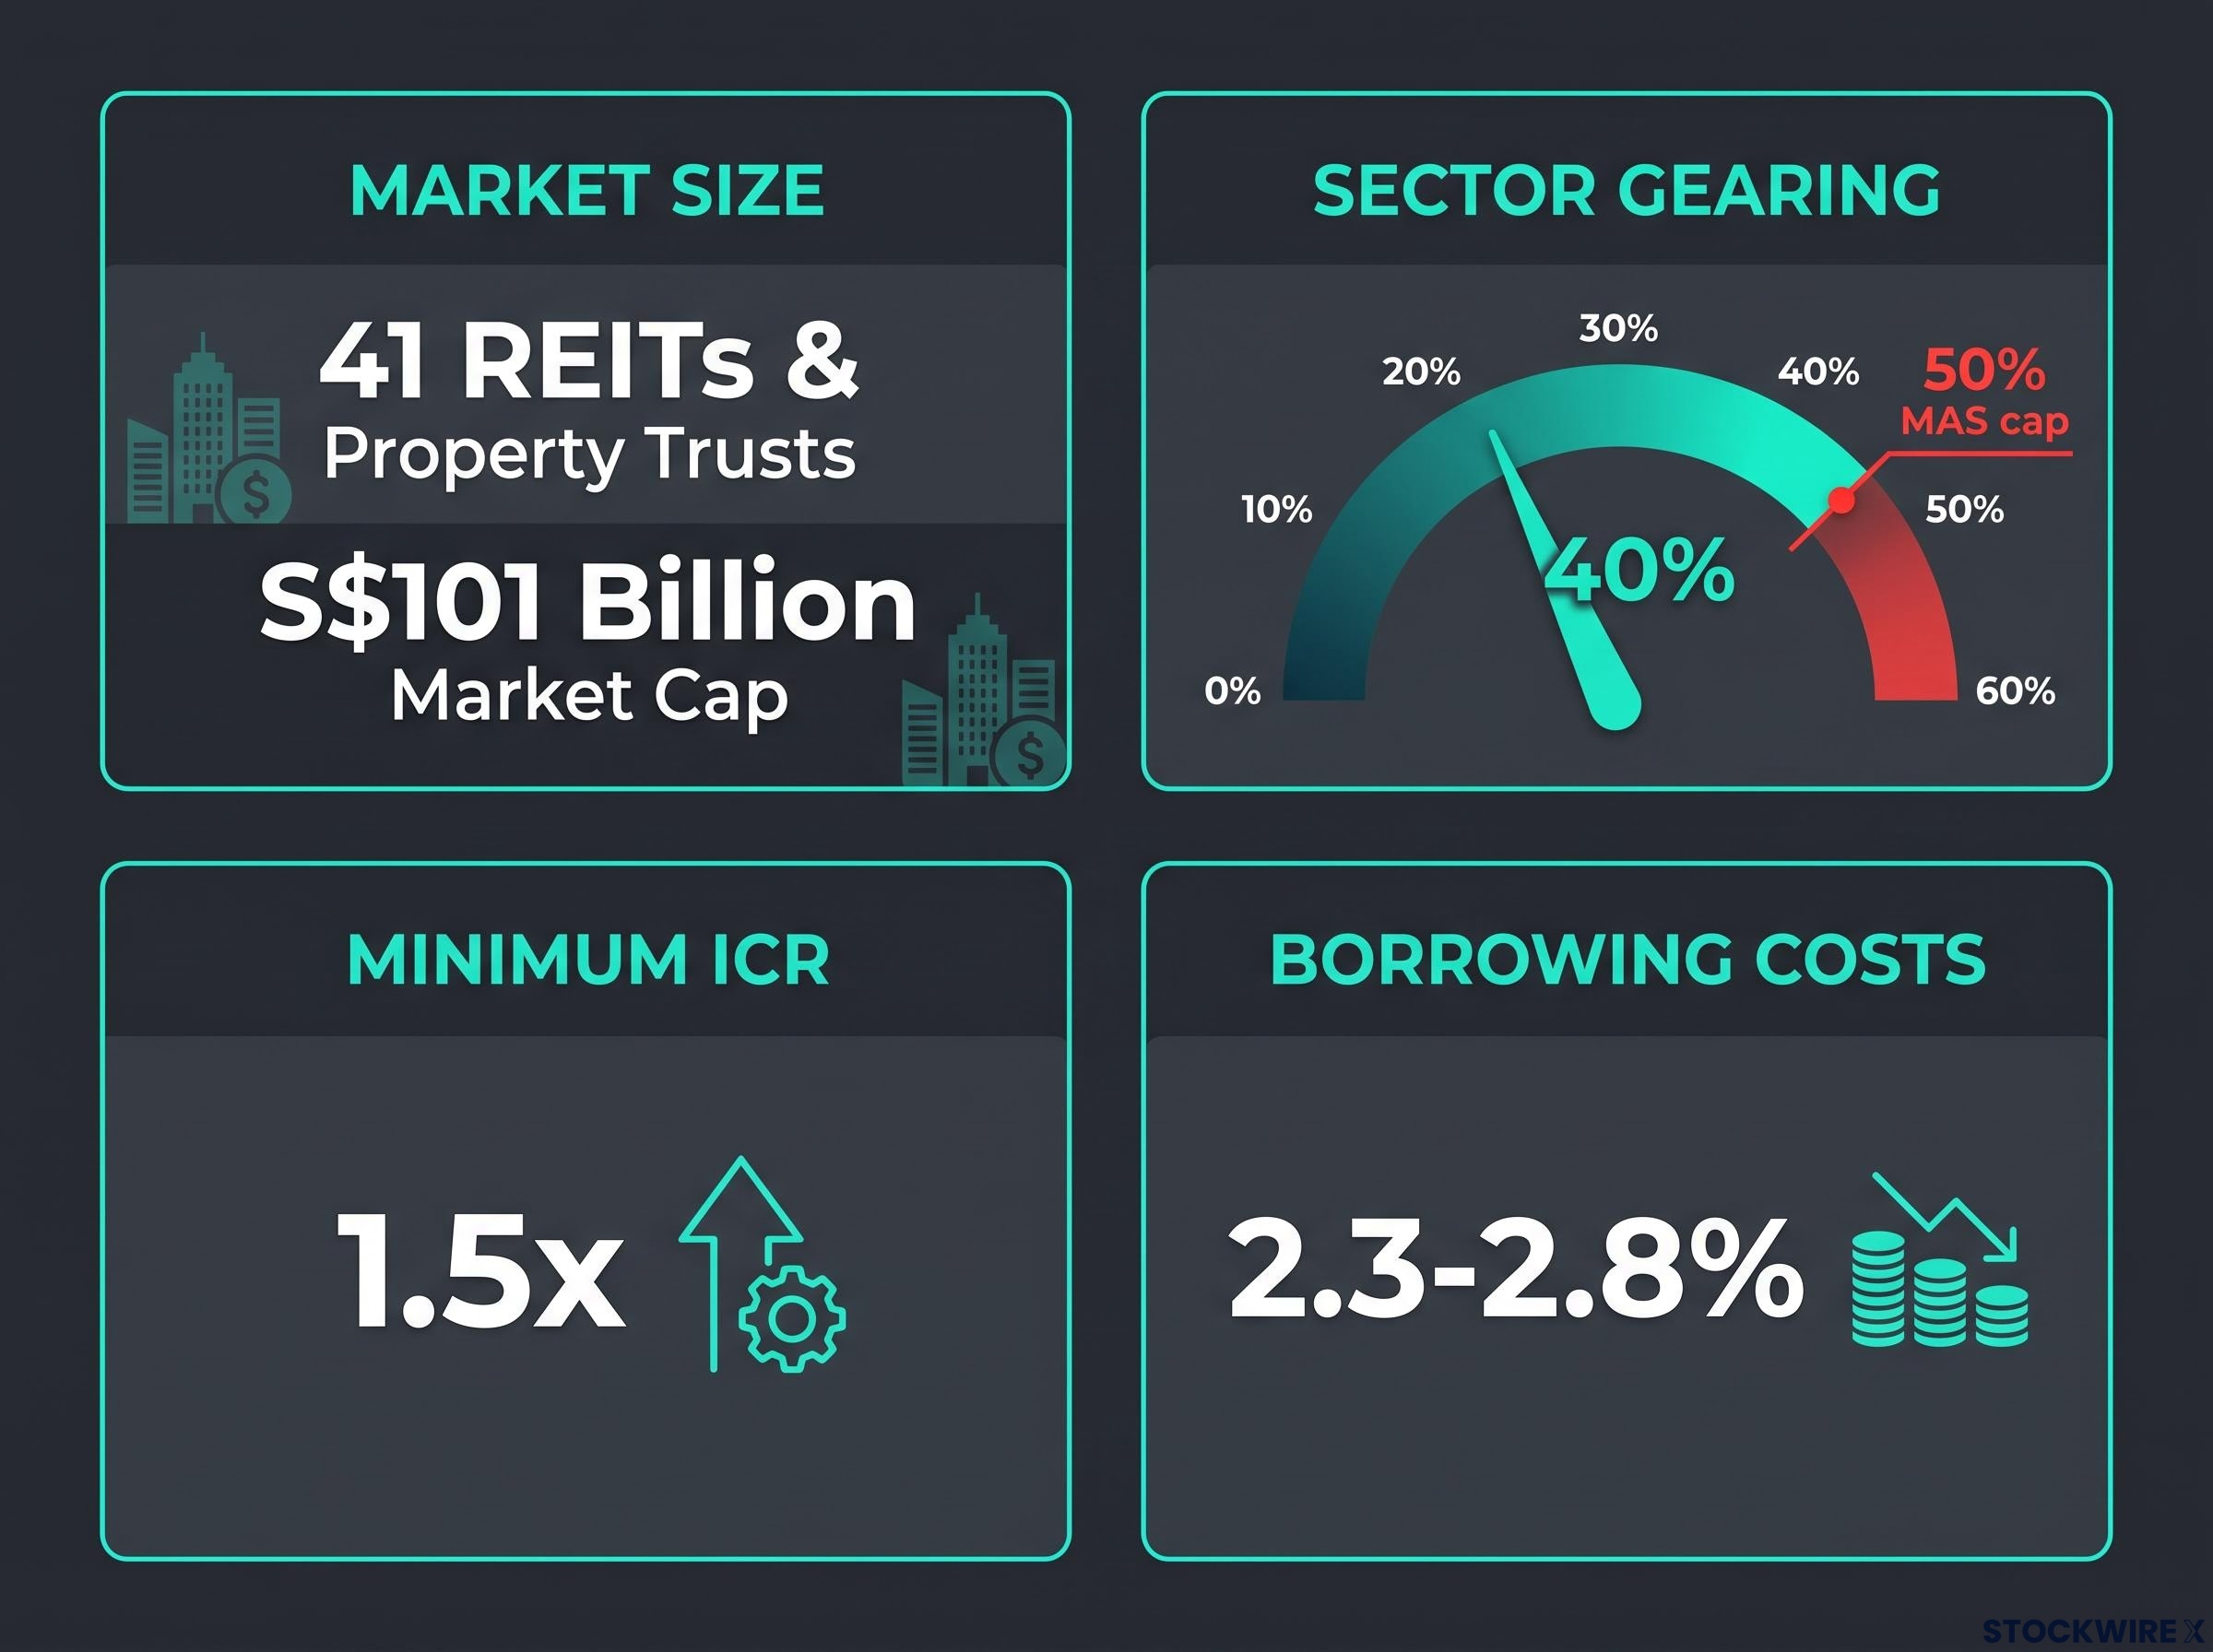
- 41 REITs and property trusts, about S$101 billion in market capitalisation (SGX-Research Chartbook, Q3 2025)
- Sector gearing near 40%, against a 50% Monetary Authority of Singapore (MAS) cap set in the 28 November 2024 Code revision
- Minimum interest coverage ratio (ICR) of 1.5x
- Borrowing costs of 2.3-2.8% (Q3 2025)
- Best debt-profile names average about 33.5% gearing
The latest SORA level and sector-wide ICR could not be located.
Worked example, ESR-REIT: cost of debt fell from 3.84% to 3.35% in FY2025, then rose to 3.52% at 1H2026. Gearing was 41.4% at 30 June 2026.
That drift tells you savings are being handed back. Expect modest DPU growth, and do not underwrite last year’s cost of debt.
Retail, hospitality and China exposure: which sub-sectors face the biggest rate risk?
Retail
Retail is the strongest case. The webinar reported July 2026 retail sales up 1.5%, led by recreational goods and luxury, with strong rental reversion potential (the uplift when expiring leases reset to market rents).
Hospitality
Hospitality is mixed. August visitor arrivals fell 0.3%, are down 2% year-to-date and sit 11% below pre-COVID levels, a fifth straight month of contraction, cushioned partly by events such as BTS concerts. Singapore’s electronics exports, up 132%, and semiconductors, up 90%, show how far trade is diverging from tourism.
China outlets and the Sasseur example
China outlets are the most exposed. Property prices are back to 2016-2018 levels, private investment is down over 10% and retail sales growth is below 1%.
Yet Sasseur REIT’s Chongqing outlets held up: Liang Jiang rose 4%, Bishan 3.5%, and VIP membership grew 17%, contributing over 60% of sales. The retail and visitor figures rest on the webinar, as SingStat and STB releases were not independently retrieved.
| Sub-sector | Key data point | Main support | Main risk | Rate sensitivity |
|---|---|---|---|---|
| Retail | July sales up 1.5% | Rental reversion | Spread compression | Moderate |
| Hospitality | Arrivals down 0.3% in August | Seasonal events | Volatile RevPAR | Moderate, with tourism risk on top |
| China outlets | Sasseur Liang Jiang up 4% | VIP programme | Macro and currency stress | Country risk may outweigh rates |
The rate path is only one variable. For hospitality and China-exposed names, sub-sector risk may outweigh any Fed effect, which argues for wider required spreads and smaller positions. A stronger SGD also trims translated overseas DPU.
Overseas commercial S-REITs illustrate the point: foreign-currency debt costs and maturing hedges pushed them down 6.5% in June 2026 while diversified S-REITs gained 3%.
How can income investors read the rate cycle without trying to time it?
Preparation beats prediction. Here is a four-step checklist you can apply to any S-REIT this week.
- Track policy and market rates together. Watch the Fed range, CME FedWatch, SORA and Singapore Government Securities (SGS) yields to see how fast global rates reach local funding costs.
- Study the debt profile. Check these metrics:
- Gearing versus the 50% cap
- ICR versus 1.5x
- Average cost of debt
- Hedge ratio
- Maturity ladder
- Prioritise cash-flow quality over headline yield. Favour diversified tenants, long weighted average lease expiry (WALE) and pricing power.
- Use yield spreads over SGS, not absolute yields.
Spreads, not absolute yields: a high yield means little unless it sits comfortably above what government bonds pay.
Current spreads over SGS were not located, so no figure is quoted here. The cautious case is that spreads narrow if DPUs stagnate and SGS yields follow the Fed. The right response is price discipline and sector rotation, not abandoning REITs.
Watch the hedges locked in during 2020-2022 that roll off over 2025-2027. For weaker REITs with short WALEs, cost of debt could move from 2.3-2.8% toward 3-4%. Your edge is checking balance sheets and lease quality, not forecasting the next FOMC decision.
What the cycle changes for S-REIT income, and what it does not
The September 2026 hike, with roughly even odds of another, means the cycle is not over. Markets still read it as mid-cycle rather than a 2022-style shock.
S-REITs enter with gearing near 40%, moderate borrowing costs and MAS discipline. That supports income from quality retail and industrial names, even as DPU growth stays modest and SORA savings are gradually returned.
Hospitality and China-exposed names warrant wider spreads and smaller positions. Anchor on balance-sheet strength, asset quality and DPU sustainability rather than timing individual hikes, and watch refinancing and hedge roll-offs as the variable that matters most.
Investors exploring where to position can read our full explainer on S-REIT selection by sub-sector and debt structure, which examines named BUY-rated trusts.
This article is for informational purposes only and should not be considered financial advice. Investors should conduct their own research and consult with financial professionals before making investment decisions. Past performance does not guarantee future results. Forward-looking estimates, including the 3.2% DPU growth figure, are speculative and subject to change based on market developments.