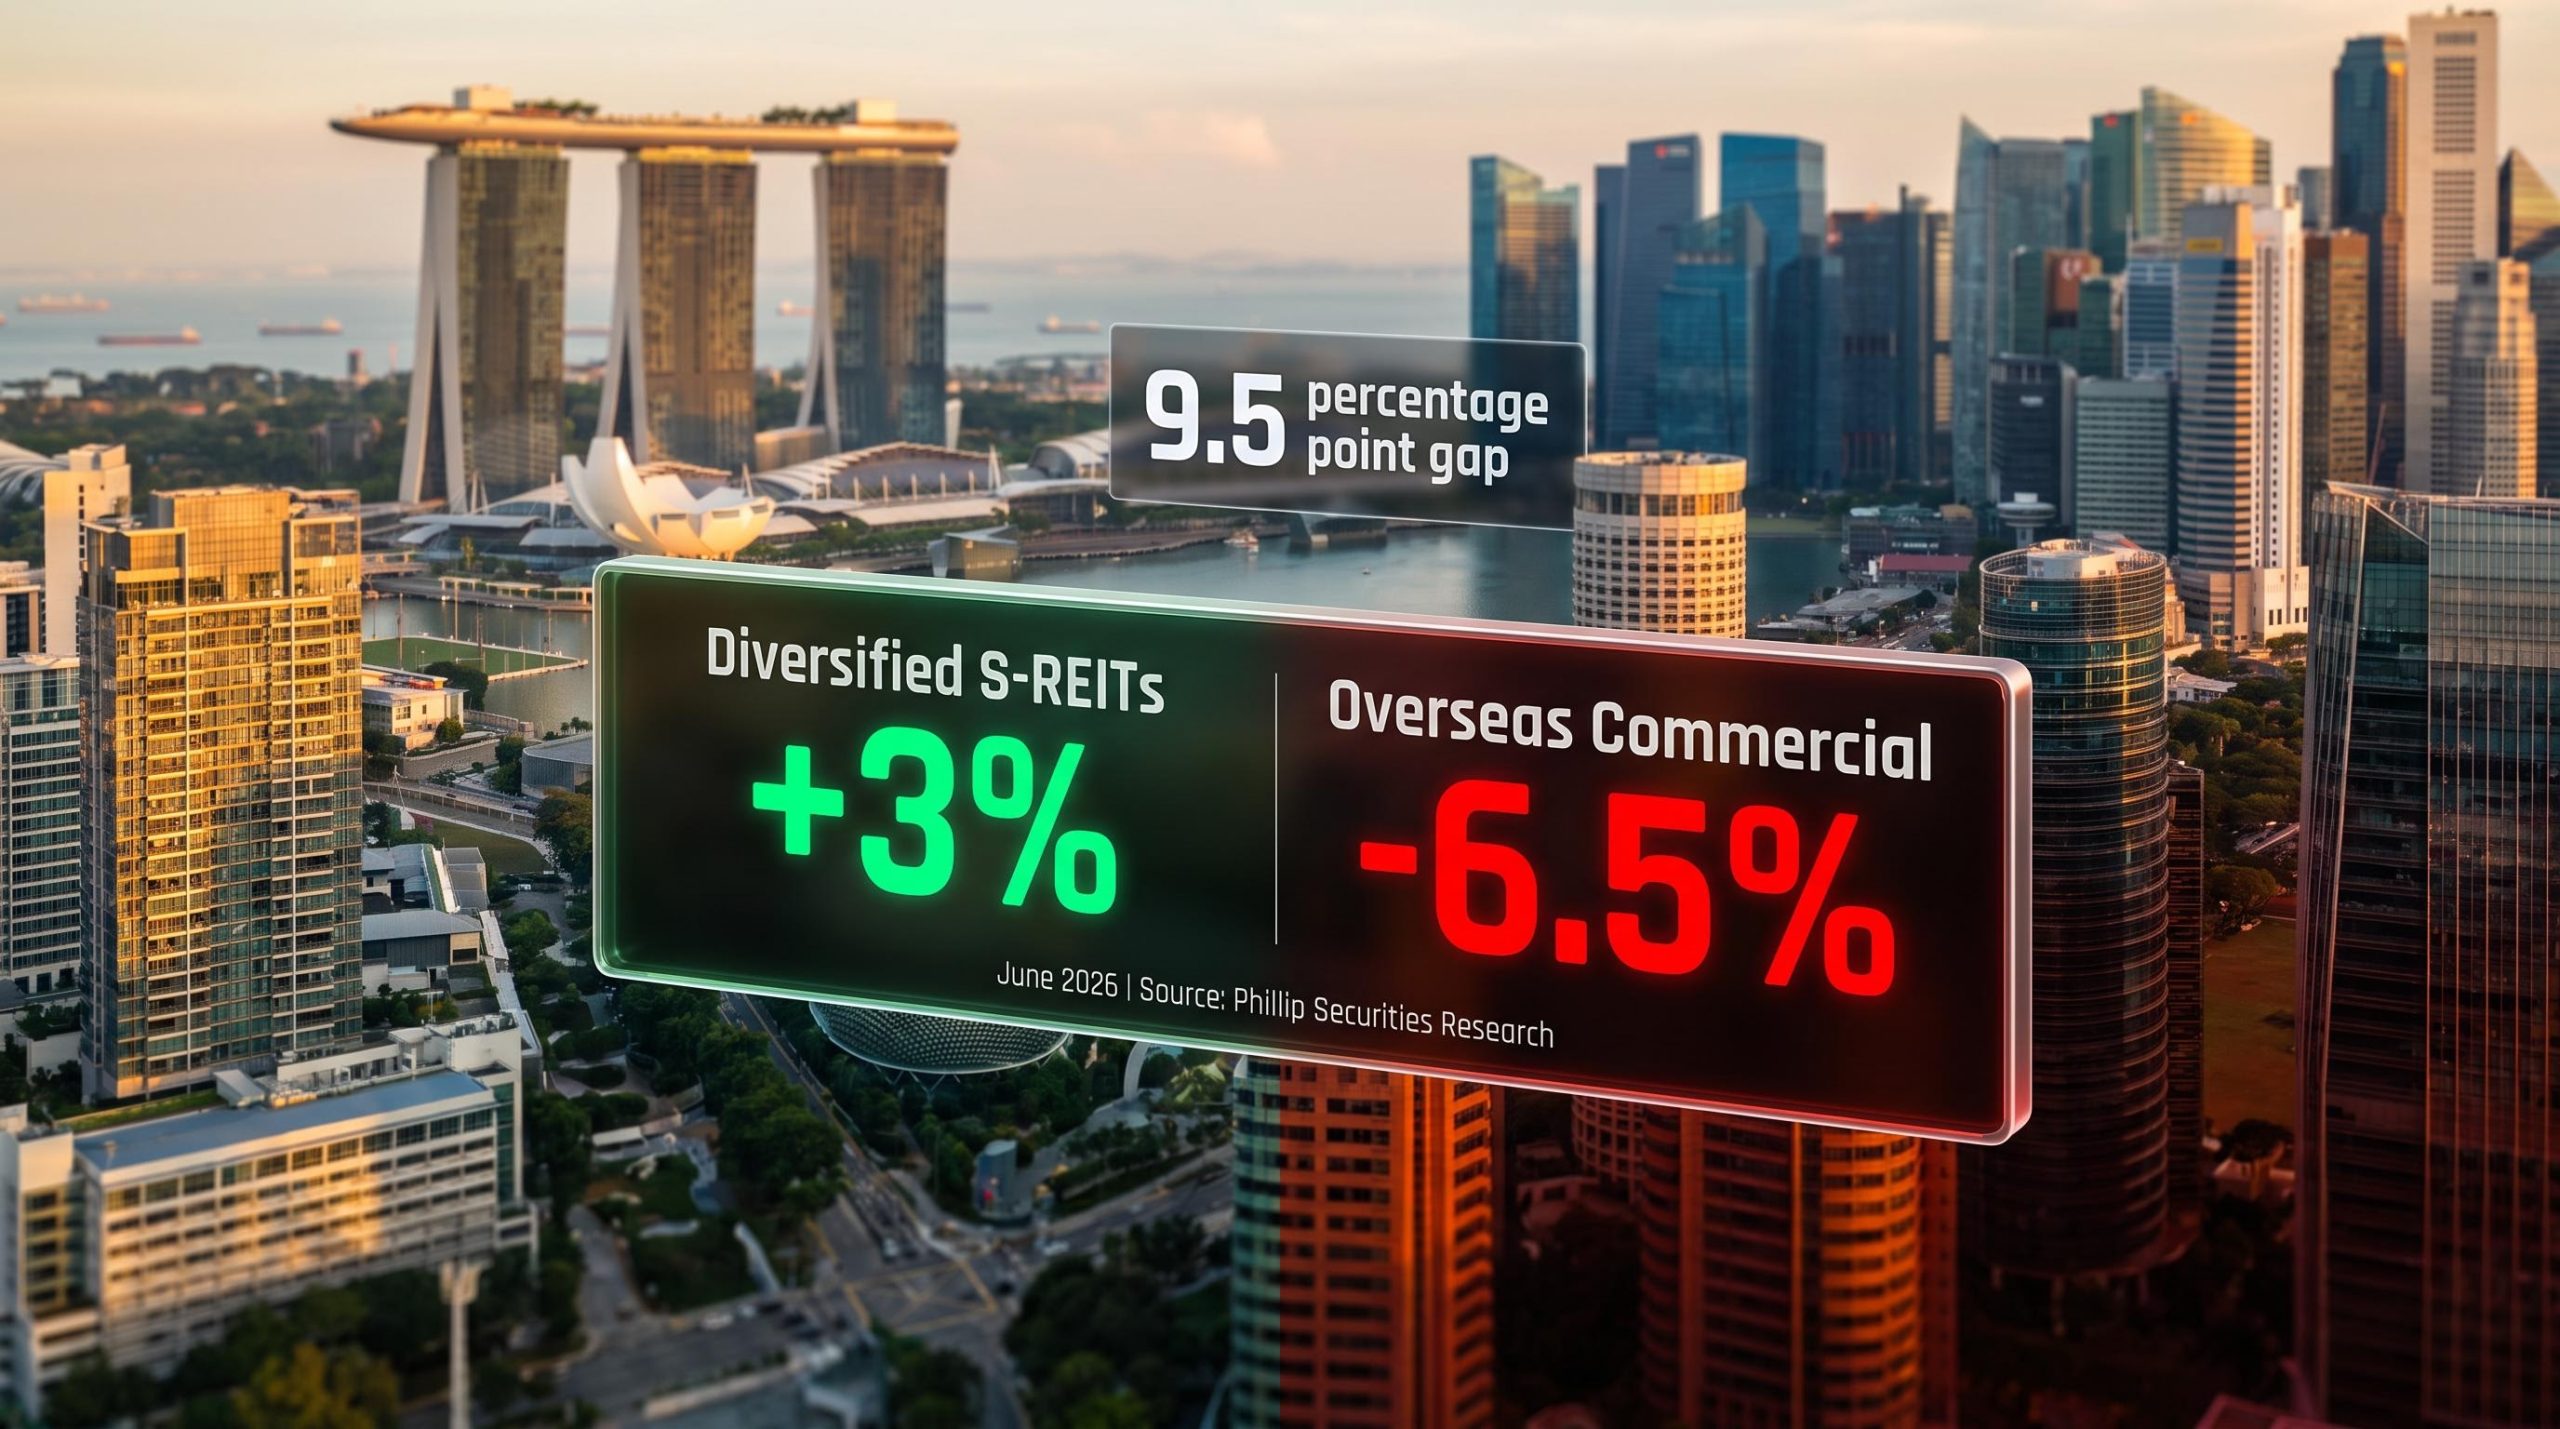
In June 2026, two corners of the Singapore REIT market moved in opposite directions by nearly 10 percentage points within the same month. That kind of dispersion inside a single asset class does not happen by accident.
Among the sub-sectors, diversified S-REITs posted a 3% gain while the overseas commercial category shed 6.5%, sitting at the bottom of the performance table for the month. At the same time, the Singapore-Johor Bahru Rapid Transit System (RTS) Link moved closer to opening, prompting concern about whether cross-border transit would drain spending away from Singapore retail REITs. Both stories are connected by the same underlying logic: in a volatile rate environment, where assets are located, what type they are, and how they are funded determines returns far more than the S-REIT label itself.
Here is the framework for understanding the structural forces behind the June divergence, the real (and limited) threat the RTS Link poses to retail REITs, and what both stories together tell you if you are trying to position S-REIT exposure with more precision than a sector-wide view allows.
The 9.5-percentage-point gap: what June 2026 actually showed
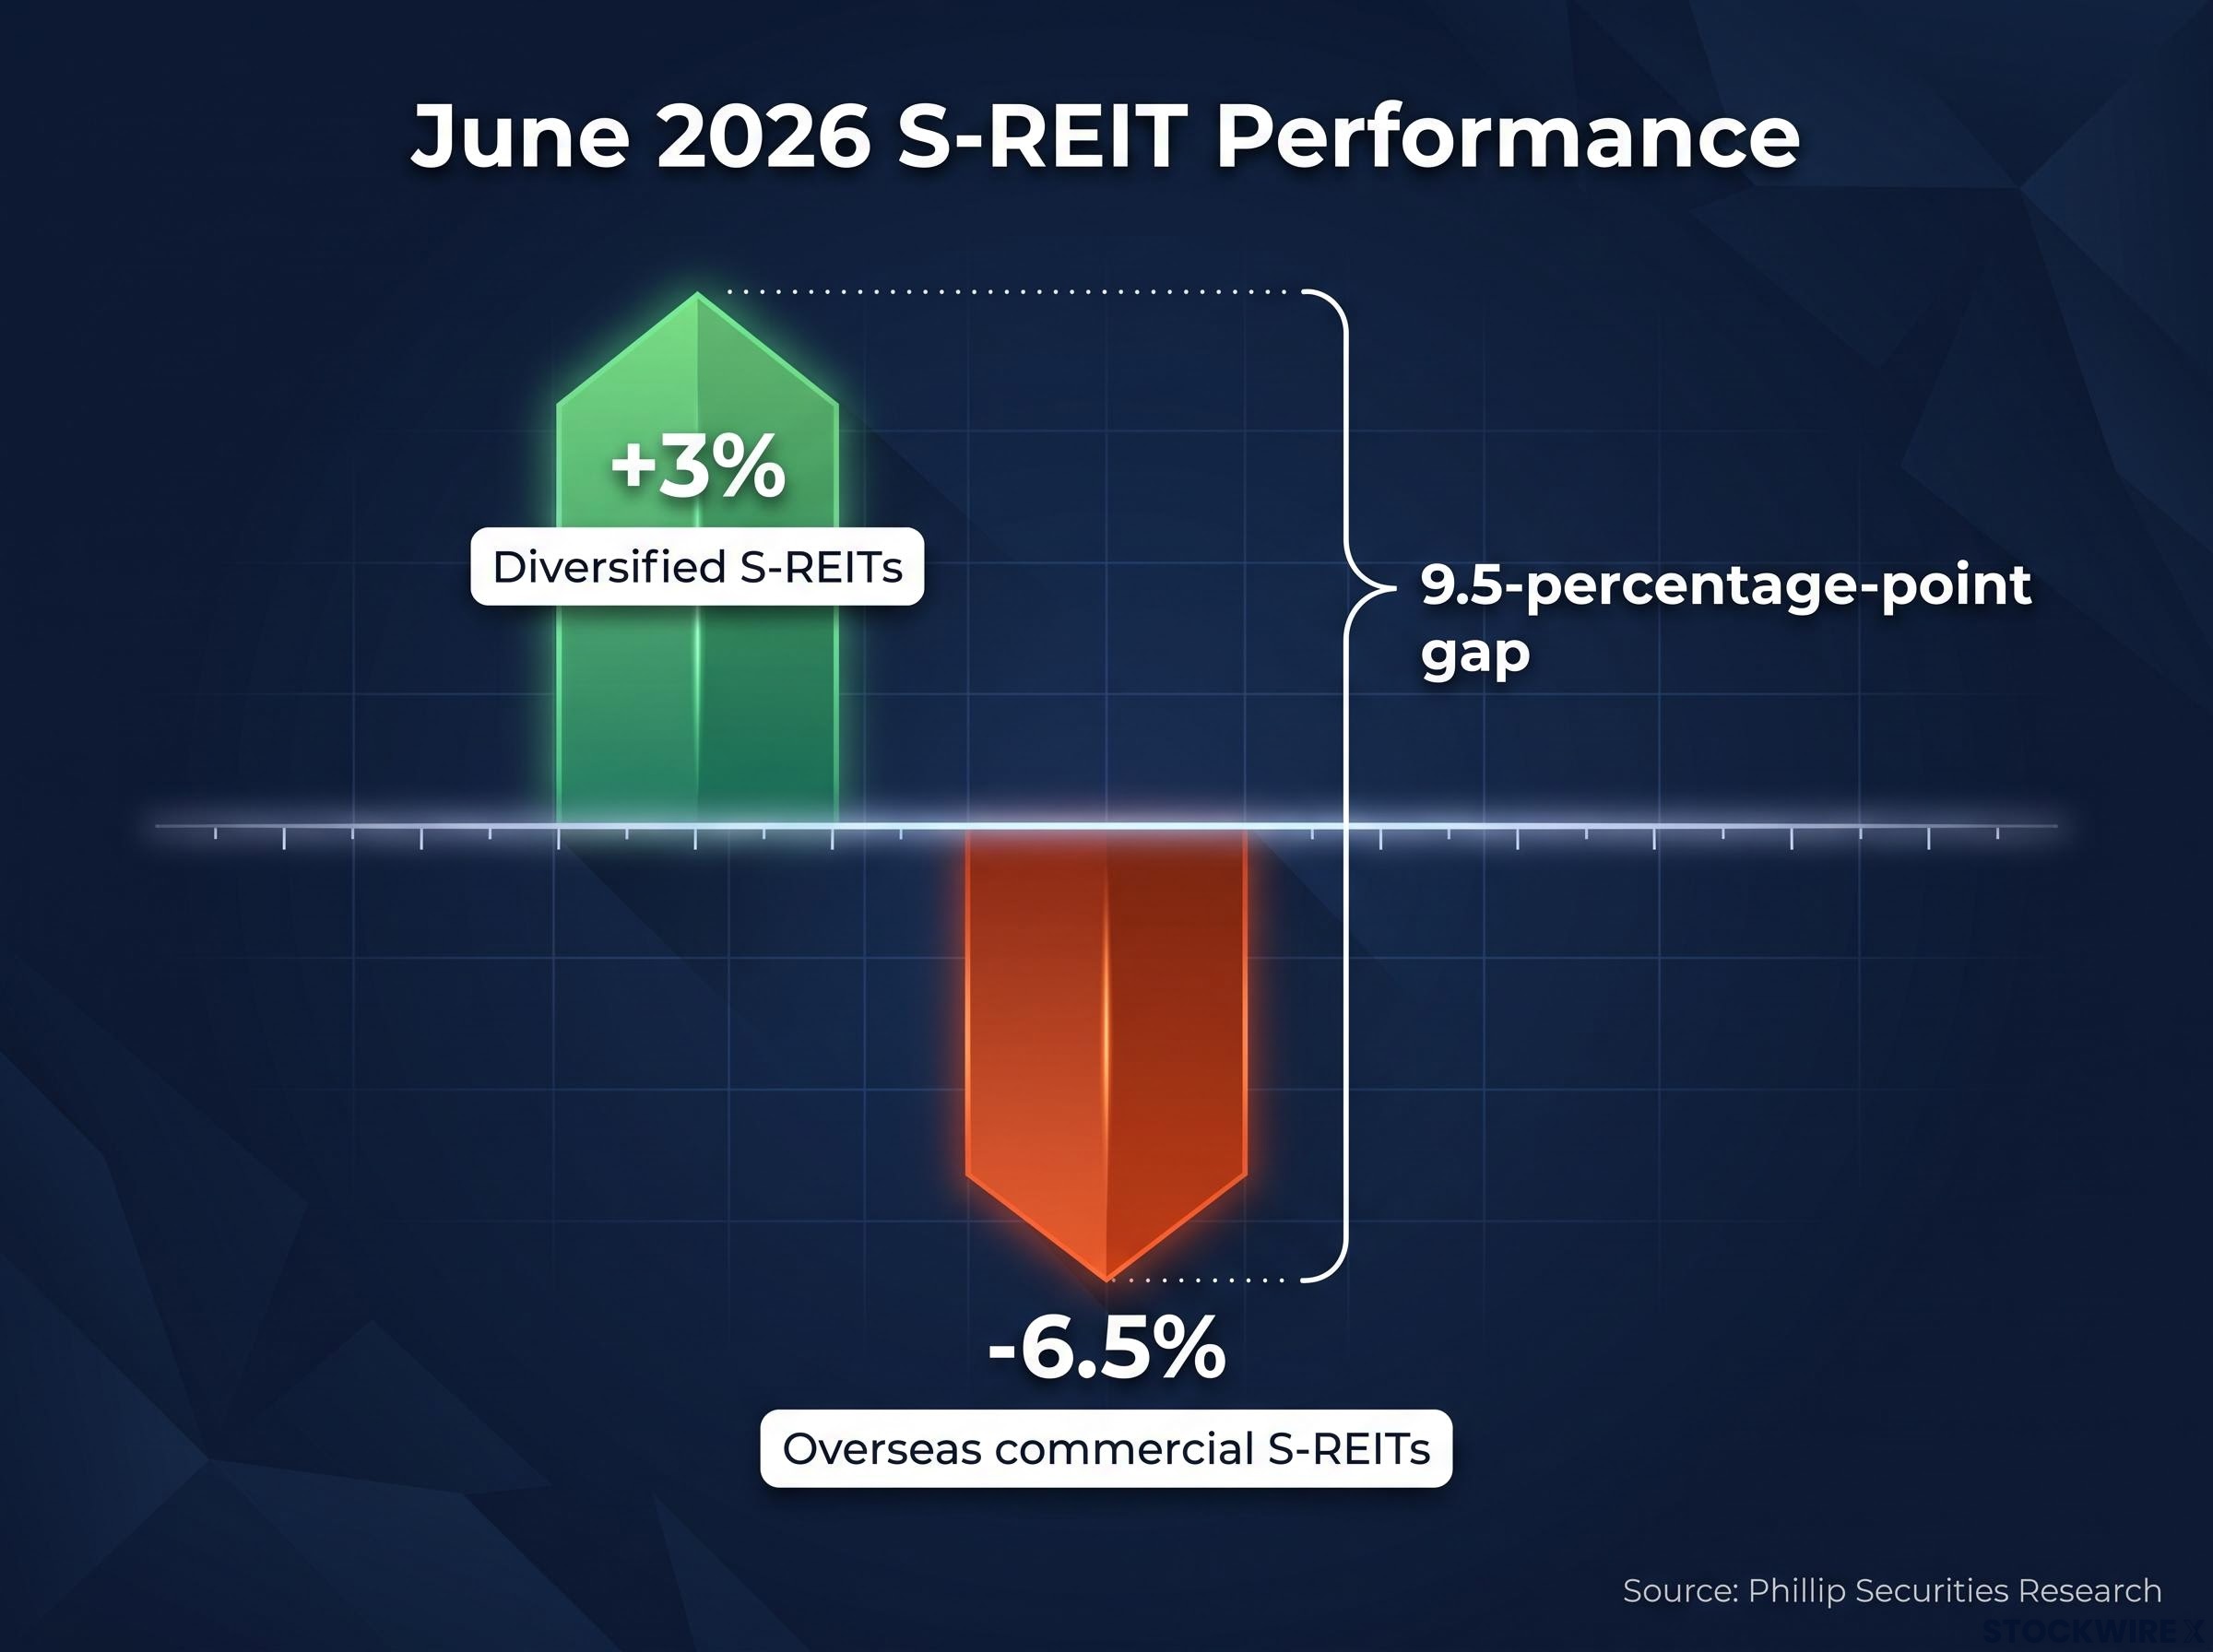
June 2026 S-REIT performance: Diversified sub-sector +3% | Overseas commercial sub-sector -6.5% Source: Phillip Securities Research
A 9.5-percentage-point gap within one month, inside a single listed asset class. Across all S-REIT categories in June, the diversified sub-sector came out on top while the overseas commercial sub-sector sat at the opposite end of the table. The numbers alone tell you that treating S-REITs as a uniform income instrument is no longer analytically defensible. Sub-sector selection carried as much return consequence in June as asset-class allocation does over full-year periods.
Sub-sector and debt structure selection carried the same explanatory weight in May 2026, when the same S-REIT index produced a spread from plus 4.6% to close to minus 20% within a single month, a pattern that confirms June’s divergence was not an isolated event but part of a recurring structural dynamic.
The gap was not random. It reflected structural forces that had been building throughout 2026, and it arrived in a month where those forces compounded rather than offset each other.
How Singapore fits the global pattern
Singapore’s June divergence was not idiosyncratic. Global REIT data for 2026 shows a consistent pattern of wide return dispersion across sectors and regions. Lodging, resorts, and retail have outperformed in most markets, while more rate-sensitive segments, particularly industrial and mortgage REITs, have lagged.
The same rotational logic is playing out across global listed REIT markets: property type and geography drive large return differentials within what investors often treat as a single asset class. Singapore’s June performance figures sit squarely within that recognisable pattern.
When big ASX news breaks, our subscribers know first
Why diversified S-REITs pulled ahead
The 3% gain in June was not one piece of good news. It was three compounding structural advantages working simultaneously, which made the outperformance feel overdetermined rather than opportunistic.
- Portfolio construction effect: Diversified S-REITs hold industrial, logistics, retail, and office assets within a single vehicle. When one segment underperforms (office, for instance), others buffer the impact. Global commentary in 2026 stresses that investors are using diversified REIT vehicles specifically to smooth sector-specific shocks and capture broad real-asset cash flows.
- Domestic rate and FX insulation: A diversified S-REIT primarily anchored in Singapore-dollar income streams avoids the direct transmission of rate hikes from the Reserve Bank of Australia (RBA), the European Central Bank (ECB), or the Bank of Japan (BoJ) into its borrowing costs. Portfolio managers in 2026 consistently identify regional rate divergence as a key driver of REIT return gaps.
- Structural demand for industrial and logistics assets: Global research points to durable demand for logistics and data-linked assets even when broader commercial sentiment is mixed. Diversified S-REITs with meaningful industrial and logistics exposure are positioned to capture these more resilient flows, supporting both occupancy rates and rental growth.
For a reader holding or evaluating S-REITs, this means that diversification at the trust level is functioning as a genuine risk-adjusted return advantage in 2026, not merely a marketing label. The three advantages compound: the asset mix dampens volatility, the domestic income base avoids foreign rate transmission, and the logistics component captures structural demand. Any one of these would help. Together, they explain why diversified led the field.
What is pushing overseas commercial REITs lower
The -6.5% figure becomes less surprising when you trace the sequence of compounding pressures that produced it.
It starts with rates. Policy rates at the RBA, ECB, and BoJ have all moved higher in 2026, with renewed inflationary pressure tied to the continuing Middle East conflict providing part of the impetus. When these central banks tighten, S-REITs with foreign-currency, variable-rate debt in Australian dollars, euros, or yen see immediate margin compression as interest costs rise. Refinancing fixed-rate tranches at higher coupons erodes distributable income over time. According to global analyses, REITs with high leverage and exposure to regions where rate cuts are delayed face more persistent valuation pressure.
The rate transmission channels that produce this margin compression operate through four distinct mechanisms: the discount rate effect on future cash flows, the direct cost of variable-rate debt, yield competition with government bonds, and the economic outlook signal embedded in central bank decisions.
Then the hedging buffer starts to thin. Existing hedging arrangements provide some protection, but hedges are time-bounded. As swaps and forwards mature, replacements lock in less favourable terms. The buffer is therefore partial and diminishing rather than permanent, allowing more of the underlying rate move to bleed into earnings with each passing quarter.
Layer in the third pressure: office-specific operating weakness. Overseas commercial S-REITs that skew toward office assets face cities still grappling with hybrid-work dynamics and space optimisation. That creates income uncertainty and cap-rate expansion on top of the financing squeeze. The compound exposure, weak operating fundamentals plus rising borrowing costs, explains why the June decline was as severe as it was.
What this tells you is that the performance gap is unlikely to close quickly for overseas commercial names unless rate trajectories in host markets shift materially or portfolio composition changes. Readers with exposure to these instruments are holding vehicles facing a double headwind that will not resolve in a single quarter.
| Dimension | Diversified S-REITs | Overseas Commercial S-REITs |
|---|---|---|
| Geography | Primarily Singapore-anchored income | Heavy exposure to AU, EU, JP rate-hiking markets |
| Asset type | Blended: industrial, logistics, retail, office | Skewed toward commercial office |
| Rate exposure | SGD-denominated or well-hedged funding | Foreign-currency debt exposed to rising policy rates |
| Hedge status | Lower reliance on foreign-rate hedges | Existing hedges diminishing as swaps mature |
What the RTS Link actually means for retail REITs (and what it does not)
If you arrived at this topic concerned about spending leakage, the single most important number to anchor on is this:
0.4% of Singapore’s total retail and F&B sales recorded in 2025 is the estimated net leakage impact once the RTS Link opens. Source: July 2026 study commissioned by the Singapore Business Federation, Restaurant Association of Singapore, and Singapore Retailers Association; cited in Phillip Securities Research
That figure is worth sitting with. It reframes the question from “how bad is the damage” to “which specific assets face it and which do not.”
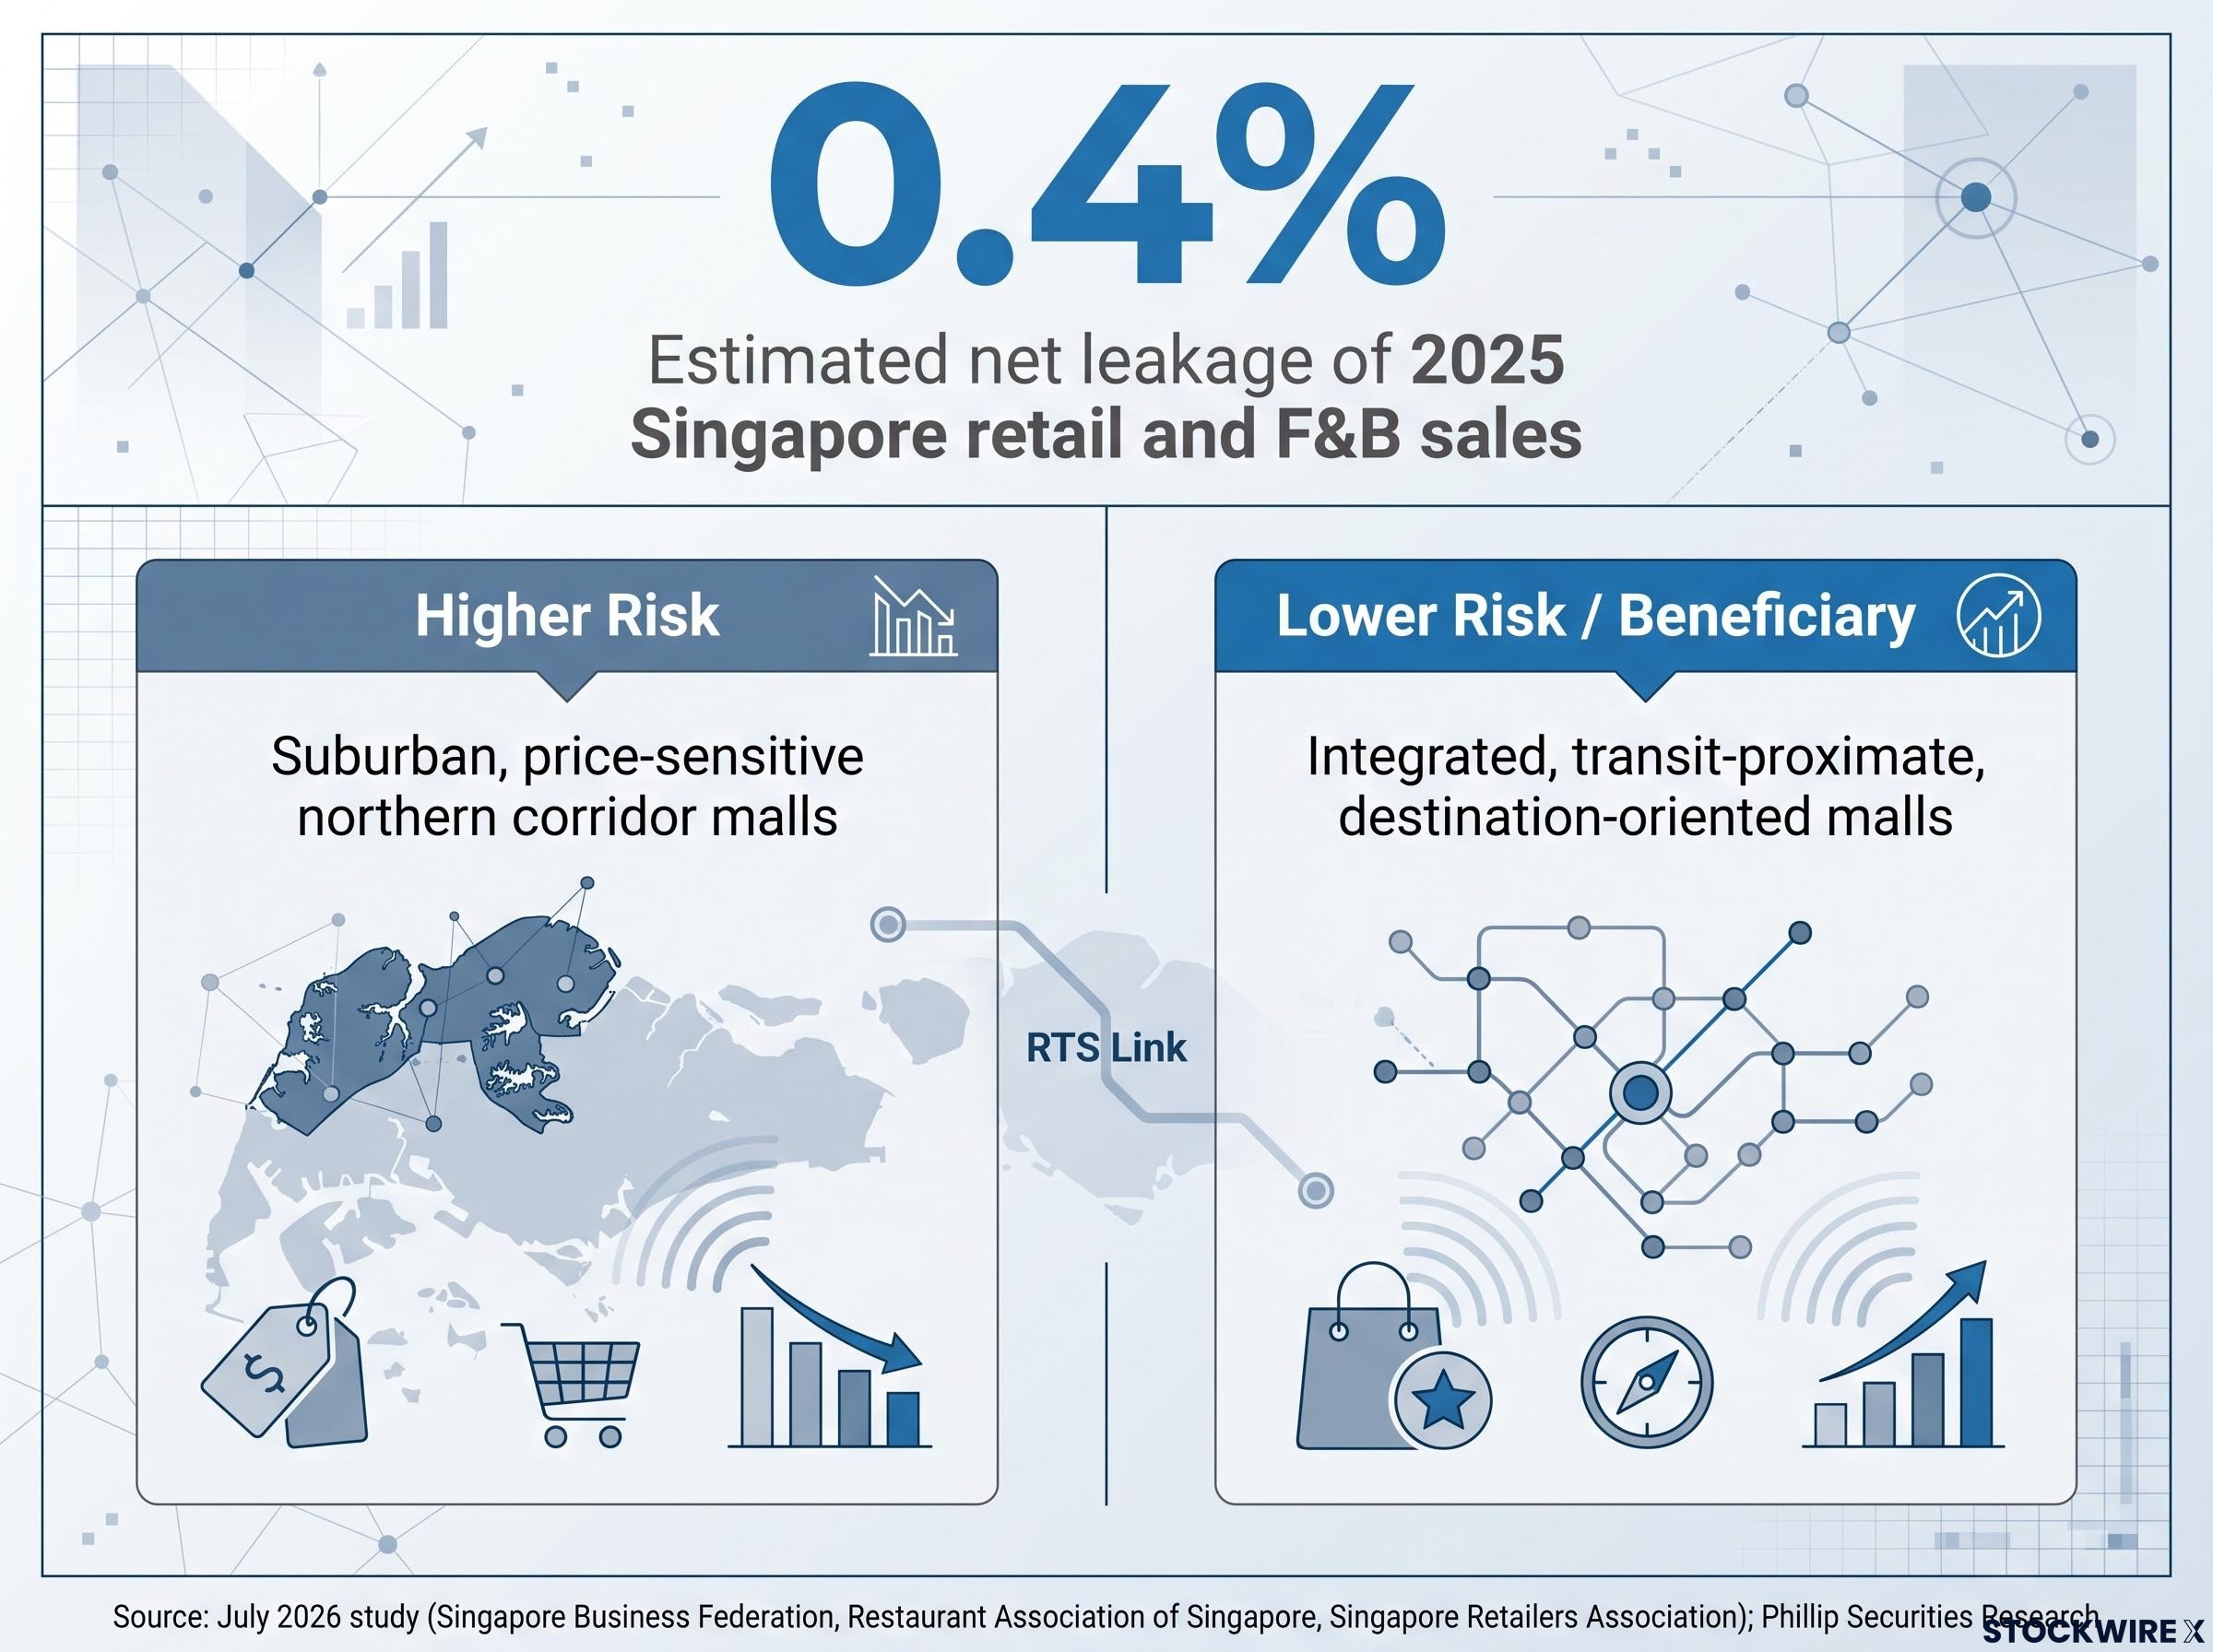
The 0.4% estimate is plausible for three reasons. First, travel friction remains non-trivial even with a high-frequency transit link; immigration clearance and practical limitations on carrying goods back tend to concentrate leakage in discretionary categories rather than day-to-day spending. Second, much of the price-seeking cross-border traffic already exists via road links, so incremental leakage comes from marginal new trips, not the entire stock of existing flows. Third, Singapore’s retail demand is structurally underpinned by a high-income resident base, tourism inflows, and destination malls whose draw is experiential rather than purely price-based. Global REIT research consistently finds that destination and experiential retail has been far more resilient than undifferentiated convenience formats.
The RTS Link also cuts in the other direction. It expands the catchment area for Singapore retail assets near RTS nodes or key interchange lines, potentially capturing incremental footfall from Johor residents visiting Singapore for work, services, and leisure.
Who carries the most exposure within retail REITs
The distinction matters at the asset level, not the sector level. Higher-risk profiles include suburban, price-sensitive malls in the northern corridor with tenant mixes tilted toward commoditised goods and basic food and beverage that can be substituted cross-border.
Lower-risk or potential beneficiary profiles belong to integrated, transit-proximate, destination-oriented malls. These assets can capture inbound Johor resident footfall and are less susceptible to pure price competition. For any given retail REIT, the question is not whether the RTS Link is coming. It is whether the trust’s specific assets sit on the exposed side or the beneficiary side of that line.
What S-REITs are, and why sub-sector mechanics matter
S-REITs are listed vehicles that pool real estate assets and distribute rental income to unitholders, regulated under Singapore’s REIT framework. The sub-sector categories you see in analyst reports (diversified, commercial, retail, industrial, hospitality) reflect the underlying asset types and geographic exposure of each trust. They are not just labels. They are the primary determinants of how each trust generates and distributes income.
The MAS Code on Collective Investment Schemes sets the regulatory framework governing how S-REITs are structured, operated, and required to distribute income, establishing the compliance boundaries within which sub-sector differences in asset type, geography, and capital structure play out.
Here is why that matters: the path from a building to your distribution payment runs through three variables, and each one transmits economic conditions differently.
- Geography: Where the assets sit determines which interest rate environment, currency regime, and tenant economy feeds the trust’s income. A trust with assets in Singapore faces different rate pressures than one with assets in Sydney or Frankfurt.
- Asset type: An industrial and logistics portfolio benefits from structural e-commerce and supply-chain demand. An office-heavy portfolio faces hybrid-work headwinds. The asset type shapes occupancy, rental growth, and cap-rate trajectory.
- Capital structure: How the trust funds itself, including what currency its debt is denominated in, whether that debt is hedged, and how much leverage it carries, determines how much of a rate move reaches distributable income.
The June 2026 divergence is these three variables in action. Same asset class, same month, same macro backdrop. A 9.5-percentage-point performance gap driven entirely by where the assets were, what they were, and how they were funded.
A practical framework for reading S-REIT exposure in the current environment
The June divergence and the RTS analysis point toward the same conclusion: evaluating S-REITs at the sector level does not provide sufficient resolution to make a reliable return or income call in 2026. The analytical task is disaggregation.
The following matrix consolidates the risk and opportunity dimensions that surfaced throughout the June data and the RTS research into a single evaluation tool.
| Dimension | Higher-risk profile | Lower-risk / opportunity profile |
|---|---|---|
| Geography | Heavy overseas exposure to rate-hiking markets (AU, EU, JP) | Primarily Singapore; robust FX and interest-rate hedging |
| Asset type | Office-heavy portfolios in unresolved hybrid-work markets | Diversified with industrial/logistics, necessity retail, experiential destinations |
| Capital structure | High leverage; large share of unhedged variable-rate foreign-currency debt | Moderate leverage; predominantly SGD or well-hedged; staggered maturities |
| RTS exposure (retail) | Undifferentiated convenience malls in northern corridor facing direct Johor price competition | Transit-proximate, destination-oriented assets capturing cross-border inbound traffic |
Apply this matrix to any S-REIT on your watchlist or in your portfolio. If a trust clusters in the left column across multiple dimensions, the structural headwinds are compounding. If it sits in the right column, the same environment that punished overseas commercial names in June is working in its favour.
For investors wanting to apply this framework to specific trusts on their watchlist, our dedicated guide to evaluating Singapore REITs covers the seven-part analytical process analysts use in 2026, including gearing thresholds, weighted average lease expiry, and interest coverage ratios.
The two central theses
Two conclusions carry forward from this analysis as interpretive tools:
- Sub-sector thesis: S-REIT outcomes in 2026 are being driven by where the assets are, what they are, and how they are funded. The sector label alone is not a sufficient analytical unit.
- RTS thesis: The RTS Link is an asset-selection issue, not a sector-collapse story. Whether the infrastructure change is a risk or a catalyst depends on which assets a trust holds and where they sit relative to the new transit corridor.
What the divergence changes, and what it does not
S-REITs remain a structurally important income and real-asset vehicle for investors with Singapore or regional exposure. The June divergence does not alter the fundamental case for the asset class.
What June clarified is that sub-sector selection and asset-level positioning now carry return consequences large enough to matter at the portfolio level, not just at the margin. A 9.5-percentage-point gap in a single month is not noise. It is the signal that the old approach of buying “S-REITs” as a category and expecting uniform outcomes no longer holds.
As long as rate divergence between Singapore’s stable domestic environment and the rate-hiking overseas markets persists, the structural conditions that drove June’s gap remain in place. The analytical resolution you bring to S-REIT exposure needs to match the dispersion the market is producing.
This article is for informational purposes only and should not be considered financial advice. Investors should conduct their own research and consult with financial professionals before making investment decisions. Past performance does not guarantee future results. Financial projections are subject to market conditions and various risk factors.