
The S-REIT sector is projected to deliver approximately 3% year-on-year distribution per unit (DPU) growth in FY2026, according to Phillip Securities’ 26 June 2026 coverage update. That headline number sounds uniform. It is not. In May 2026, AIMS APAC REIT rose 4.6% on the back of robust full-year results, while Acrophyte Hospitality Trust shed close to 20% following severe weather disruptions and a jump in operating costs. That is not noise inside a single asset class. That is two fundamentally different investments wearing the same label.
The rate environment of 2025-2026 has forced a reckoning with what actually sits beneath the S-REIT index. The S-REITs Index shed 1.6% in May 2026 as markets repriced for a higher-for-longer rate path, unwinding the 3.2% it had gained in April. Yet some names shrugged that headwind off entirely. The macro backdrop still matters, but it no longer explains individual outcomes.
The rate transmission channels connecting central bank policy to REIT valuations are bidirectional: the same mechanics that compress borrowing costs and lift distributable income in an easing cycle reverse sharply when a higher-for-longer path takes hold, which is precisely what repriced the S-REITs Index in May 2026.
Here is what this piece gives you: a clear map of where the income growth is actually coming from in 2026, which sub-sectors are structurally positioned to deliver it, and how Phillip Securities is translating that analysis into four specific BUY-rated names. You leave with a framework for evaluating S-REIT income potential yourself, not just a list of tickers to look up.
The three engines driving 3% DPU growth in 2026
For FY2026, Phillip Securities forecasts roughly 3% year-on-year DPU growth across the S-REITs it covers, underpinned by three structural engines rather than a single macro bet.
Not all of that 3% carries equal certainty. The three growth engines sit on a spectrum from locked-in to market-dependent, and knowing where each sits changes how much weight you place on the headline number.
- Contractual rent escalations (1-3% per annum): Built into existing lease agreements, this is the most reliable component. It flows regardless of market conditions as long as tenants remain solvent. This is the floor.
- Positive rental reversions (mid- to high-single-digit for retail): When leases expire and are renewed at higher rents, the upside can be material. But it depends on sub-sector supply-demand dynamics playing out as expected. This is the swing factor.
- Easing financing costs: Where REITs have locked in fixed-rate or hedged debt, more top-line revenue flows through to distributions rather than being absorbed by interest expense. Stoneweg European Stapled Trust, for instance, has locked in hedges covering around 87% of its debt until late 2027, keeping its projected FY2026 borrowing cost under 4%.
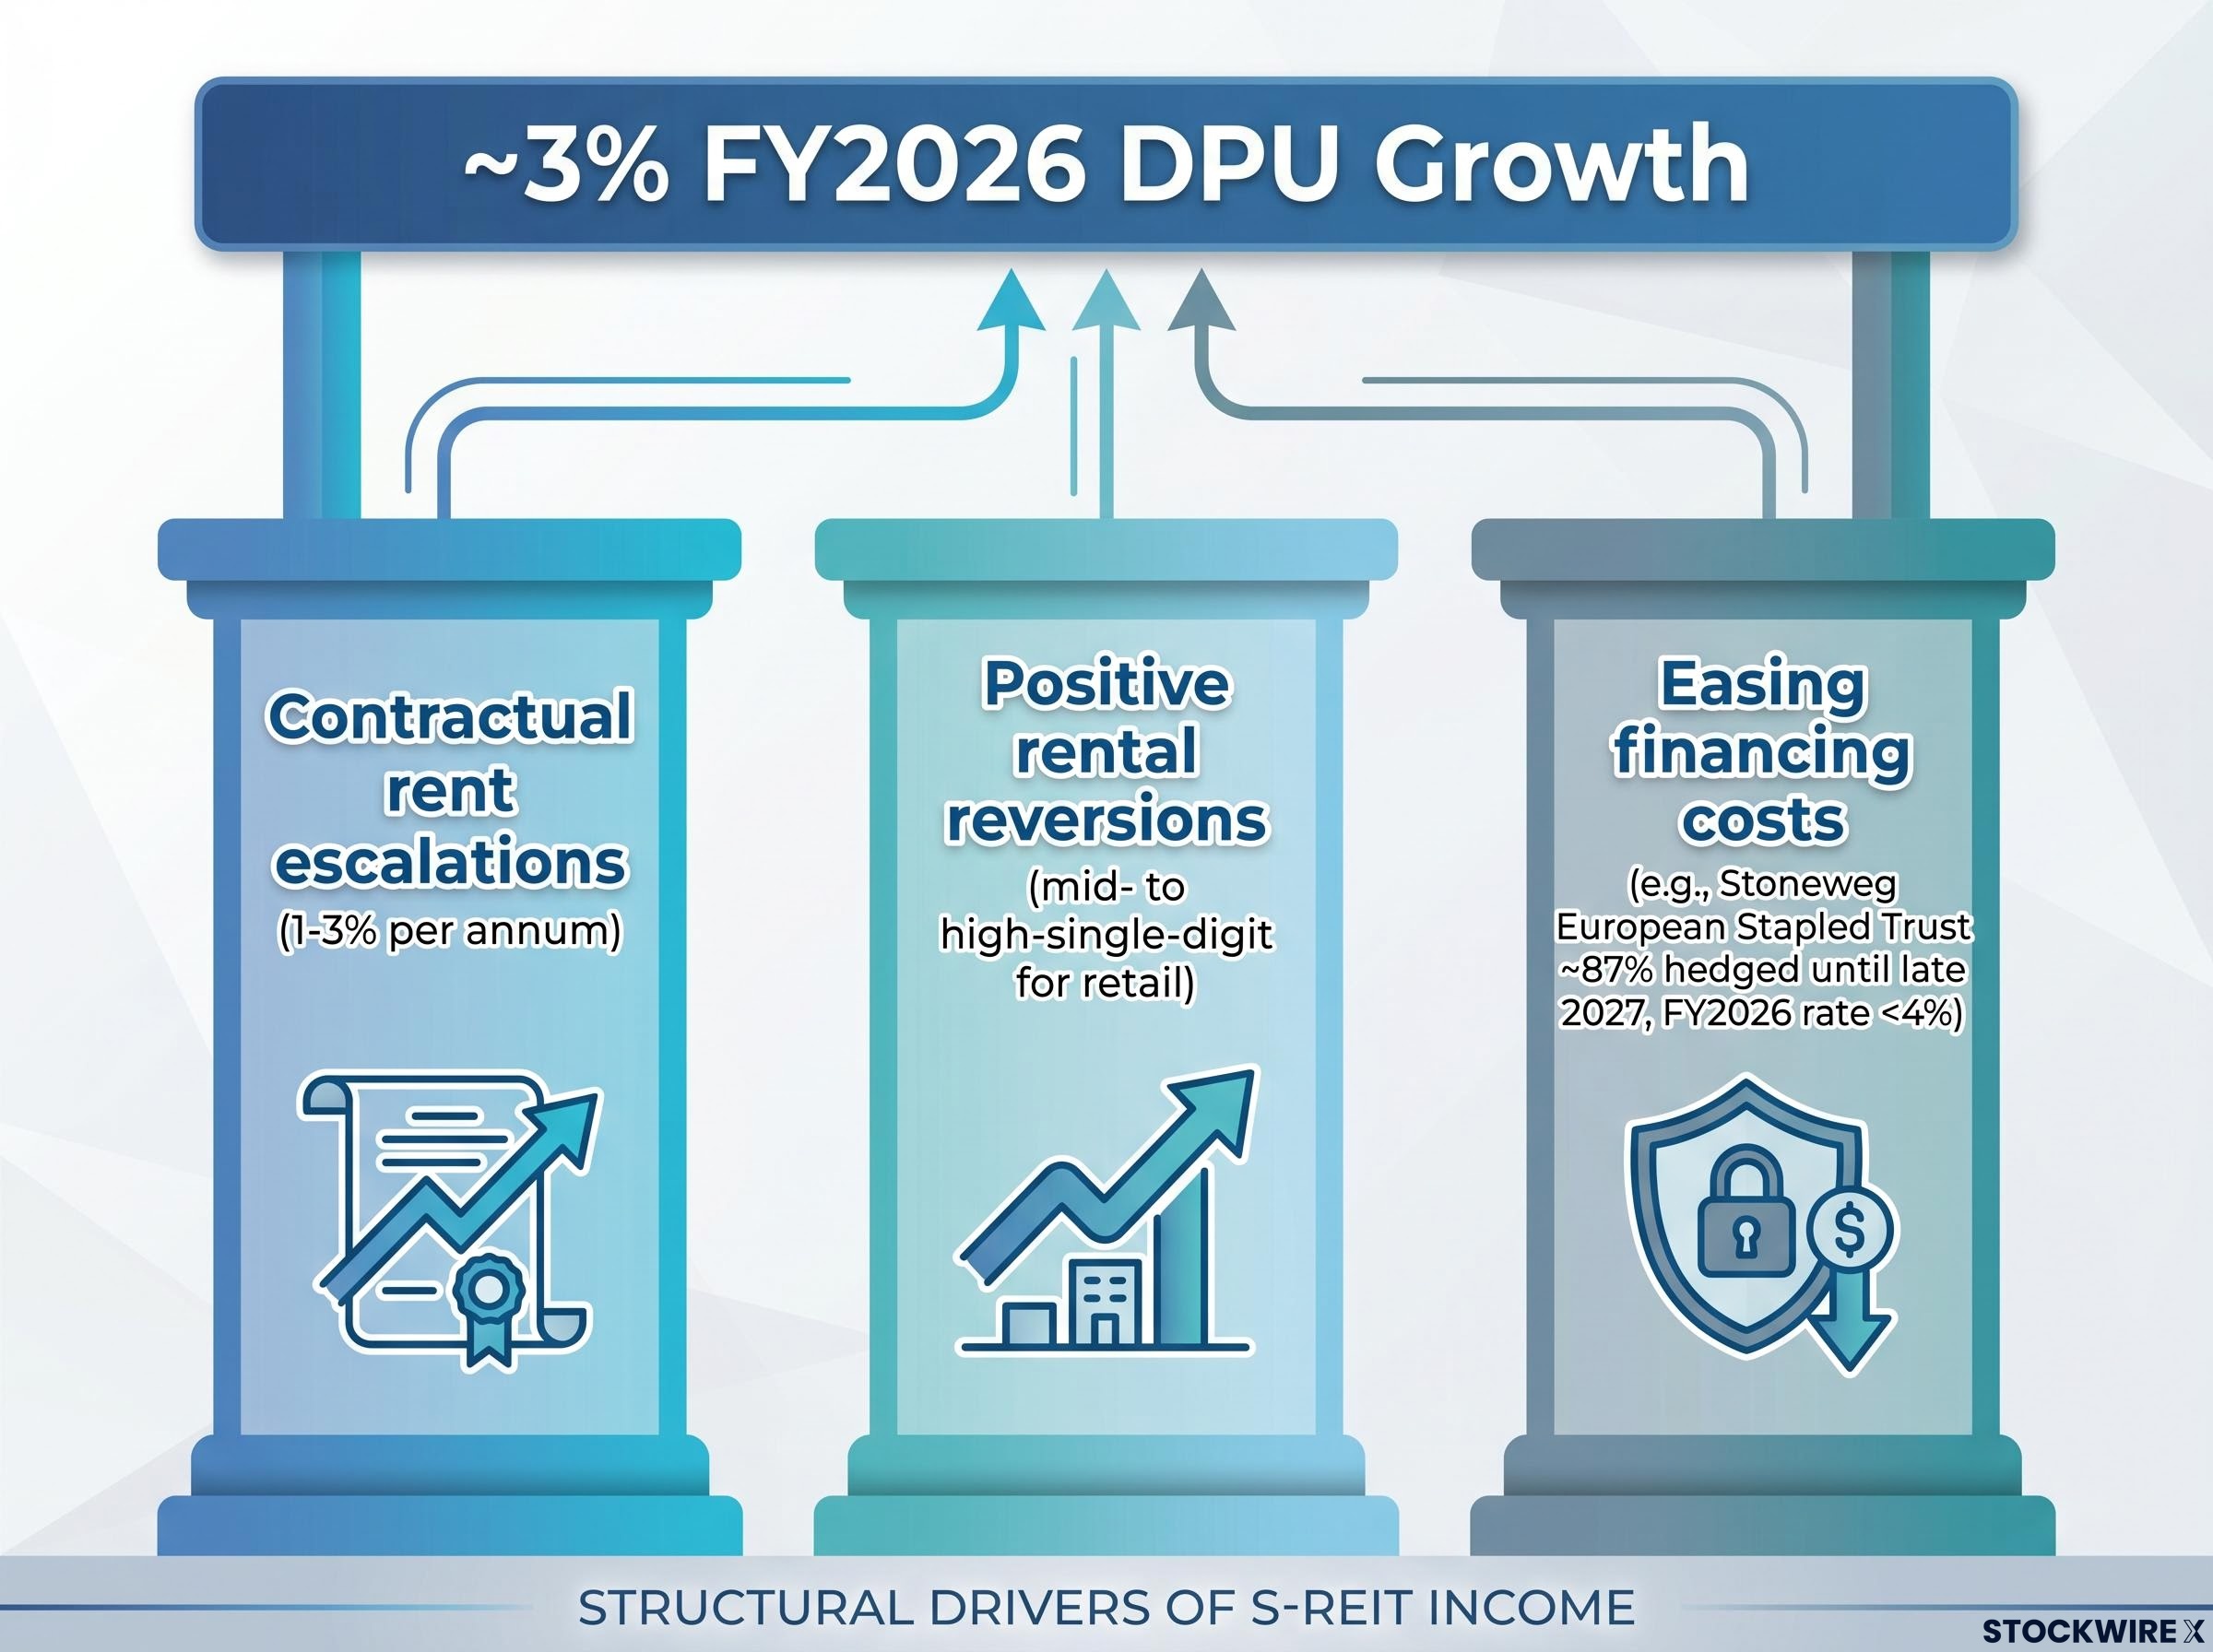
The growth is structural rather than speculative: it derives from lease terms and debt architecture, not a bet on rate cuts arriving on schedule. For income investors, the split between the locked-in contractual base and the market-sensitive reversion upside tells you how much of that 3% you can genuinely rely on versus how much depends on conditions cooperating.
When big ASX news breaks, our subscribers know first
What May 2026 dispersion data reveals about sub-sector risk
Start with the extremes. AIMS APAC REIT advanced 4.6% in May 2026, buoyed by its strong full-year numbers. Acrophyte Hospitality Trust lost close to 20% over the same period, as extreme weather conditions and elevated operating costs weighed heavily on its first-quarter performance. Same index, same rate environment, radically different outcomes.
Now zoom out to sub-sectors. Among all groupings, overseas retail alone managed to end the month in the green, notching a +0.3% return. Overseas commercial, heavily weighted to US office exposure, dropped -3.5%. That is a 3.8 percentage point spread between the best and worst sub-sectors in a single month.
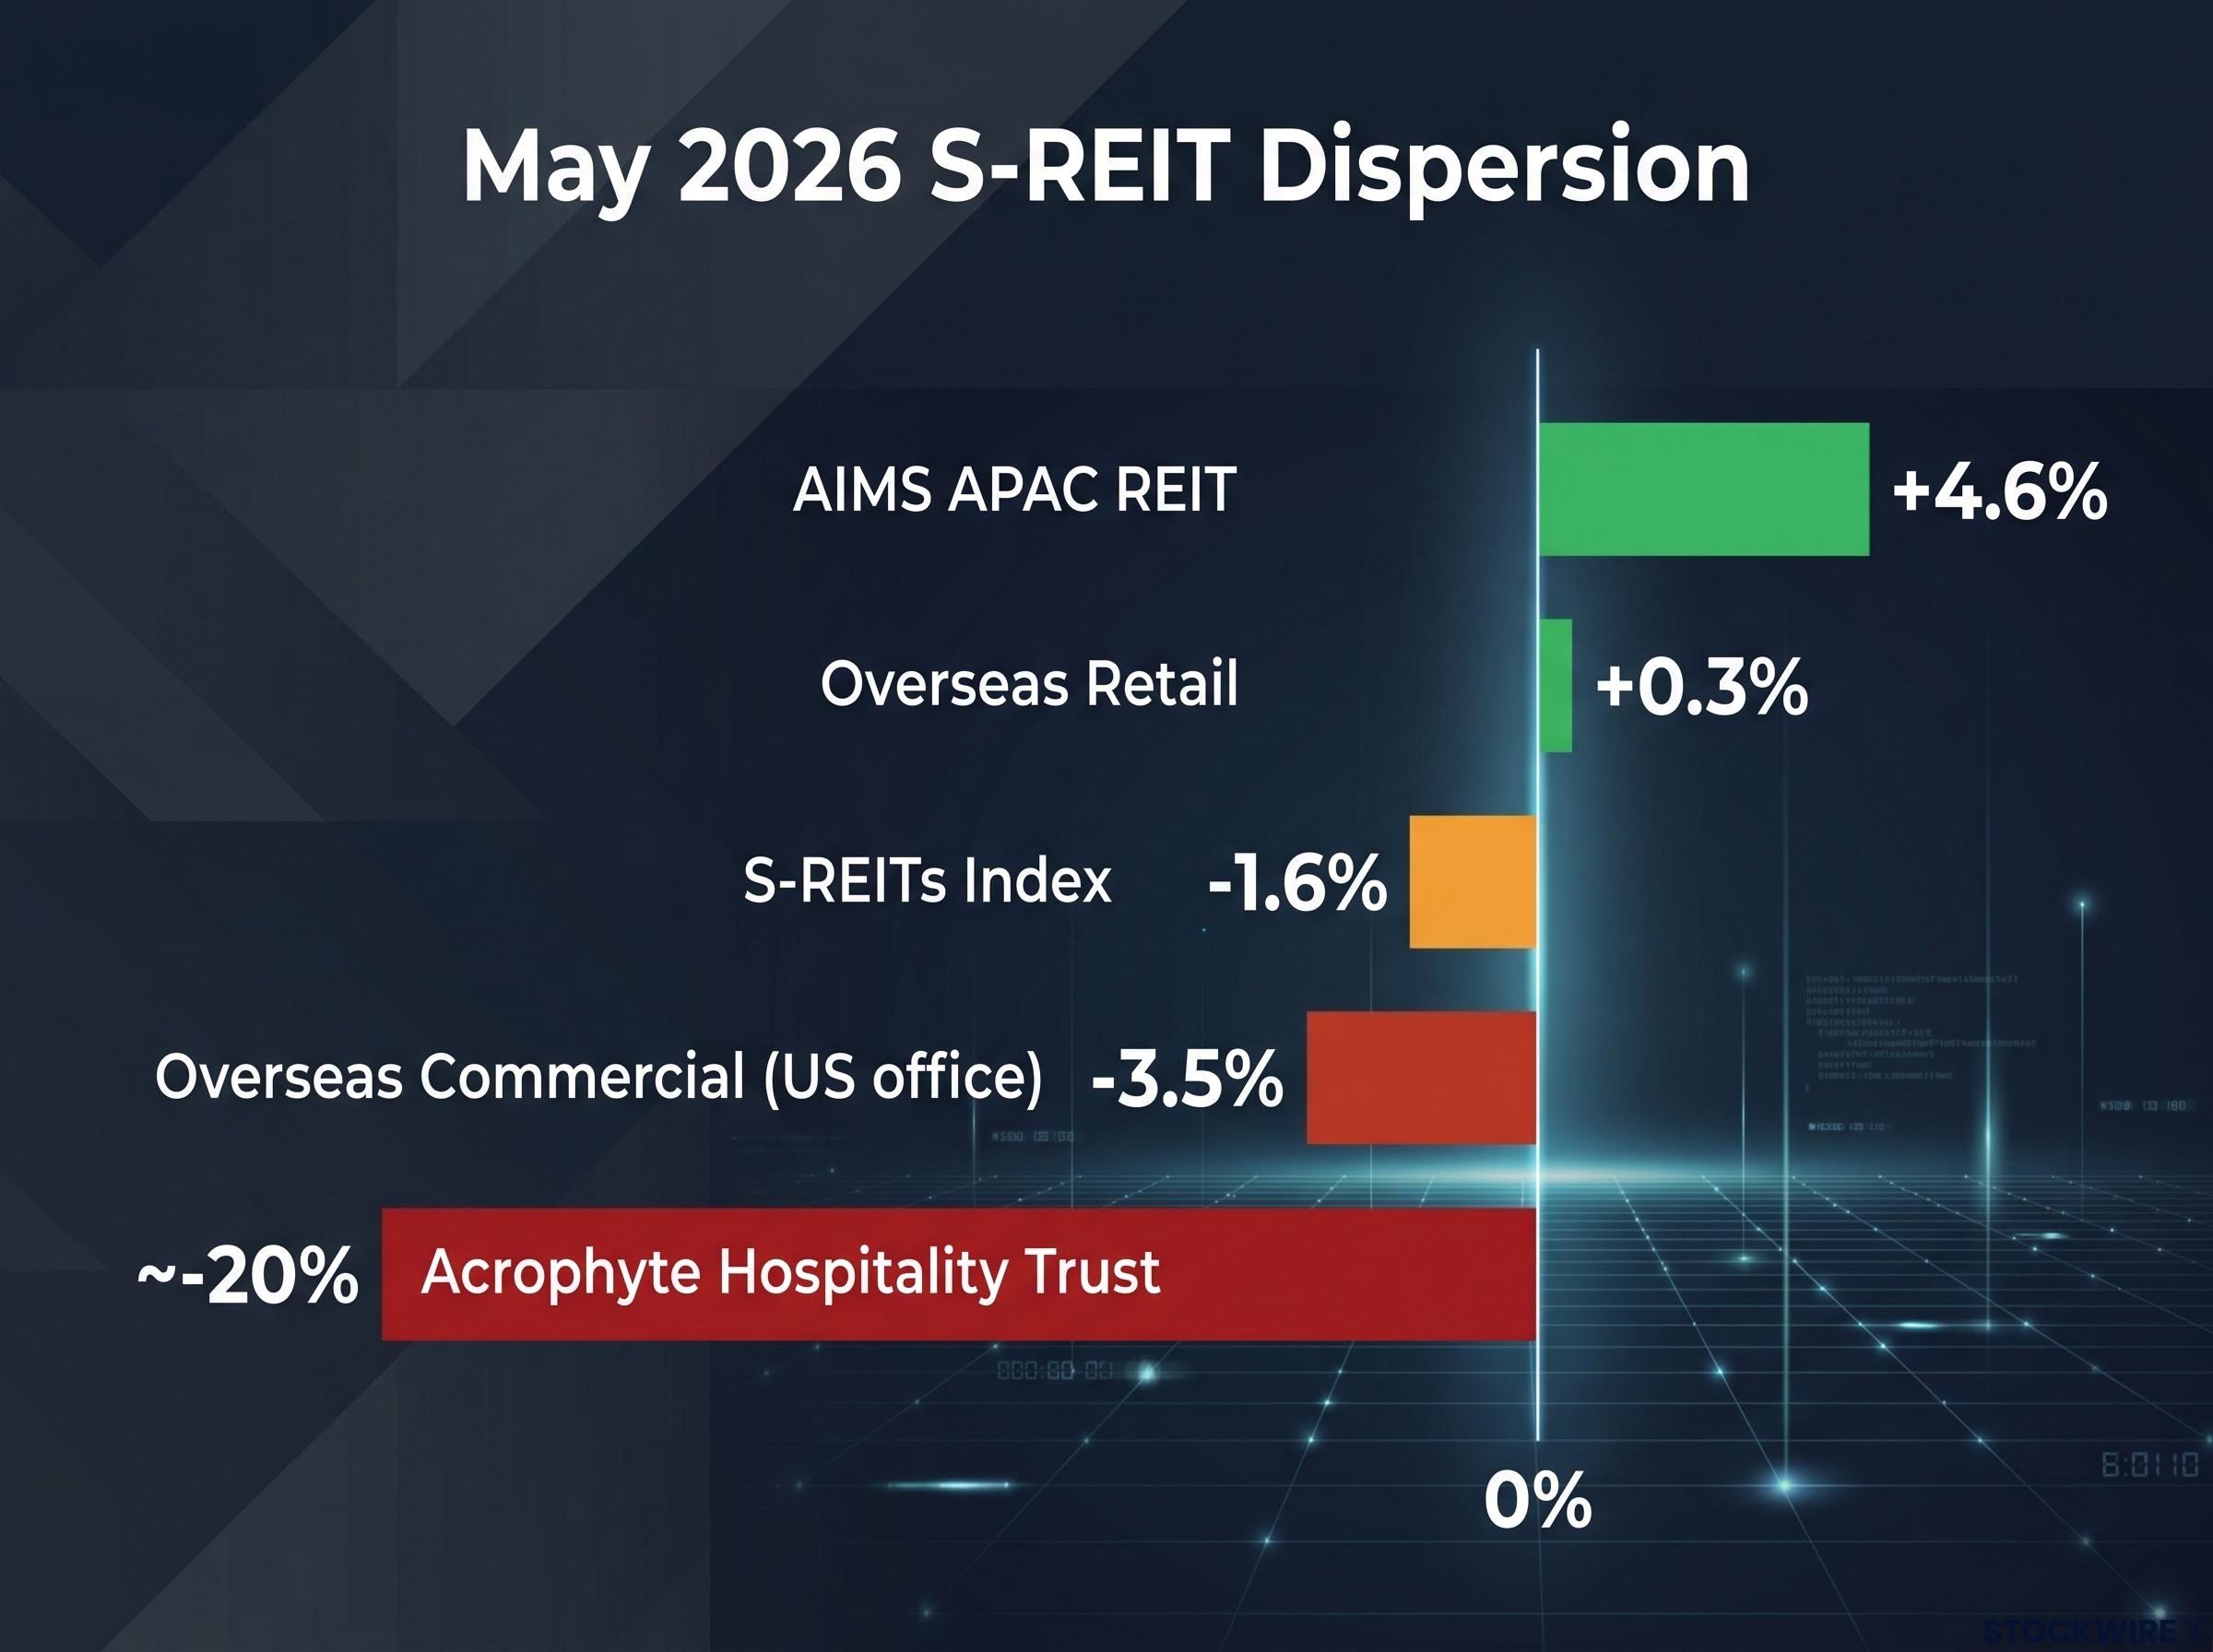
| Name / Sub-Sector | May 2026 Return | Primary Driver |
|---|---|---|
| S-REITs Index | -1.6% | Higher-for-longer rate expectations |
| AIMS APAC REIT | +4.6% | Strong FY2026 results |
| Acrophyte Hospitality Trust | ~-20% | Weather disruptions, higher operating costs |
| Overseas Retail | +0.3% | Constrained supply, positive reversions |
| Overseas Commercial (US office) | -3.5% | Rate sensitivity, structural oversupply |
That spread tells you something directly applicable to portfolio construction: treating S-REITs as a single asset class is a category error with real return consequences. The index conceals more than it reveals.
The relationship between rate cuts and REIT returns is less direct than the headline narrative suggests: sector dispersion in 2024 exceeded 34 percentage points even as the Fed delivered 100 basis points of easing, confirming that sub-sector and debt structure selection carry more explanatory power than the macro rate direction alone.
Why retail S-REITs are the structural standout in 2026
The bull case for retail starts on the supply side, not the demand side. Limited new retail space is coming to market, and that constraint gives existing landlords genuine pricing power when leases come up for renewal. It is the single most important factor behind above-average rental reversions, and it is not resolving quickly.
Three structural tailwinds reinforce the position:
- Constrained supply: A thin pipeline of new competing space means existing landlords set the terms at renewal. This is the foundation of mid- to high-single-digit reversion outcomes.
- Healthy tenant sales: Tenants are generating enough revenue to absorb higher rents without triggering vacancy spikes. That sustains both the magnitude of achievable reversions and occupancy rates.
- Supportive lease structures: Multi-year leases with embedded escalation clauses lock in a large portion of near-term income regardless of spot market conditions, reducing distribution volatility.
United Hampshire US REIT illustrates the thesis in practice: its grocery-anchored, necessity-based positioning means its tenant demand is structurally more resilient than discretionary retail or office exposure. When supply is constrained and tenants can absorb higher rents, the reversion component of DPU growth shifts from a forecast to a high-probability outcome. That changes how you should weight it in your income projections.
Retail was the only positive-performing sub-sector in May 2026. That is not cyclical catch-up. It is a structural advantage playing out in real time.
Sub-sector structural rankings across the S-REIT universe place industrial and logistics assets alongside retail in the strongest positions for 2026, with data centre REITs gaining from AI-driven power demand while office and non-prime retail face headwinds that are unlikely to resolve within the current rate cycle.
Phillip Securities’ four BUY picks and what they have in common
Phillip Securities has assigned BUY ratings to four S-REITs as of 26 June 2026. Each name addresses a different segment, but the selection logic is consistent.
| REIT Name | Rating | Target Price | Key Investment Thesis |
|---|---|---|---|
| Stoneweg European Stapled Trust | BUY | €1.89 | 8.6% yield, ~87% debt hedged through late 2027, ~25% NAV discount |
| Elite UK REIT | BUY | £0.41 | UK commercial diversification at undemanding valuation |
| United Hampshire US REIT | BUY | US$0.69 | Grocery-anchored US retail, defensive cash flow profile |
| Prime US REIT | BUY | US$0.32 | Deep-discount valuation bet on distressed US office pricing |
Stoneweg European Stapled Trust carries a dividend yield of 8.6% and has hedged roughly 87% of its borrowings through to late 2027, with its FY2026 cost of debt forecast to remain under 4%. The trust currently trades at a discount of around 25% to net asset value (NAV), the book value of a REIT’s underlying properties minus its liabilities.
One distinction matters here. Prime US REIT is not the same kind of recommendation as the other three. It carries US office exposure, a structurally challenged segment, and the BUY case is explicitly valuation-driven: a deeply discounted bet that current pricing already embeds significant stress. The risk profile differs materially from the rest of the group.
The common threads across all four picks
Strip away the individual names and a repeatable framework emerges. All four share overseas geographic diversification away from Singapore. All are exposed to segments with visible demand, whether through necessity-driven retail tenants, government-backed UK commercial leases, or distressed pricing that compensates for structural headwinds. All offer substantial dividend yield. And three of the four are structured around explicit protection mechanisms: interest-rate hedging, NAV discount, or resilient tenant composition.
S-REIT quality evaluation frameworks consistently flag debt structure as the most durable differentiator of income resilience, a finding that aligns with why Phillip Securities weighs hedging coverage so heavily across its four BUY-rated names.
The fact that three of the four picks are built around protection tells you that Phillip Securities is not making a broad bull-market call on S-REITs. It is selecting names that can deliver income even if macro conditions deteriorate further. That is a defensive posture disguised as a buy list.
A five-point framework for evaluating S-REIT income potential
The Phillip Securities analysis implies a practical checklist you can apply to any S-REIT you are considering. The order reflects priority, not equivalence.
- Start with debt structure and hedging. What percentage of debt is fixed or hedged, and through what date? Stoneweg’s approximately 87% hedging coverage through late 2027 is the benchmark for what robust protection looks like. If a REIT cannot tell you its hedging profile clearly, that is your first warning sign.
The MAS guidelines for REIT managers establish the licensing criteria and corporate governance standards that S-REIT management teams must meet, including requirements around debt management and distribution policies that underpin the structural protections investors assess when comparing names across sub-sectors.
- Separate contractual from market-driven growth. Contractual rent escalations of 1-3% per annum are the lockable base-case floor. Rental reversions of mid- to high-single-digit percentages are the cyclical swing factor. Know which portion of projected DPU growth falls into each category before you buy.
- Prioritise sub-sector positioning over broad sector exposure. Overseas retail returned +0.3% in May 2026. Overseas commercial returned -3.5%. Favour retail (especially necessity-based and constrained-supply markets) and select industrial or logistics where applicable. Be cautious with US office and hospitality.
- Interrogate large discounts to NAV. A 25% or greater discount can signal opportunity or distress. Cross-check with income coverage, distribution track record, asset quality and tenant strength, and debt maturity profile before treating the discount as a buying signal.
- Align yield with your actual risk tolerance. Higher headline yields in hospitality and US office come with materially higher volatility.
Acrophyte Hospitality Trust recorded a drop of close to 20% across a single month. That kind of drawdown is the concrete cost of chasing yield without accounting for event risk.
A checklist like this forces you to confront what you actually know about the S-REITs you hold or are considering. Most investors will find gaps, and that is precisely the point.
Where the S-REIT income opportunity sits in the second half of 2026
The picture for the second half of 2026 is clear enough to act on, provided you are selective. Approximately 3% DPU growth at the sector level is modest but improving, and meaningful outperformance is available to investors who position correctly within the index rather than buying the index itself.
The favoured and challenged segments break down cleanly:
- Favour: Retail (particularly overseas and necessity-based, where constrained supply supports rental reversions), select industrial and logistics exposures.
- Avoid or underweight: US office (structurally oversupplied, rate-sensitive), hospitality (event-risk-exposed, as May 2026 demonstrated).
Stoneweg’s debt hedging structure, with roughly 87% of borrowings covered through to late 2027 and a borrowing cost forecast to stay under 4%, illustrates what protection-first income investing looks like in practice. That combination of yield, hedging coverage, and NAV discount is the template Phillip Securities is applying across its coverage.
The practical conclusion is that the S-REIT income opportunity in the second half of 2026 is not about sector exposure. It is about being in the right sub-sectors with the right structural protections. That is a selection problem, not a timing problem. The investors who will extract the most income are those who do the sub-sector and hedging work rather than buying the sector broadly and hoping the 3% headline delivers uniformly.
This article is for informational purposes only and should not be considered financial advice. Investors should conduct their own research and consult with financial professionals before making investment decisions. Past performance does not guarantee future results. Financial projections are subject to market conditions and various risk factors.