Picture a $10,000 investment made in 1977, quietly forgotten in a portfolio for nearly half a century. Today, that single position throws off more than $120,000 every year in dividend income alone. Not from selling anything. Just from the cash the company mails out.
The company is McDonald’s, which most people associate with fries and drive-throughs, not one of the more remarkable income transformations in market history.
Here is the part that matters for you: this is not a story about picking a winner. It is a story about one mathematical principle, annual dividend growth, working relentlessly across 49 years.
Most investors size up a dividend stock by looking at its current yield. That number tells you what a stock pays today, and almost nothing about what it will pay you in decades to come. The variable that actually decides that outcome, the annual dividend growth rate, gets far less attention than it deserves.
After reading this, you will know how to evaluate a dividend stock not by what it pays today but by what it is likely to pay in ten, twenty, or thirty years. That distinction changes which stocks genuinely belong in a long-term portfolio, and why.
What yield on cost actually means, and why it rewrites how you think about dividend income
You probably think of dividend value the way most people do: as current yield, the annual dividend divided by the current share price. A stock trading at $100 that pays $3 a year yields 3%. Simple.
Those dividend yield limitations become most visible at the extremes: a surging yield number can reflect a collapsing share price rather than a generous company, which is precisely why current yield works as a first filter but not a final verdict on any income stock.
Yield on cost works differently, and once you see it, current yield starts to look like a snapshot of a single day.
Yield on cost is the current annual dividend divided by the price you originally paid, not the price the stock trades at now. That distinction is everything for a long-term holder, because your cost never changes but the dividend keeps rising.
Say you buy a stock at $50 paying $1 a year. Your current yield is 2%. If that dividend grows to $12 over 30 years, your yield on cost is 24%, and it stays 24% no matter what the share price does. You are earning 24% a year on the money you originally put in.
The catch, and it is a productive one, is that yield on cost is time-dependent. On day one it is identical to current yield and looks unremarkable. It only becomes the dominant financial reality after decades of compounding have done their work.
Here is what that looks like with real numbers. Take $10,000 producing $1,000 a year, a 10% starting yield, growing at 7.5% annually. Over 40 years that income climbs to roughly $18,000 per year, a yield on cost of 180% on your original capital.
$1,000 of initial annual income growing at 7.5% annually becomes approximately $18,000 per year over 40 years.
No new money added. No trading skill required beyond holding. No market timing. Only patience and a dividend that keeps rising.
The table below shows how a $10,000 investment’s annual income diverges at two growth rates, a modest 3% and a stronger 7.5%. The gap is barely visible early and enormous late.
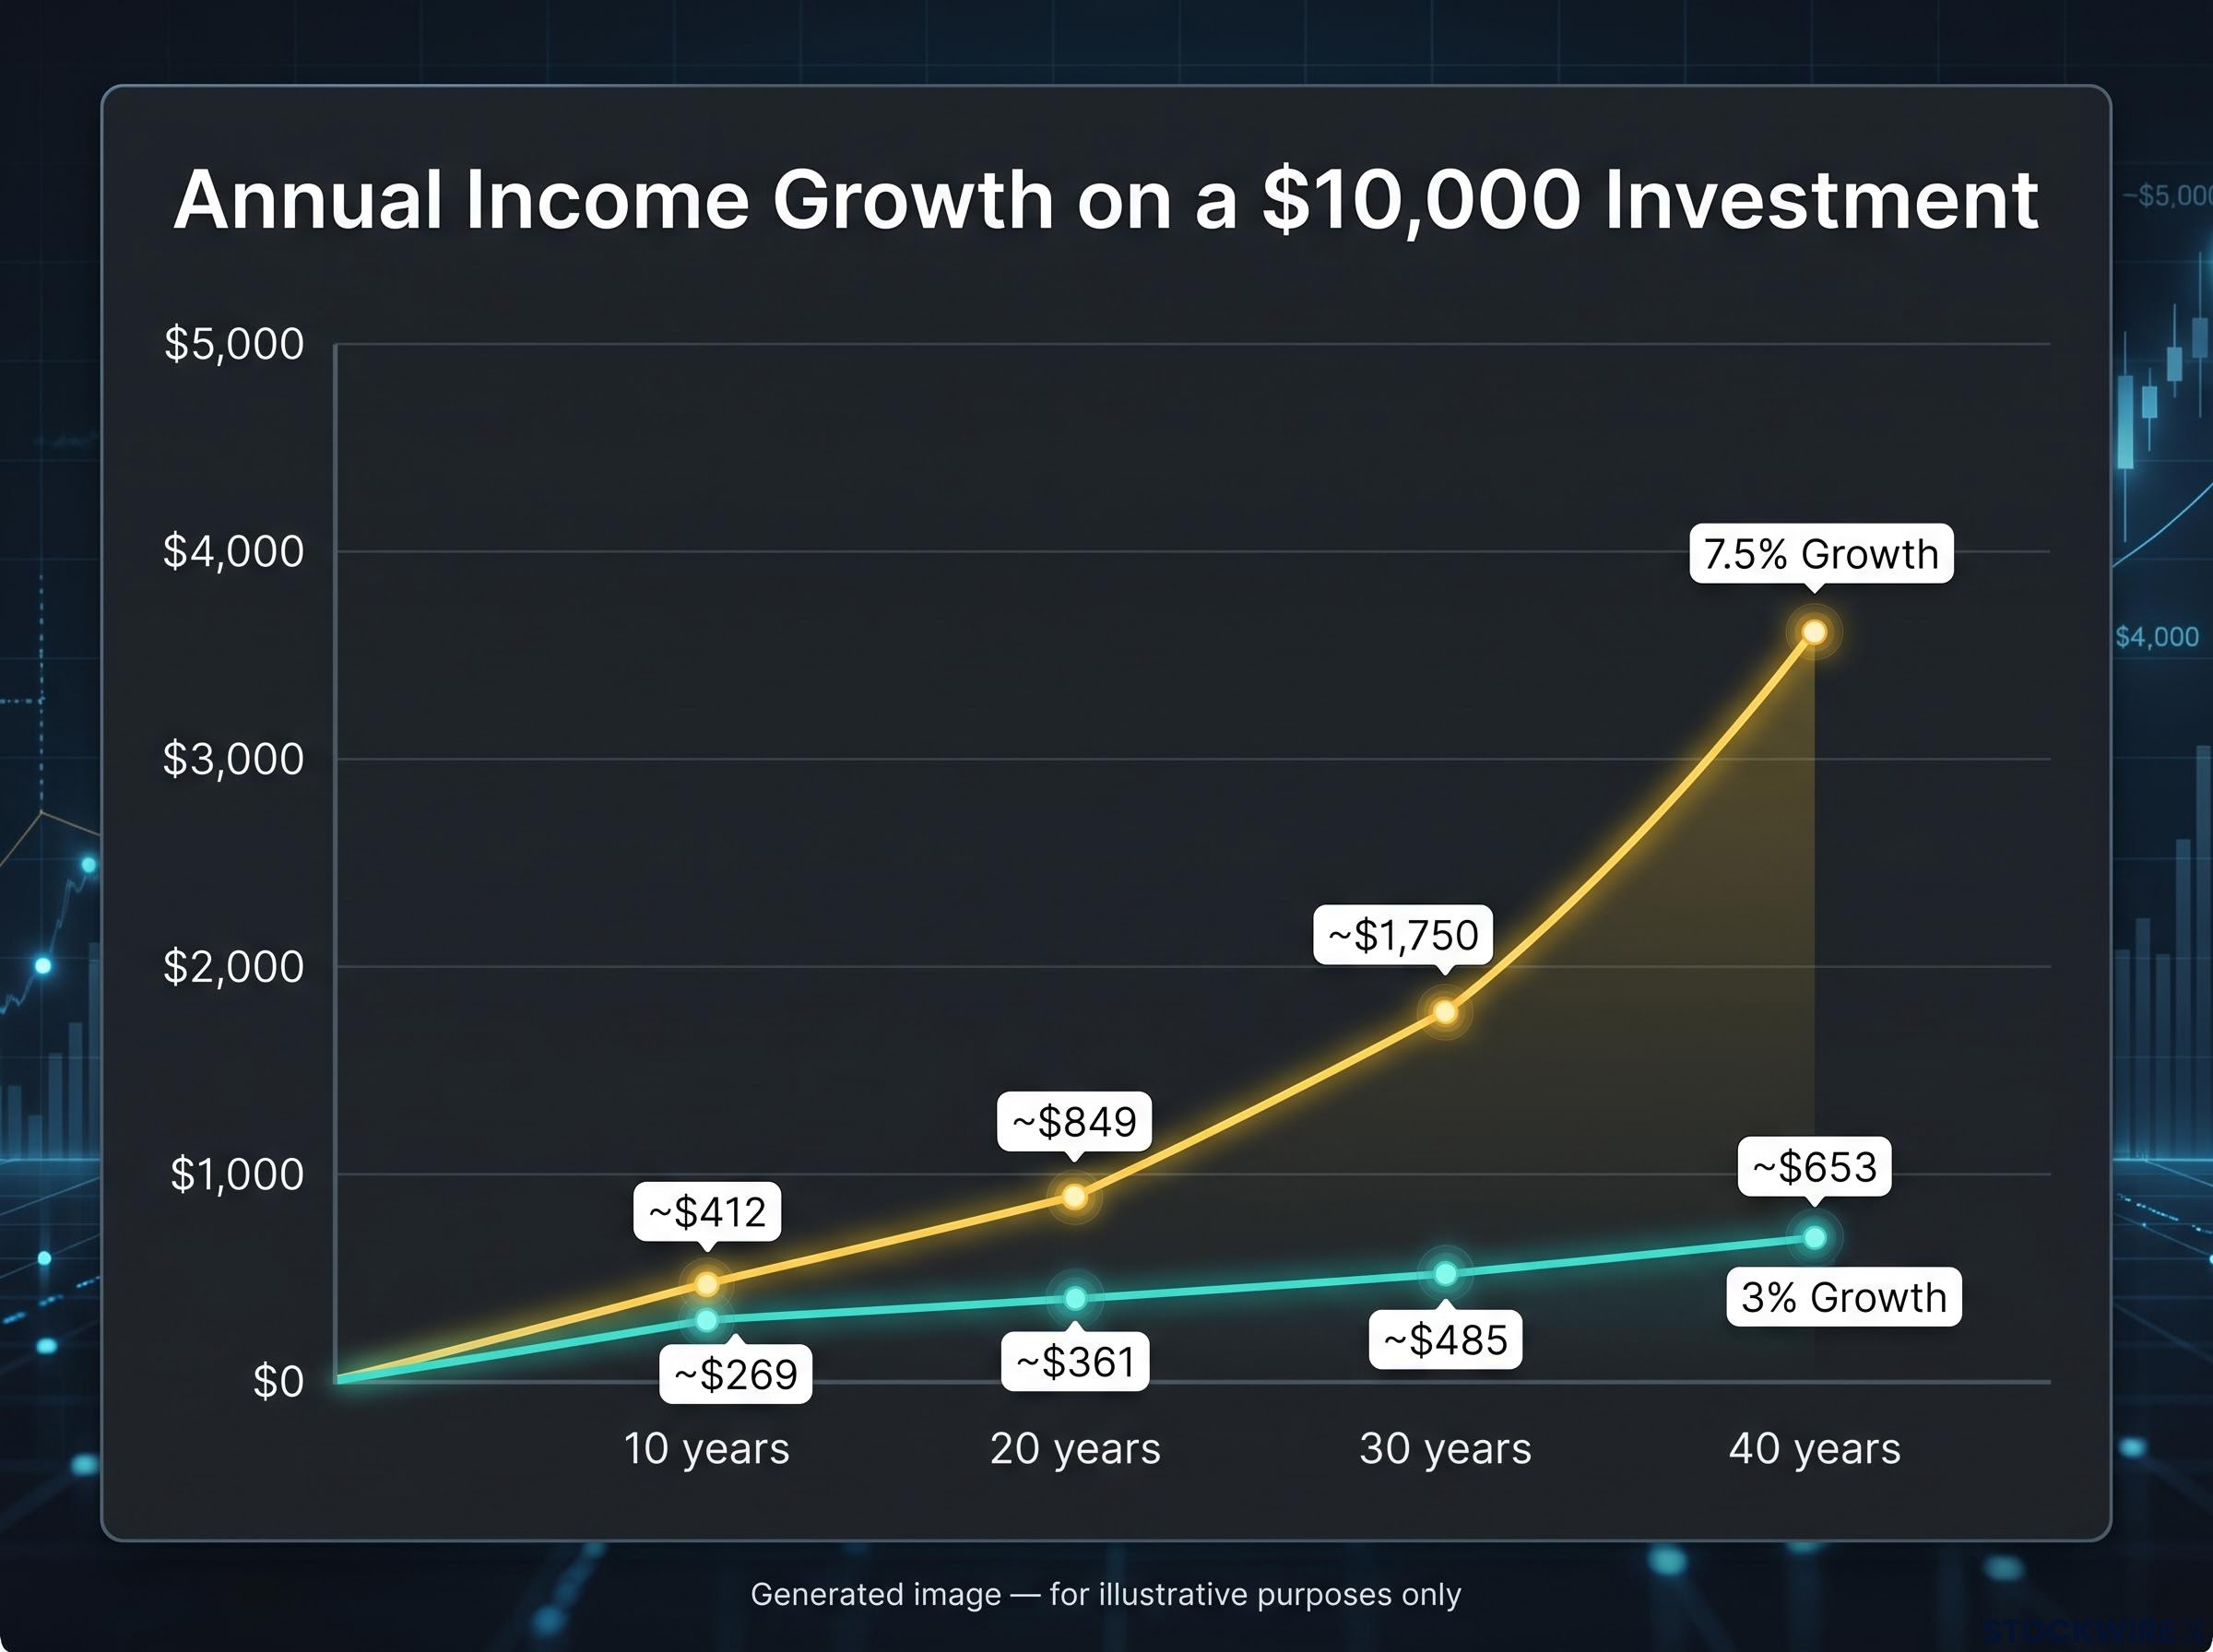
| Years Held | Annual Income at 3% Growth | Annual Income at 7.5% Growth |
|---|---|---|
| 10 years | ~$269 | ~$412 |
| 20 years | ~$361 | ~$849 |
| 30 years | ~$485 | ~$1,750 |
| 40 years | ~$653 | ~$3,600 |
This reframes your entire job as a dividend investor. It stops being about finding the highest-paying stock today and becomes about identifying the company most likely to keep raising its dividend reliably for the next two or three decades.
When big ASX news breaks, our subscribers know first
The McDonald’s case study: 49 years of compounding in numbers
Rewind to 1977. McDonald’s was still a growth company, expanding aggressively across North America and beyond, and it began paying a dividend that yielded roughly 0.2%. Most income-focused investors would have glanced at that figure and moved on. Two-tenths of one percent is not income; it is a rounding error.
That first dividend increase in the streak came in at around 126%, a signal of how much room a young, fast-growing business had to keep raising payouts. From there the increases stacked, year after year, without interruption.
Over the full stretch, McDonald’s raised its dividend at an average annual rate of 18.5% for 49 consecutive years. Compounding at that pace is mathematically verifiable and, at the same time, difficult for the mind to properly grasp.
Now the present-day outcome. That hypothetical $10,000 invested at the start of the streak, generating about $20 in its first year, is estimated to throw off more than $120,000 per year in dividends today. That is a yield on cost of roughly 1,200% on the original stake.
A $10,000 investment in 1977 now generates an estimated $120,000 or more annually in dividend income alone.
Here are the anchor points of the McDonald’s dividend story:
- 1977: dividend growth streak begins
- Initial yield: approximately 0.2%
- Current annual dividend: $7.44 per share, following a 5% increase declared on 22 October 2025
- Current yield: approximately 2.9%
- 49-year average annual growth rate: 18.5%
- Estimated yield on cost today: approximately 1,200%
Whether you reinvested mattered enormously. With dividends reinvested, that original $10,000 is estimated to have grown to roughly 950 times the initial amount. Without reinvesting, but collecting every dividend along the way, the cumulative return still reaches approximately 433 times the original investment.
McDonald’s is not a stock recommendation here. It is a proof of concept, a real and auditable reference point that turns the abstract mechanics of yield on cost into something you can actually check.
Where McDonald’s dividend growth stands today
The pace has cooled, and that is worth understanding rather than fearing. McDonald’s 5-year annualised dividend growth rate now sits at 7.3%, with the 10-year rate at approximately 7.6%, a mild deceleration from the extraordinary historical average.
That is not a failure. It is maturation. A company cannot compound dividends at 18.5% forever once it has saturated much of its market, and slowing to a still-consistent 7% range is exactly what a healthy, ageing business looks like.
McDonald’s also has not yet crossed the 50-year threshold that defines a Dividend King, a company with half a century of consecutive increases. Standing at 49 years, it is one year short, with 2026 or 2027 the likely milestone if the streak holds.
The Dividend Kings threshold, fifty consecutive years of unbroken payout increases, represents a structurally different order of corporate endurance from the better-known Aristocrat classification, and the distinction matters when assessing whether a company like McDonald’s, sitting at 49 years, is already demonstrating King-level discipline.
For you as a long-term holder, the read is straightforward: even at 7.3%, dividend growth remains comfortably above inflation, which means the real purchasing power of your income keeps rising rather than eroding.
Fast growers versus steady compounders: what the numbers reveal about different dividend strategies
Two investor profiles pull in opposite directions here, and the tension is real. One favours the mature, dependable payer with a healthy starting yield. The other chases the low-yield company raising its dividend at a blistering pace. Most people instinctively side with the higher yield today, and the projected numbers should give them pause.
Consider the slow-and-steady grower first: a moderate yield of 3-4%, dividend growth of 7-8% annually, typically a large consumer or industrial name. McDonald’s, at 7.3%, fits this camp neatly.
Then the high-growth initiator: a low starting yield of 1-2%, but dividend growth of 15-20% a year. Imperial Oil falls here, with a 10-year dividend growth rate of roughly 19%.
Between them sits Canadian National Railway, with a 10-year dividend compound annual growth rate of 11.0% and 29 consecutive years of increases, per Finspry’s dividend history data dated 30 July 2026. It is the middle ground made visible.
| Company | Current/Recent Yield | 10-Year Dividend Growth Rate | Consecutive Increase Years | Projected Yield on Cost (10 more years) |
|---|---|---|---|---|
| McDonald’s | ~2.9% | ~7.6% | 49 years | See closing projection |
| Canadian National Railway | Not retrieved | 11.0% | 29 years | ~21.5% |
| Imperial Oil | Not retrieved | ~19% | Not retrieved | ~11% |
Look closely at those projected yield-on-cost figures and something counterintuitive emerges. Imperial Oil grows its dividend fastest, yet its projected yield on cost of roughly 11% trails Canadian National Railway’s 21.5%. Starting yield and the sustainability of the rate both matter, not growth alone.
Here is how the trade-offs break down:
- Slow-and-steady growers (3-4% yield, 7-8% growth): high sustainability, lower risk of a cut, predictable income. The ceiling on long-term yield on cost is lower, and the starting yield may not satisfy an income-hungry investor.
- High-growth initiators (1-2% yield, 15-20% growth): explosive yield-on-cost potential if the pace holds. The catch is uncertainty, because very high growth rarely lasts, and low starting income is awkward if you need cash flow soon.
The data tells you high growth rates produce dramatically better long-term income, but only if sustained. Your real decision point is not which profile wins in the abstract. It is whether you believe a given company’s business model can support its growth rate through a full economic cycle, and whether your time horizon makes that ceiling relevant at all.
Why past dividend growth rates can mislead: the risks of projecting forward
After two sections of compelling compounding math, a dose of scepticism is not just fair, it is necessary. Projecting any historical dividend growth rate straight into the future is among the most common errors in dividend investing, and the reasons are structural rather than incidental.
McDonald’s is its own cautionary example. Its growth moderated from an 18.5% historical average to 7.3% over the past five years, a natural consequence of a maturing business. Nobody did anything wrong; the math simply cannot hold at that pace once a company grows large.
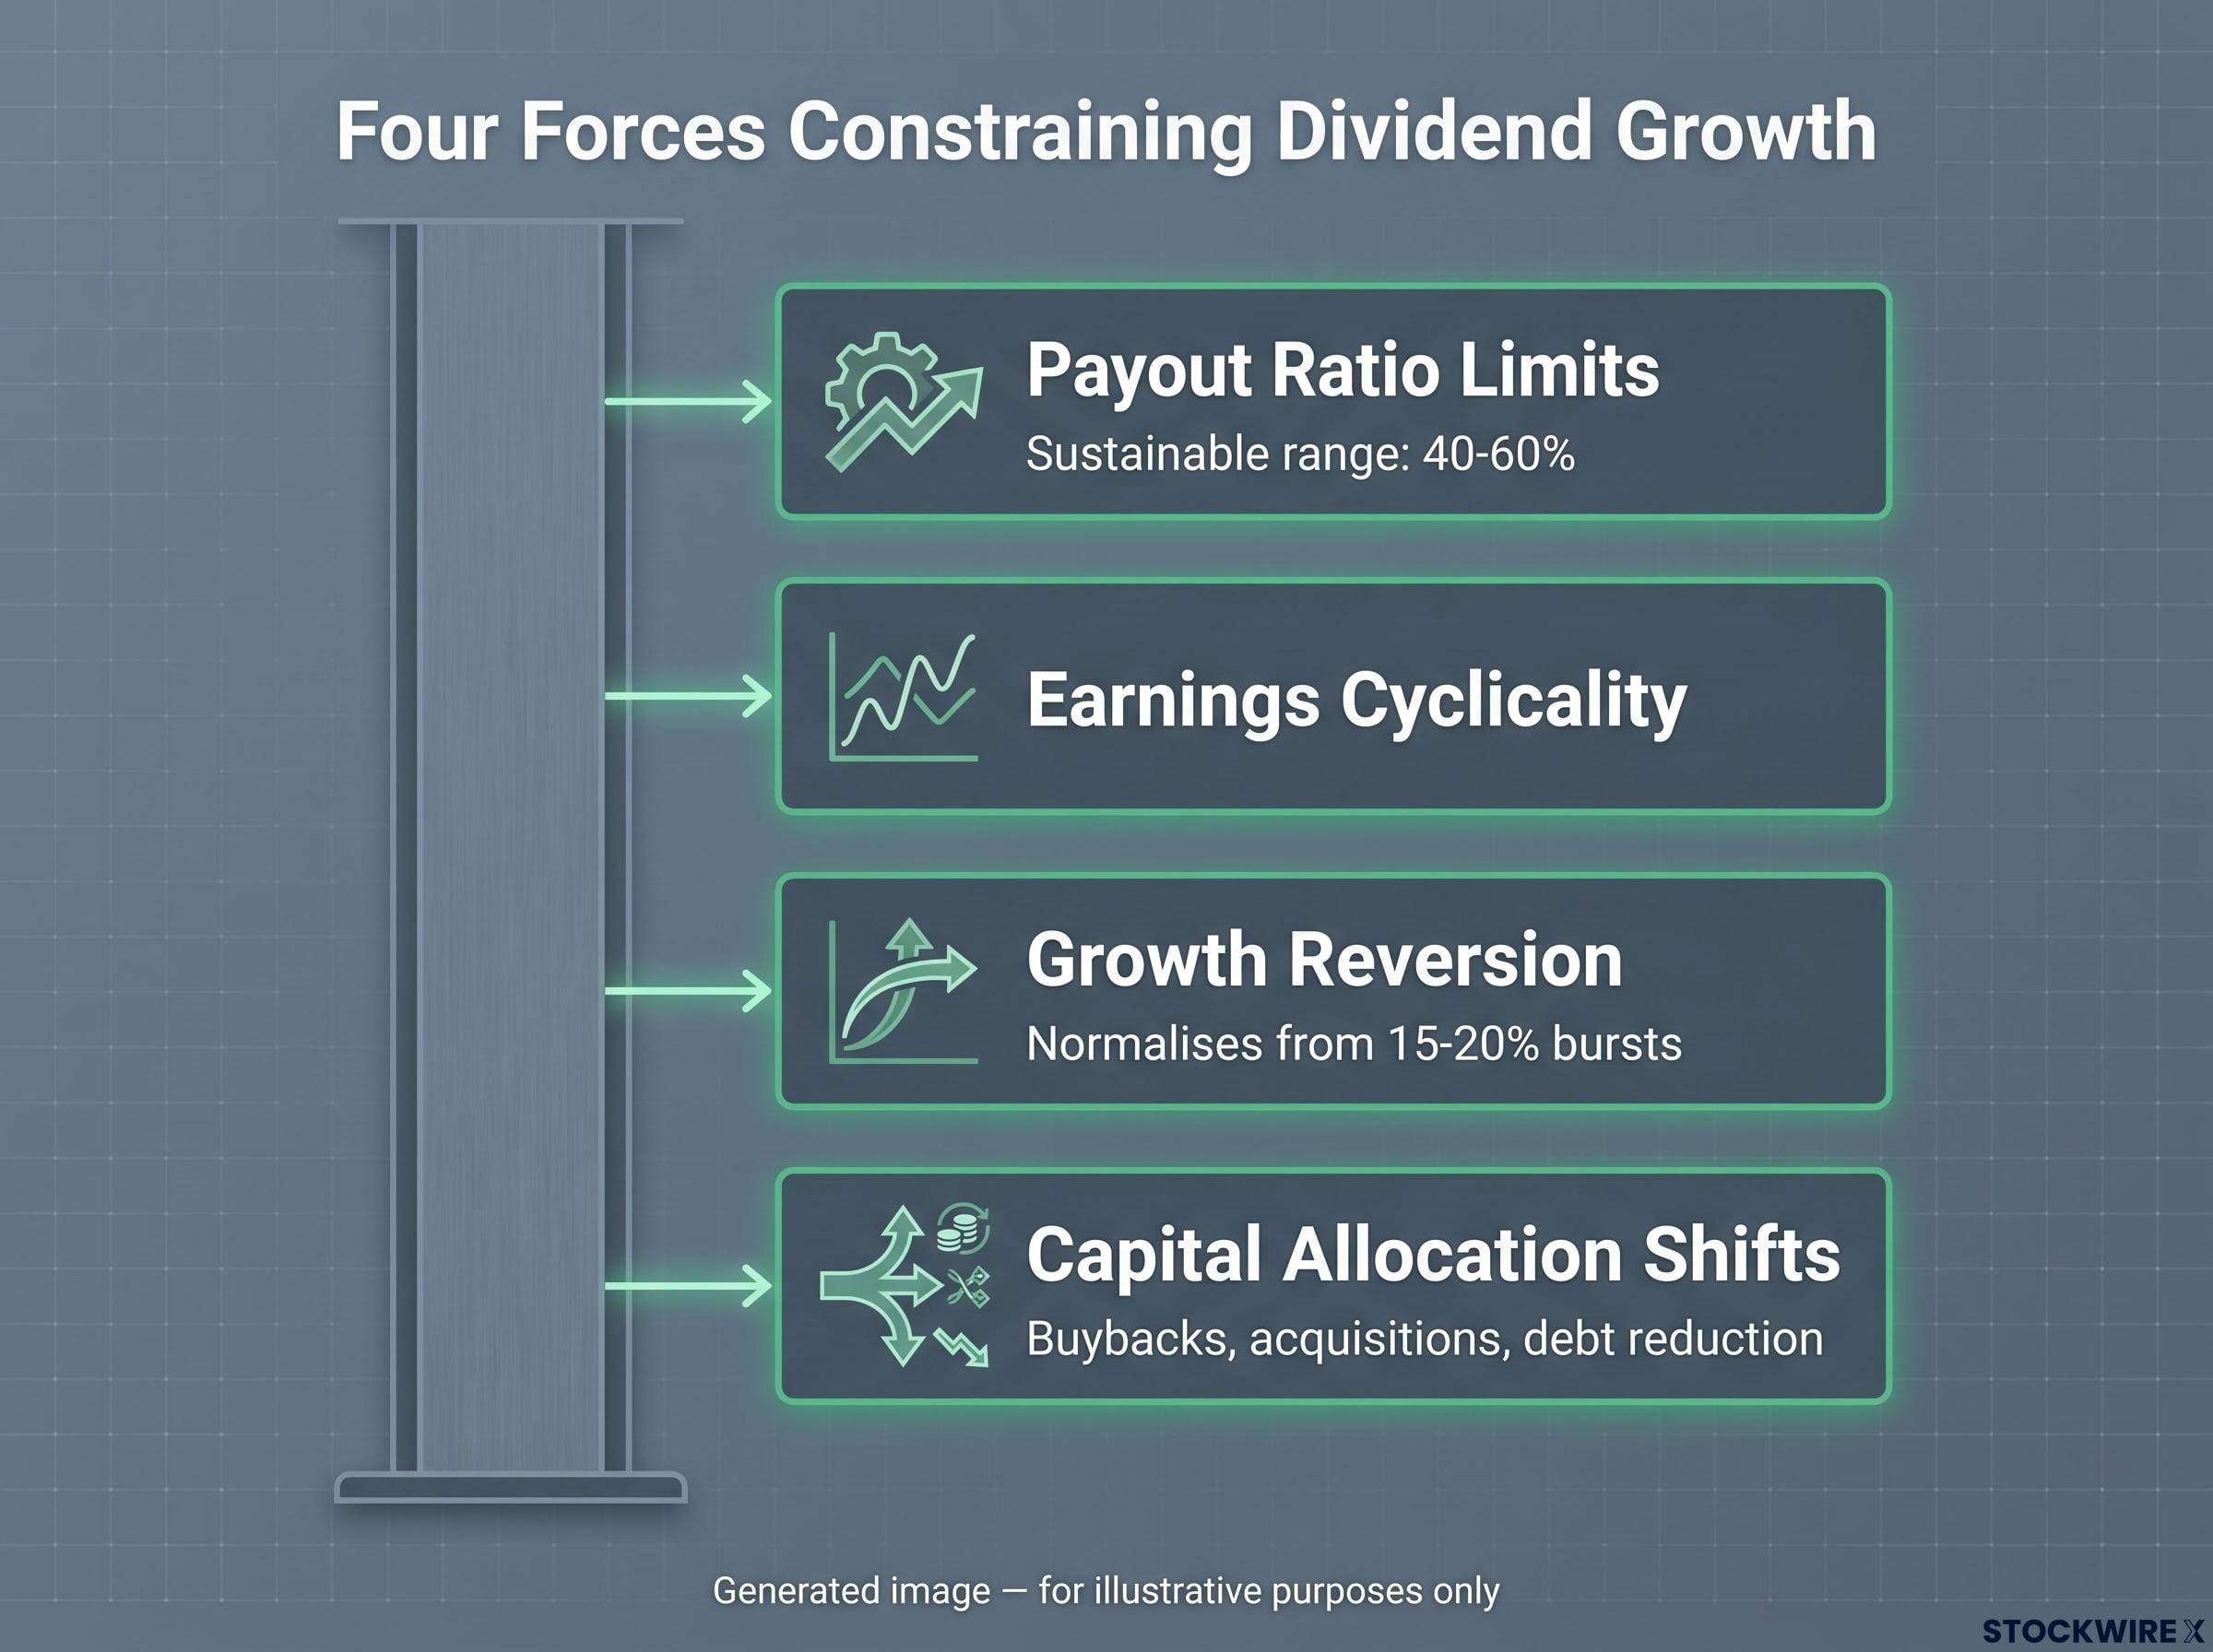
Four forces constrain future dividend growth, and it is worth ranking them in the order you should check them:
- Payout ratio limits. Dividends cannot outgrow earnings indefinitely. For many mature companies, a sustainable payout ratio, dividends as a share of earnings, is often cited in the 40-60% range. Push growth faster than earnings and the buffer between the two eventually compresses.
- Earnings cyclicality. Energy and industrial businesses ride commodity and economic cycles. A multi-year growth streak can hide underlying earnings volatility.
- Growth reversion. Unusually high growth phases, the 15-20% territory, usually reflect a burst of expansion or margin improvement that normalises once markets saturate.
- Capital allocation shifts. Management can redirect cash toward buybacks, acquisitions, or debt reduction, competing directly with dividend increases.
The energy caveat is worth spelling out. Imperial Oil’s 19% historical rate reflects a period of commodity and earnings expansion. Projecting that forward assumes no cycle compression, which is a heroic assumption in a sector defined by cycles.
Model your future income using dividend growth assumptions several percentage points below the historical average, then stress-test against a scenario where growth pauses entirely.
FINRA Rule 2214 mandates that any projections generated by investment analysis tools include explicit disclosures stating that outcomes are hypothetical, do not reflect actual results, and carry no guarantee of future performance, a regulatory standard that applies directly to yield-on-cost projections of the kind explored throughout this guide.
The consensus among practitioners, from Morningstar to Value Line to dedicated dividend-growth writers, is consistent: historical dividend growth is a useful indicator of a company’s discipline and resilience, not a mechanical forecast you can plug into a spreadsheet and trust.
Rigorous dividend stock screening goes beyond payout ratio and streak length: a structured four-pillar framework that incorporates total shareholder yield, free cash flow payout ratios, and a discounted valuation gate can surface the companies most likely to sustain growth through a full economic cycle.
A practical framework for stress-testing dividend growth assumptions
Turn those risks into three questions you ask before anchoring to any company’s historical rate. Is the payout ratio sustainable at the current growth pace, or is the company already stretching to fund increases? Has dividend growth outpaced earnings growth over recent years, signalling a squeeze ahead? And what does the business look like if revenue or margins contract by 20%, does the dividend still hold? Answer those honestly, and you will know whether a yield-on-cost projection is realistic or wishful.
Who benefits most from dividend growth compounding, and who should think differently
By now you are probably asking the only question that matters: is this strategy right for me? The honest answer depends almost entirely on your time horizon, because yield on cost is a time-dependent concept before it is anything else.
Investors with 20-40 year horizons capture its full force. The compounding needs decades to shift from invisible to dominant, and that runway is the whole game.
The dividend reinvestment multiplier is where the acceleration really lives. Rising dividends that you reinvest buy more shares, those shares generate their own dividends, and the loop feeds itself. Recall the McDonald’s figures: reinvesting produced an estimated 950 times the original investment, versus roughly 433 times without. That gap is the feedback loop made visible.
The pattern is not unique to one burger chain. Coca-Cola, Johnson & Johnson, and Procter & Gamble are all frequently cited alongside McDonald’s as cases where patient ownership of modest-yielding, steadily-growing payers produced outsized income on the original capital.
If you are drawing on your portfolio now, the calculus changes. Here is how the two profiles compare:
- Long-horizon accumulator: favours growth rate over starting yield, benefits most from reinvestment, time horizon of 20 years or more. Yield on cost is the whole point.
- Income-drawing investor: prioritises current yield and dividend reliability, time horizon of under 10 years to portfolio draw. Growth still matters, because a rising dividend offsets inflation far better than a static high yield ever could.
Many practitioners split the difference with a hybrid: core holdings in slow-and-steady, high-quality growers to anchor income, plus a satellite allocation to higher-growth names for future yield-on-cost upside.
The question is not whether dividend growth compounding works. The data confirms it does. The real question is whether your specific horizon and income needs let you stay patient long enough for compounding to become the dominant force in your returns.
The single variable that separates good dividend compounders from great ones
Strip away the case studies and comparisons, and one variable stands above the rest. The annual dividend growth rate, sustained consistently over decades, is the most powerful lever in long-term income and wealth from dividend investing. More than starting yield. More than share price moves. More than any single year’s increase.
That reshapes the question you ask before committing to any dividend stock for the long haul. Not “what does it yield today?” but “what is its realistic annual dividend growth rate over my holding period, and what does that imply for yield on cost at year 20 or 30?”
You will not replicate McDonald’s 49-year, 18.5% average. Almost nobody will. But you do not need to, because even a steady 6-8% rate applied over two or three decades delivers income outcomes that are genuinely hard to reach any other way. Recall the anchor: $1,000 of annual income growing at 7.5% reaches roughly $18,000 over 40 years. That is a realistic target, not a freak result.
A new investor entering McDonald’s today at 2.9% yield, assuming the current 7.3% annual growth rate holds, would project a yield on cost well above the starting yield after two or three decades of compounding.
The strategy asks only two things of you: choose companies with durable competitive advantages and consistent earnings growth, then hold long enough for the compounding to work. Everything else is patience.
For readers wanting to translate the yield-on-cost projections in this article into a concrete retirement income plan, our dedicated guide to dividend portfolio modeling walks through how to set a weighted average growth rate assumption and stress-test it against a specific income target.
This article is for informational purposes only and should not be considered financial advice. Investors should conduct their own research and consult with financial professionals before making investment decisions. Past performance does not guarantee future results. Financial projections are subject to market conditions and various risk factors, and any forward-looking figures are speculative and subject to change.