
At roughly $6.35 per share, Bank of Queensland trades at a trailing price-to-earnings (PE) ratio of about 12 times earnings. The major banks sit closer to 18-19 times. That gap raises a straightforward but important question: is BOQ genuinely undervalued, or is it cheap for a reason?
BOQ released its 1H26 results on 22 April 2026, prompting renewed attention from investors tracking ASX bank shares. With fully franked dividends and a share price well below historical implied-value estimates, PE-based analysis offers a concrete, accessible way to frame the valuation question.
This guide walks through exactly how the PE ratio method works, applies it step by step to BOQ using verified FY24 earnings data, benchmarks the result against the Australian banking sector, and explains what the numbers do and do not tell investors. Every calculation is shown in full so the method can be repeated when new results arrive.
What the PE ratio actually measures (and why it matters for bank shares)
The PE ratio is one of the most widely used valuation measures in equity markets. It divides a company’s share price by its annual earnings per share (EPS), producing a single number that represents how much investors are paying for each dollar of profit. A PE of 12 means the market is paying $12 for every $1 of annual earnings. “Earnings” and “profit” are interchangeable in this context.
PE Ratio = Share Price / Earnings Per Share
Banks are particularly well suited to PE analysis. Their earnings streams tend to be relatively stable and comparable across peers, which makes cross-company PE benchmarking more meaningful than it would be in high-growth or capital-light industries where earnings can swing dramatically year to year.
The PE ratio sits within a broader toolkit of fundamental analysis metrics, each answering a different question about the same company: EPS addresses earnings power, revenue growth reveals top-line momentum, profit margins show operational efficiency, and return on equity measures how effectively management deploys capital.
In Australian banking sector commentary, the major banks (CBA, WBC, ANZ, NAB) are typically described as trading in the high-teens PE range, while regional banks trade in the low-to-mid teens. That dispersion creates three practical applications for investors:
- Personal threshold: comparing a stock’s PE to a maximum multiple the investor is willing to pay
- Peer comparison: measuring one bank’s PE against its sector peers to identify relative cheapness or expensiveness
- Fair value estimate: multiplying a company’s EPS by a chosen PE multiple to estimate what the share price would be if the market applied that multiple
Each of these applications appears in the worked example that follows.
When big ASX news breaks, our subscribers know first
BOQ’s FY24 earnings: the numbers behind the calculation
Before running any valuation, the input figures need to be clear and sourced. The table below presents the verified data from BOQ’s FY24 full-year results, released 16 October 2024.
| Metric | Value | Source |
|---|---|---|
| Cash earnings after tax | $343 million | BOQ FY24 results, 16 October 2024 |
| Cash EPS | 52.2 cents | BOQ FY24 results, 16 October 2024 |
| Full-year dividend | 34 cents per share, fully franked | BOQ FY24 results, 16 October 2024 |
| Financial year end | 31 August 2024 | BOQ reporting convention |
One point of clarification matters here. Some secondary data summaries cite an EPS figure of $0.41 for BOQ’s FY24. The 52.2 cents cash EPS figure used throughout this guide comes directly from BOQ’s own FY24 results announcement, and it is the figure applied in all calculations below.
What drove BOQ’s FY24 earnings
The FY24 result reflected margin pressure from competition in home lending and rising deposit costs, which compressed net interest margin (NIM), the difference between what a bank earns on loans and pays on deposits. Working against that headwind, credit impairment expense improved from prior levels, and BOQ completed a whole-of-loan sale in September 2024 that reduced legacy exposures and simplified the balance sheet. Capital ratios remained comfortably above APRA’s “unquestionably strong” benchmarks.
Running the PE valuation: a step-by-step worked example
With verified inputs in hand, the PE method can be applied in four sequential steps. The illustrative share price of $6.35 (a May 2026 working assumption) is used throughout.
- Identify the EPS figure. BOQ’s FY24 cash EPS is 52.2 cents ($0.522).
- Calculate the trailing PE. Divide the current share price by EPS: $6.35 / $0.522 = approximately 12.2 times.
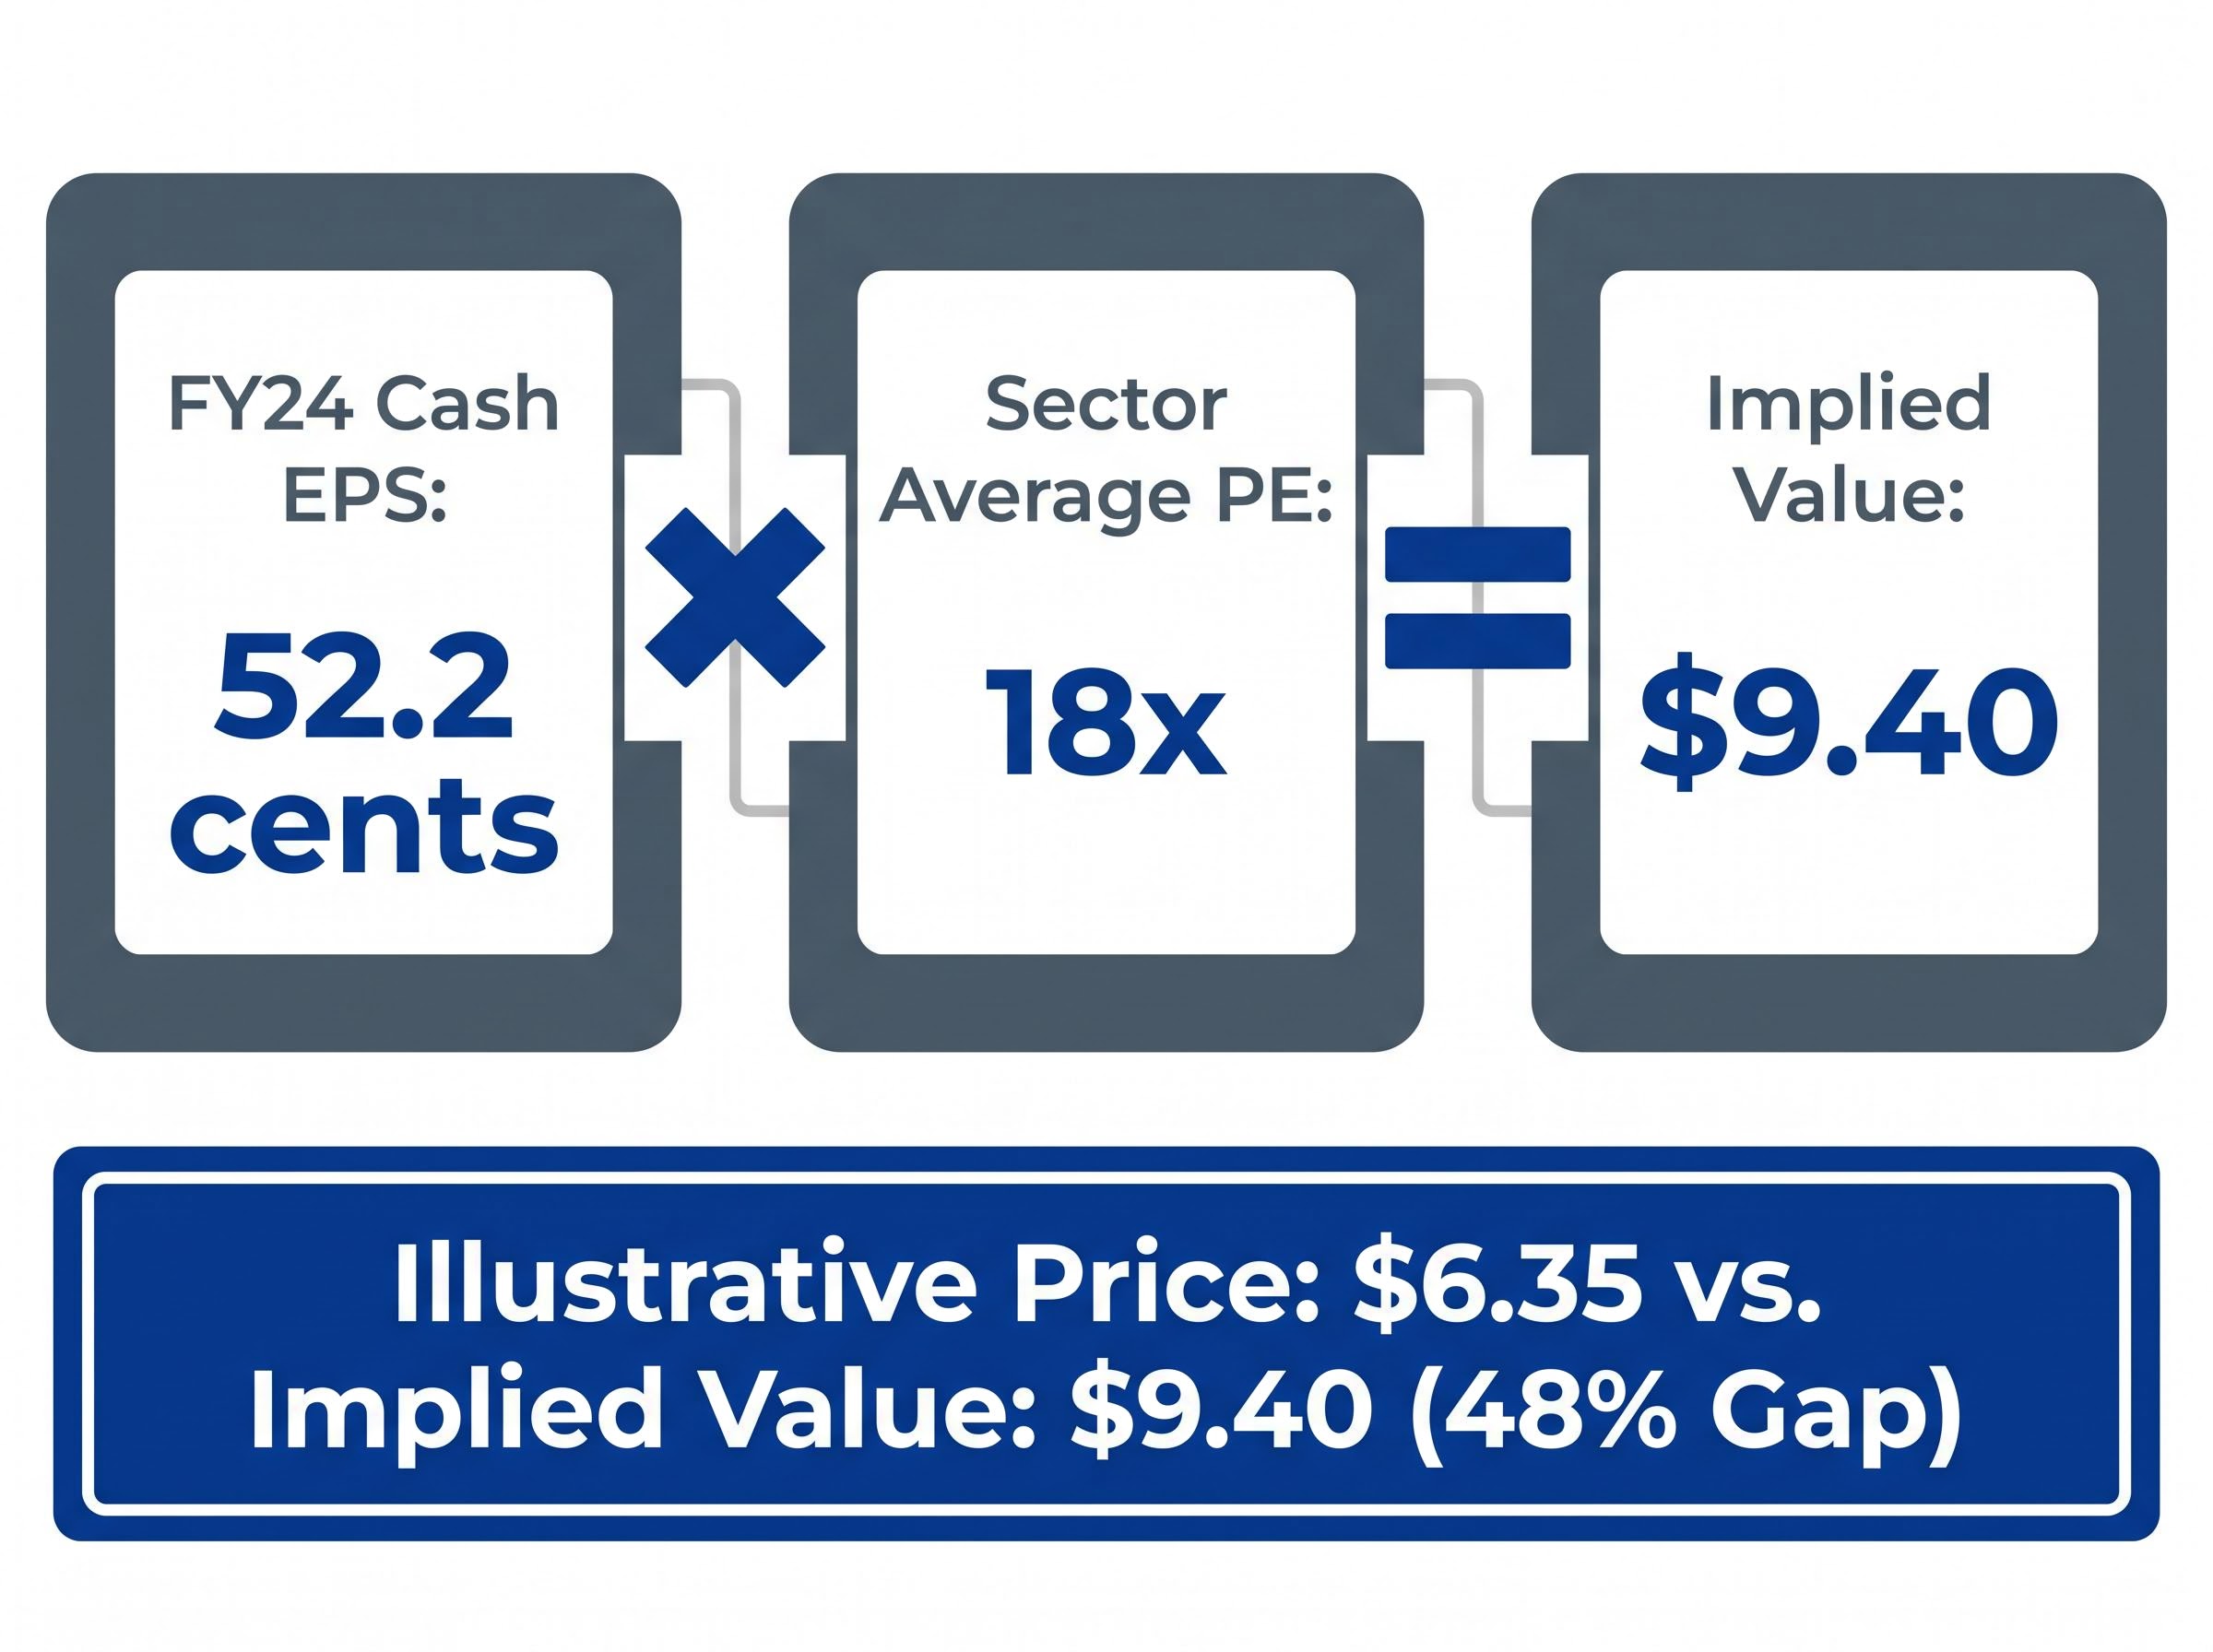
- Apply a sector benchmark multiple. Using an estimated sector average of approximately 18 times (derived from press commentary on major bank multiples, including the Australian Financial Review in November 2025; this is an estimate, not a published index figure), multiply: $0.522 x 18 = $9.40.
- Compare implied value to the current price. The PE method implies a value of $9.40 versus the illustrative price of $6.35, a gap of roughly 48%.
At BOQ’s FY24 cash EPS of 52.2 cents and a sector-average multiple of 18 times, the PE method implies a value of approximately $9.40 per share.
The summary table below captures these three outputs:
| Calculation | Result |
|---|---|
| Trailing PE at $6.35 | ~12.2x |
| Sector average PE (estimate) | ~18x |
| PE-implied value (illustrative) | $9.40 |
That $9.40 figure is an illustrative scenario, not a price target. It shows what the share price would be if the market applied the same multiple to BOQ’s earnings as it does, on average, to the major banks. Whether that re-rating is realistic depends on context explored in the next section.
Broker commentary reported in AFR Street Talk on 22 April 2026 noted that BOQ was trading on a forward PE in the “mid-teens”, with Macquarie expecting low-single-digit EPS growth over the next two to three years.
How BOQ’s multiple stacks up against the sector
The discount is visible in the numbers. Interpreting it requires looking at where BOQ sits relative to peers and why the gap exists.
| Bank / Group | Approximate PE Multiple | Source / Date |
|---|---|---|
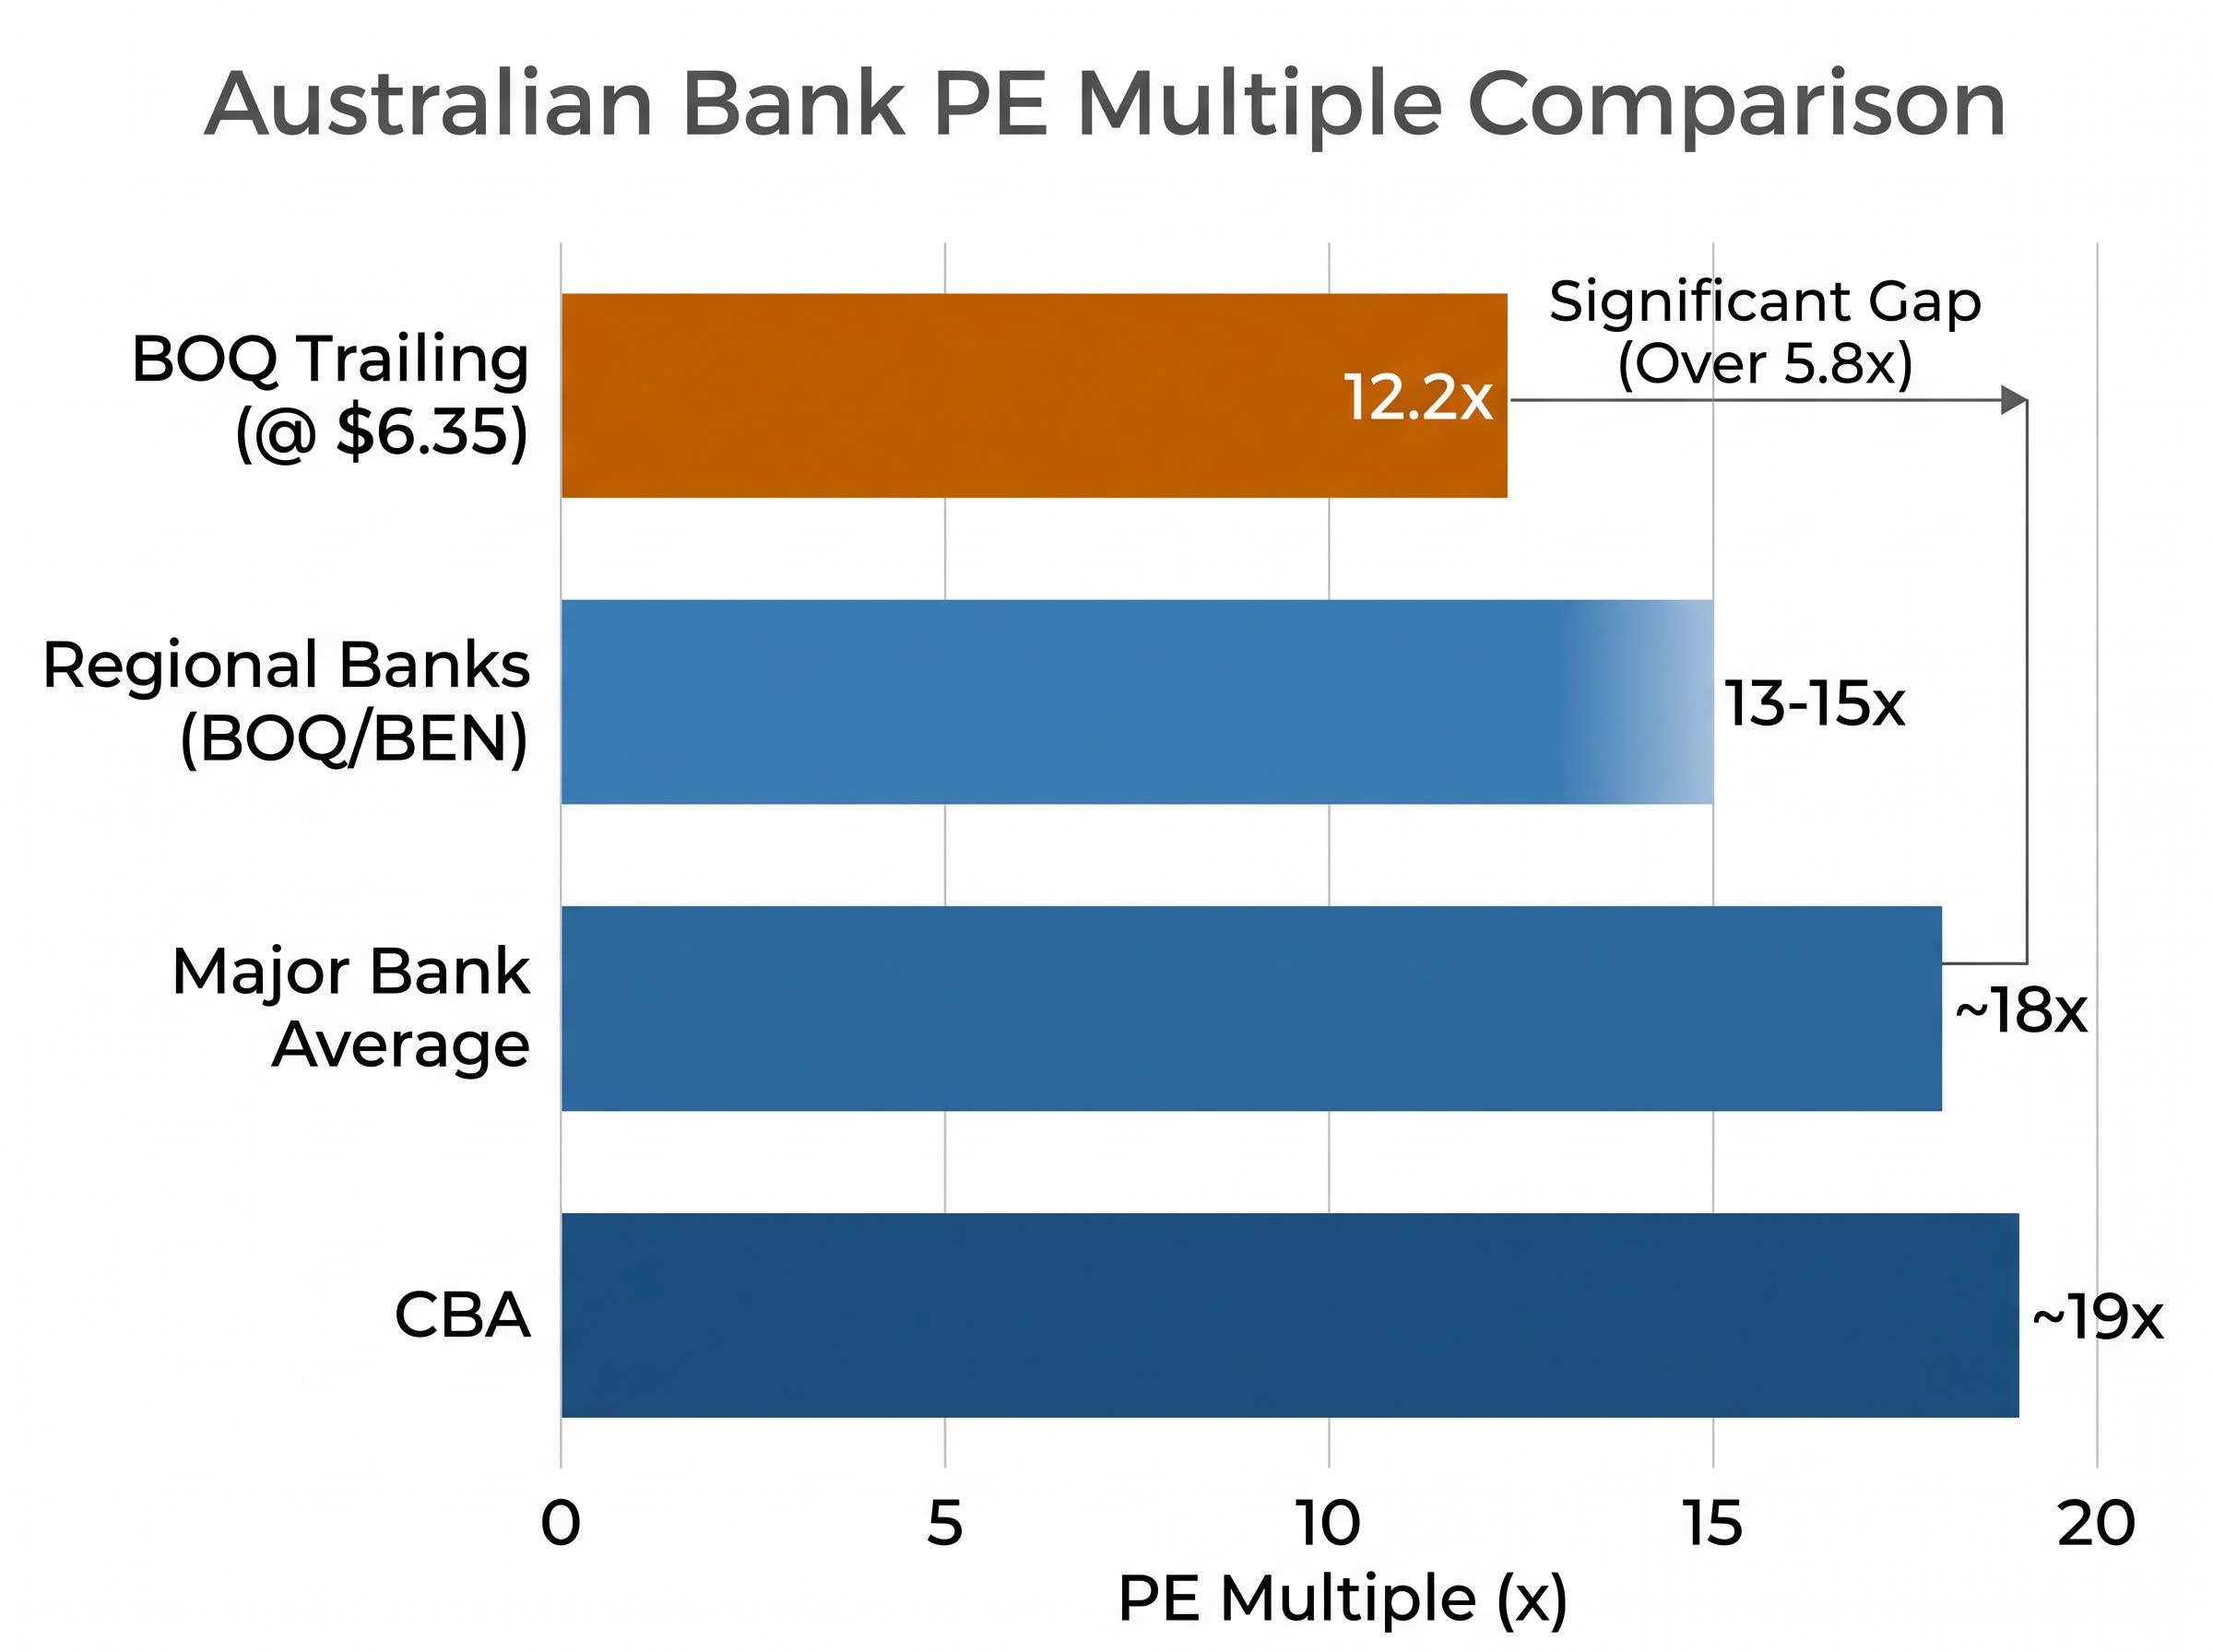
| CBA | ~19x | AFR, November 2025 |
| Major bank group average | High-teens | AFR, 2024-2025 commentary |
| Regional banks (BOQ/BEN) | ~13-15x | AFR, November 2025 |
| BOQ (trailing, at $6.35) | ~12.2x | Own calculation |
BOQ trades at a discount not only to the majors but also toward the lower end of the regional bank range. AFR coverage of the 1H26 result characterised the stock as “appropriately discounted” rather than unequivocally mispriced. The factors underpinning that discount include:
Bendigo and Adelaide Bank shows a comparable valuation structure: a trailing PE of approximately 12 times against the same 18 times sector benchmark produces an implied value gap of roughly 49%, almost identical to the discount visible in BOQ’s numbers, suggesting the regional bank discount is a sector-wide phenomenon rather than a company-specific penalty.
- Smaller scale relative to the major banks
- Higher cost-to-income ratios
- Higher perceived earnings volatility
- Ongoing execution risk tied to the “simpler, specialist bank” transformation programme
Macquarie’s characterisation of BOQ’s forward PE as “mid-teens” (reported in AFR Street Talk, 22 April 2026) implies the market is already pricing in some earnings recovery. The question for investors is whether the remaining gap to the sector average represents opportunity or a justified risk premium. Analyst commentary suggests the answer is a mixture of both: “good value if the transformation delivers”, with the discount reflecting real structural differences rather than a simple market oversight.
The franking credit advantage: what the PE method leaves out
The PE ratio focuses on earnings, but many Australian investors hold bank shares primarily for income. For those eligible to use franking credits, the total return picture extends beyond the price-to-earnings multiple.
BOQ’s dividends are fully franked, meaning the company has already paid corporate tax on the profits distributed. Under Australia’s dividend imputation system, eligible shareholders (including retirees, lower-tax-rate individuals, and self-managed super fund trustees) can use attached franking credits to reduce their personal tax liability, or in some cases receive a cash refund.
The grossed-up yield calculation at the illustrative $6.35 share price works as follows:
The grossed-up dividend calculation follows a standard formula across all fully franked Australian shares: divide the cash dividend by 0.70 (reflecting the 30% corporate tax rate) to arrive at the pre-tax equivalent, then express that figure as a percentage of the current share price to produce the grossed-up yield.
- Cash dividend yield: Divide the 34-cent full-year dividend by $6.35 = approximately 5.35%
- Grossed-up dividend per share: Divide $0.34 by 0.70 (reflecting the 30% corporate tax rate) = approximately $0.4857
- Grossed-up yield: Divide $0.4857 by $6.35 = approximately 7.65%
At $6.35 per share, BOQ’s 34-cent fully franked dividend implies a grossed-up yield of approximately 7.65% for investors able to fully utilise franking credits.
As a general principle noted in AFR wealth coverage across 2024-2025, a fully franked 5% cash yield equates to approximately 7.1% grossed-up for investors who can fully utilise the credits. BOQ’s cash yield of 5.35% sits above that illustrative threshold.
All yield figures above are own illustrative calculations using verified dividend inputs and the standard Australian imputation formula. They are not sourced from a named analyst. Yield figures will change with the share price and future dividend decisions.
What PE analysis cannot tell you about BOQ
A single trailing PE figure captures how the market currently prices BOQ’s most recent earnings. It does not capture whether those earnings are sustainable, improving, or deteriorating.
PE analysis uses historical earnings as its input. It does not address several bank-specific metrics that matter for a complete assessment:
- Loan book growth quality: whether growth is coming from sound lending or aggressive risk-taking
- Non-performing loan provisions: how much the bank has set aside for loans that may not be repaid
- Bad debt classification policies: how the bank defines and categorises problem loans
- Funding source mix: the balance between customer deposits (generally cheaper and more stable) and offshore wholesale debt (more expensive, more sensitive to market conditions)
BOQ-specific risks the trailing multiple does not capture
Beyond the generic limits of PE analysis, BOQ carries specific risk factors that help explain its discount to peers:
- Smaller scale than the major banks, limiting pricing power and distribution reach
- Higher cost-to-income ratios, meaning more of each revenue dollar goes to operating expenses
- Less diversified earnings streams, increasing sensitivity to conditions in any single product line
- Ongoing transformation execution risk as the “simpler, specialist bank” programme continues
- Continued NIM compression from mortgage market competition, confirmed in BOQ’s 1H26 results on 22 April 2026
The RBA’s October 2025 Financial Stability Review assessed the Australian banking sector as resilient overall, while noting that net interest margin pressure from mortgage market competition remained an ongoing structural feature for retail-focused lenders, context that sits directly behind BOQ’s compressed NIM outcomes in FY24 and 1H26.
Broker commentary from Macquarie (via AFR, April 2026) frames low-single-digit EPS growth as the base case over the next two to three years. If that trajectory holds, the scope for a meaningful PE re-rating is limited even if the transformation programme succeeds. The PE method is a useful screening tool and starting point, not a standalone investment decision framework.
The valuation case for BOQ in context
At approximately 12 times trailing earnings versus a sector average closer to 18 times, the PE method points to potential upside for BOQ shares if earnings recover and the transformation delivers. The illustrative implied value of $9.40 (using an 18 times sector multiple applied to 52.2-cent FY24 cash EPS) represents a scenario, not a forecast. The discount is not simply a market inefficiency; analyst commentary consistently describes it as partly justified by scale, cost, and execution risk.
The two most useful next steps for investors applying this method are practical ones:
- Update the PE calculation when BOQ’s FY26 full-year results are released (financial year ending 31 August 2026)
- Run the same calculation at the prevailing share price on that date
- Supplement the PE analysis with balance sheet metrics, particularly loan book quality and funding mix
- Review BOQ’s investor presentation notes for progress on the transformation programme and cost-to-income trajectory
BOQ’s 1H26 results confirmed the transformation is ongoing. The FY26 full-year result will be the next meaningful data point for reassessing whether the discount is narrowing or widening.
For investors ready to move beyond PE screening and stress-test a bank position more rigorously, our dedicated guide to ASX bank stock valuation beyond ratios covers the six-step due diligence framework used by professional fund managers, including how to read NIM trends, CET1 ratios, and loan loss provisions as the primary indicators of earnings quality.
This article is for informational purposes only and should not be considered financial advice. Investors should conduct their own research and consult with financial professionals before making investment decisions. All illustrative calculations use historical inputs and assumptions that may not reflect future outcomes. Past performance does not guarantee future results.