
How to Value Westpac Shares Using PE and DDM
2 hrs ago


ANZ shares closed at A$35.50 on 22 May 2026. That price is visible to anyone with a brokerage app. What is less visible is whether A$35.50 represents fair value, a discount, or a premium for the earnings the bank actually produces. The price-to-earnings (PE) ratio, the most widely used valuation tool in equity analysis, offers a structured way to answer that question. Applied to ANZ’s FY24 earnings data and measured against its three major-bank peers (CBA, NAB, and Westpac), the ratio produces a sector-adjusted valuation that retail investors can calculate, interpret, and stress-test on their own. What follows is a step-by-step walkthrough: the formula, the live calculation, the peer comparison, and the limitations every investor should understand before treating the output as an investment signal.
Before touching a formula, it helps to understand what the PE ratio is designed to reveal. At its simplest, the ratio answers one question: how much is the market charging today for each dollar of a company’s most recent annual earnings?
PE ratio, in plain English: The PE ratio is the price an investor pays per share divided by the earnings that share generated over the past year. A PE of 18x means the market is pricing each $1 of earnings at $18.
That makes it a relative value gauge. A PE of 18x is neither cheap nor expensive on its own; it only becomes meaningful when compared to the PE of similar companies operating under similar conditions.
The ratio works particularly well for mature, consistently profitable businesses. ASX major banks fit that description precisely: ANZ, NAB, WBC, and CBA produce reportable accounting profits year after year, making their PE ratios directly comparable across a stable peer group.
The calculation requires two inputs and one division. Nothing more.
The formula: PE = Share Price / Earnings Per Share (EPS)
That figure, 16.6x, means the market was pricing each dollar of ANZ’s FY24 earnings at $16.60 at that moment.
Financial data platforms such as Yahoo Finance and GuruFocus report ANZ’s trailing PE at 18.04-18.13x as of May 2026. The difference comes down to which earnings figure is used.
The 16.6x calculated above uses ANZ’s full-year FY24 EPS of A$2.15. Data platforms typically use trailing twelve-month (TTM) EPS, which rolls forward with each reporting period. ANZ’s TTM EPS as of May 2026 is A$1.97, a lower figure that produces a higher PE ratio.
Intraday price movements also shift the ratio in real time. A calculation done at the day’s low will produce a different PE from one done at the high. For any comparison to be meaningful, both the EPS figure and the reference price should be drawn from the same clearly stated point in time.
Knowing ANZ’s PE ratio is step one. The more useful question is what the stock would be worth if the market valued it at the same multiple as its peer group.
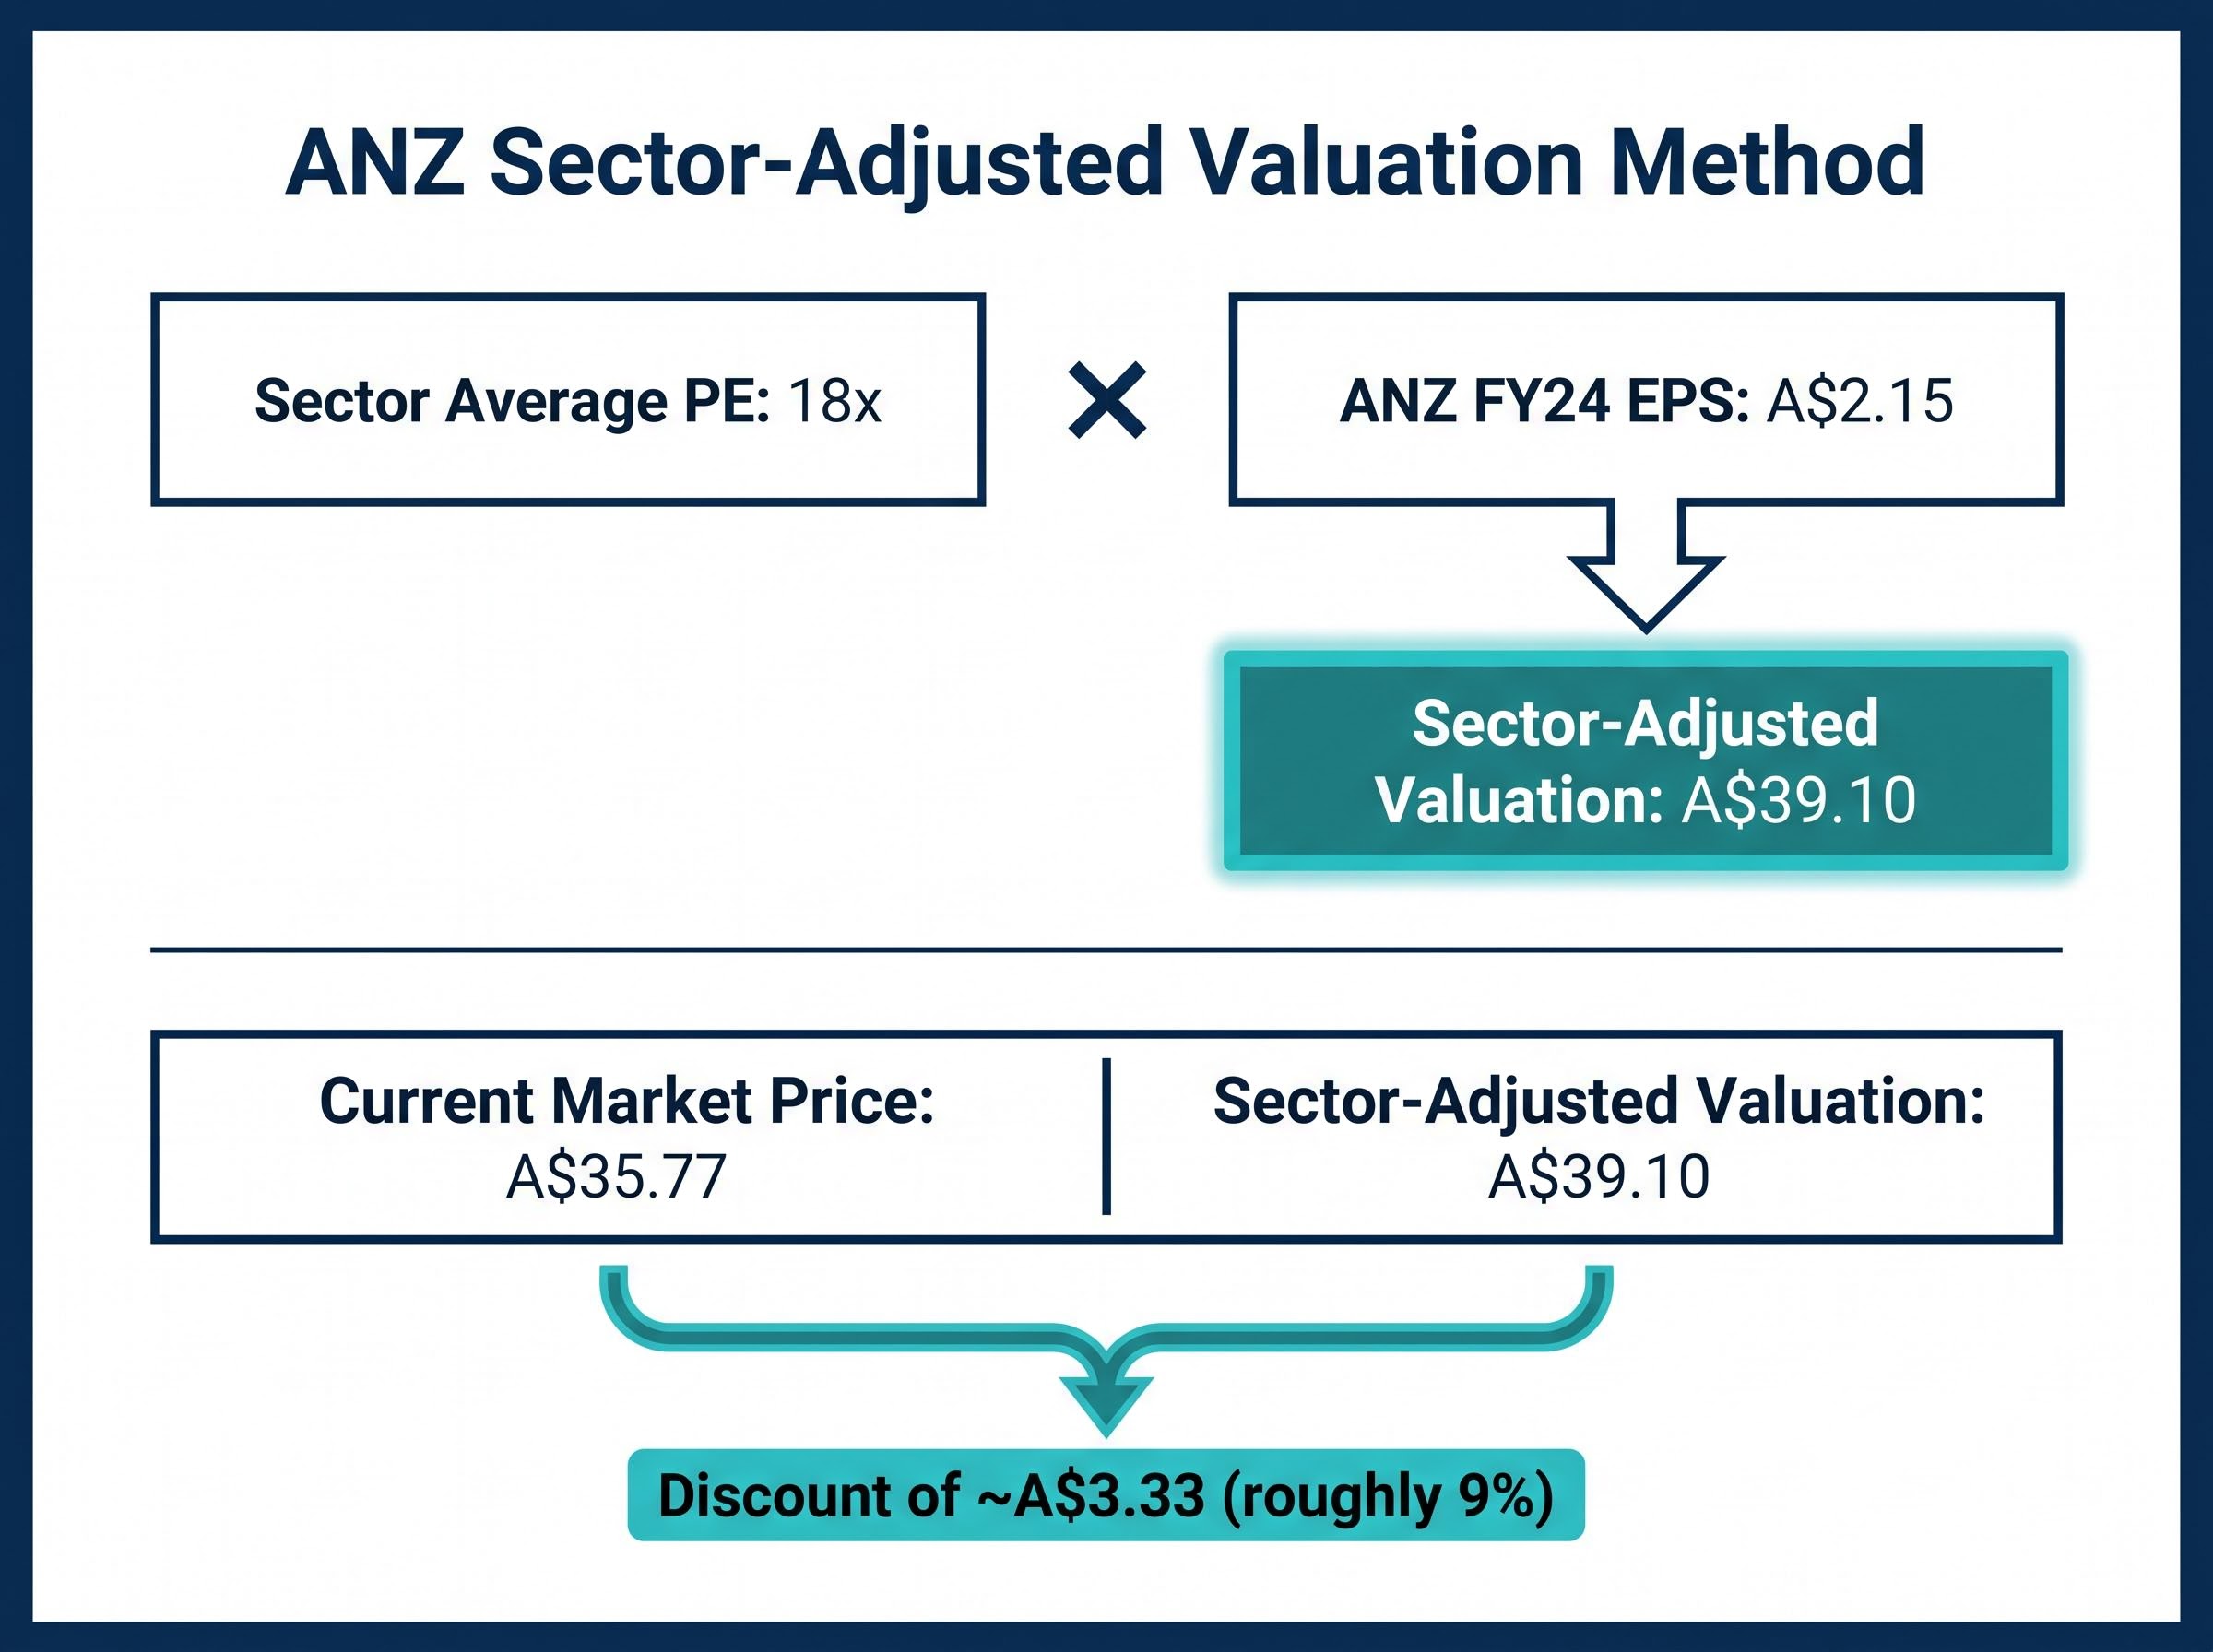
The sector-adjusted valuation method answers this in two steps:
That A$39.10 figure is not a price target. It is a benchmark: the price ANZ shares would trade at if the market assigned them the same earnings multiple as the broader sector average.
| Input | Value |
|---|---|
| ANZ FY24 EPS | A$2.15 |
| Sector Average PE | 18x |
| Sector-Adjusted Valuation | A$39.10 |
| Current Market Price | A$35.77 |
At A$35.77, ANZ trades at a discount of approximately A$3.33, or roughly 9%, to the sector-adjusted figure. That gap is what the PE method makes visible. Whether it represents a buying opportunity or a justified discount requires further analysis.
The peer comparison sharpens the picture, and it surfaces one anomaly that changes how the sector average should be read.
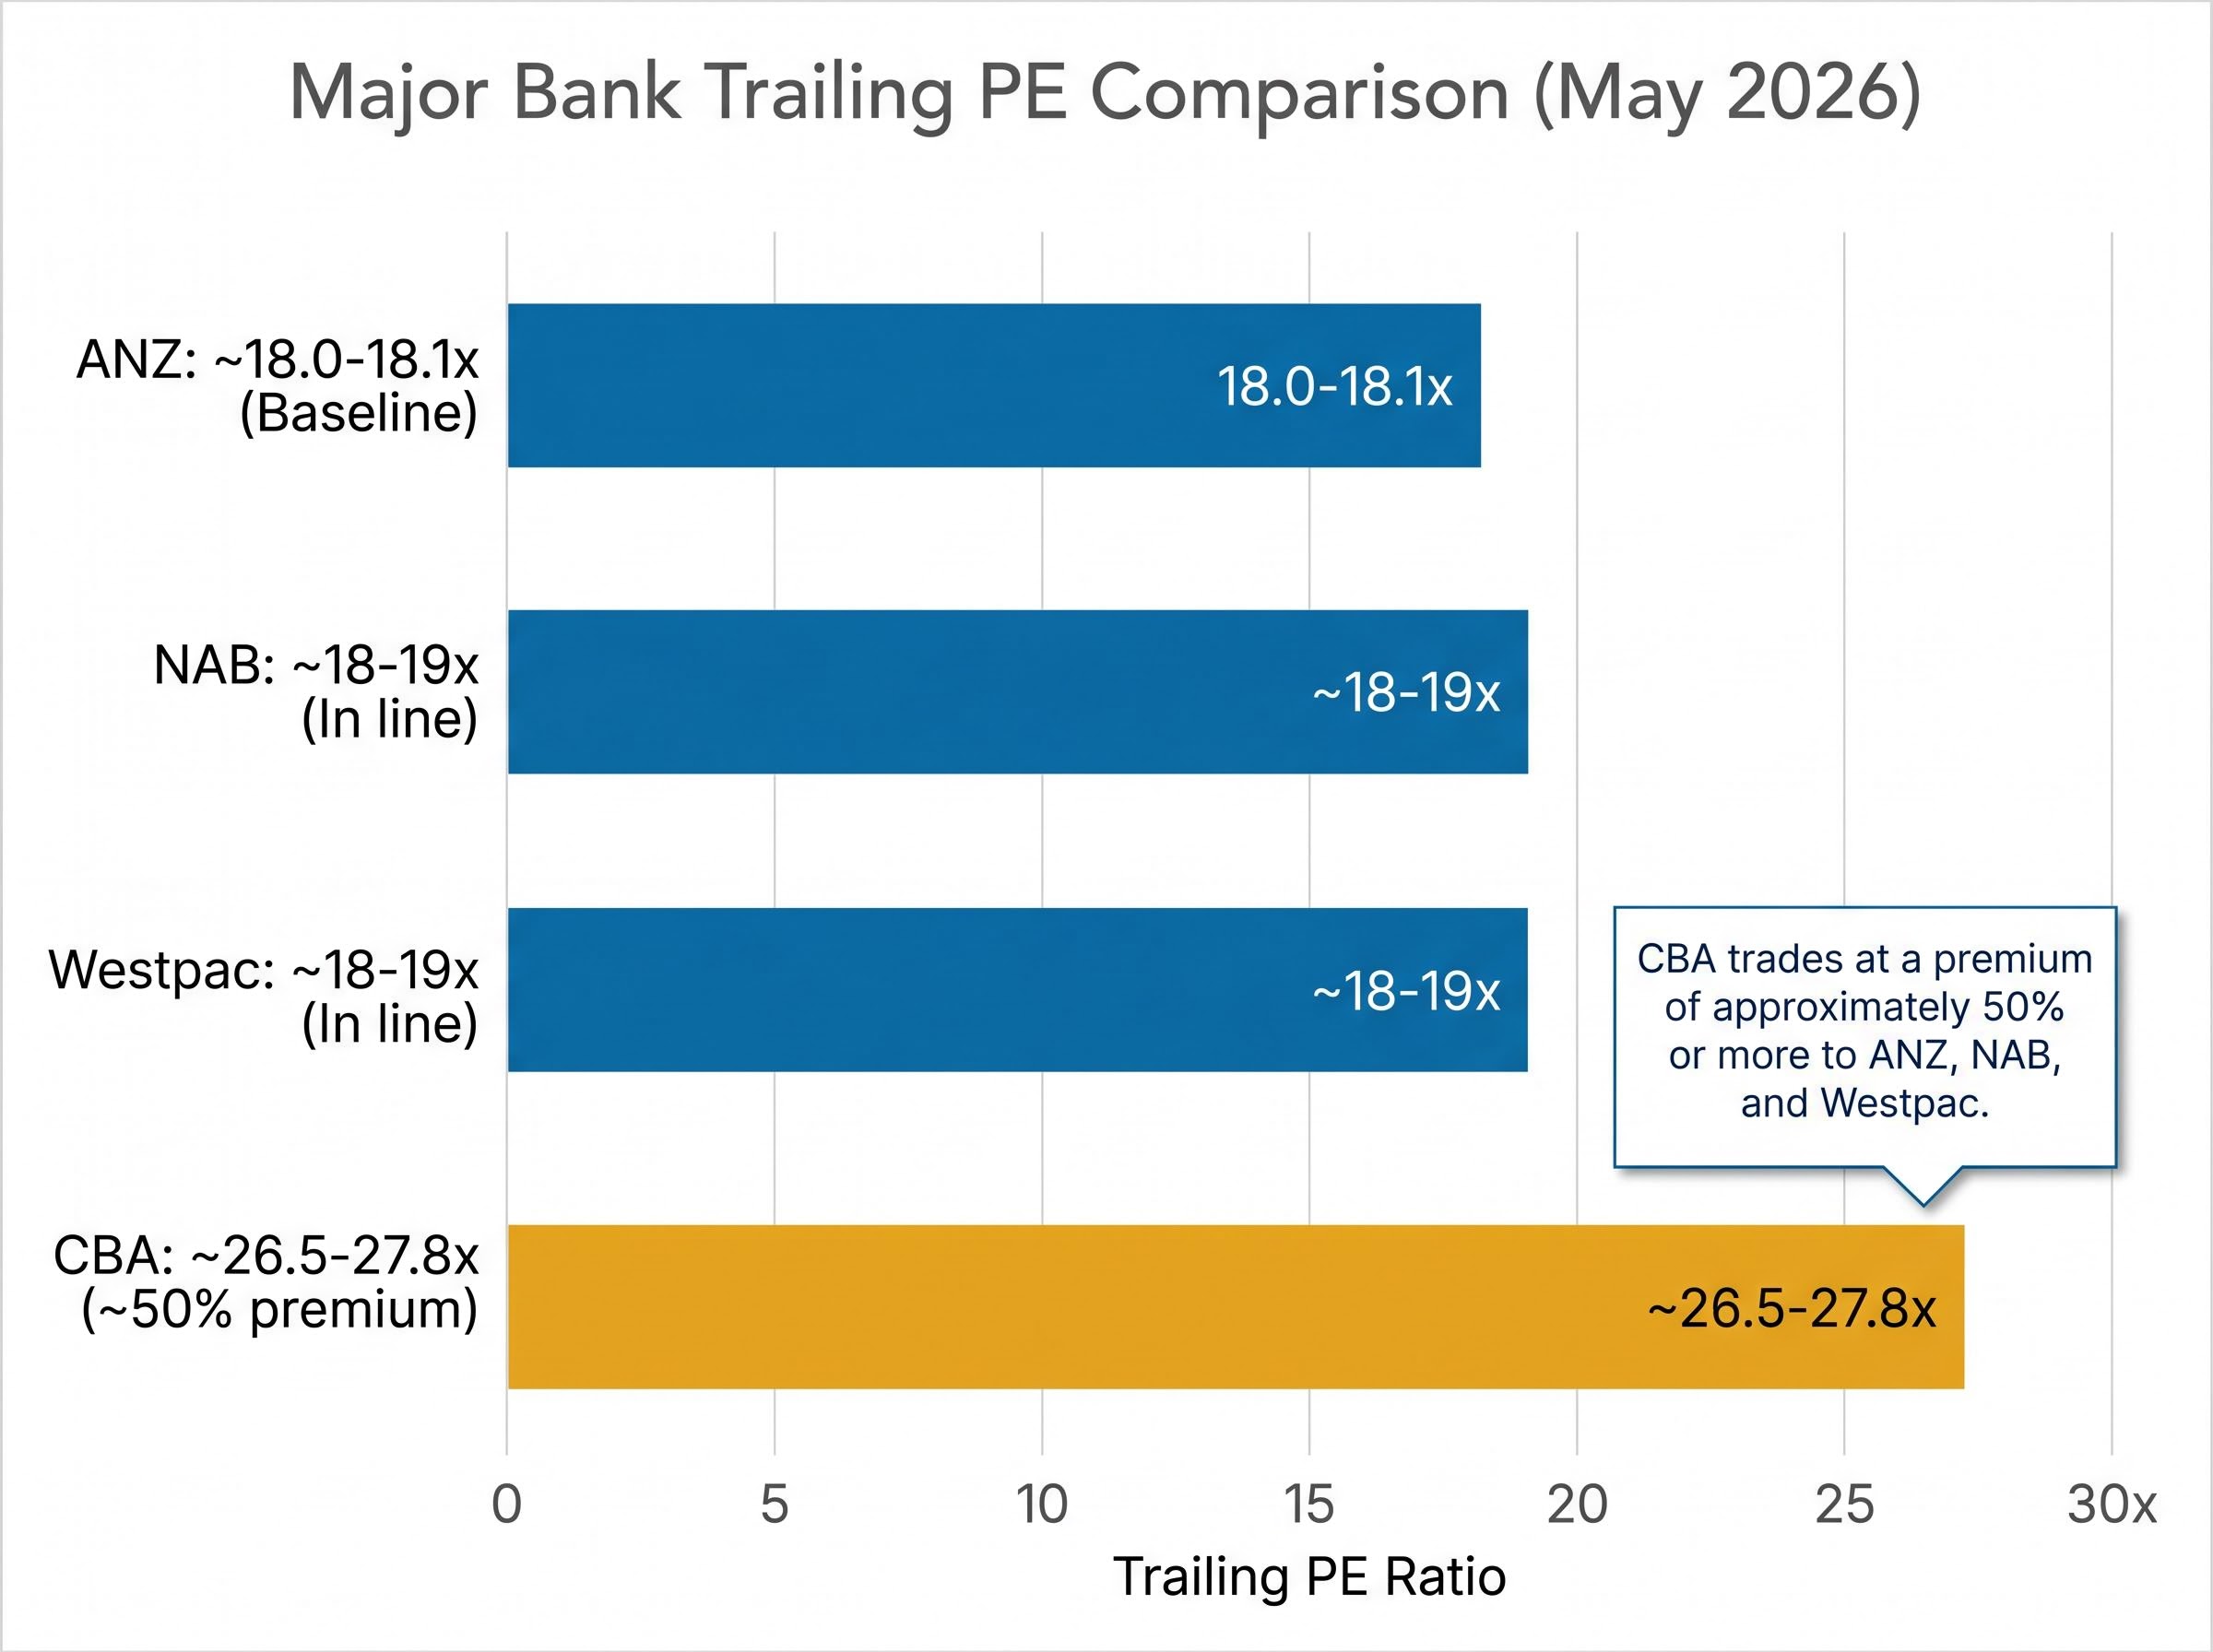
As of May 2026, three of the four major banks cluster within a narrow band. ANZ trades at a trailing PE of approximately 18.0-18.1x. NAB and WBC sit at approximately 18-19x. The multiples are close enough to suggest the market views these three banks’ earnings quality and growth prospects as broadly comparable.
Then there is CBA.
| Bank | ASX Code | Trailing PE (May 2026) | Relative to ANZ |
|---|---|---|---|
| ANZ | ANZ | ~18.0-18.1x | Baseline |
| NAB | NAB | ~18-19x | In line |
| Westpac | WBC | ~18-19x | In line |
| CBA | CBA | ~26.5-27.8x | ~50% premium |
CBA trades at a premium of approximately 50% or more to ANZ, NAB, and Westpac on a trailing PE basis. That gap is the single most defining feature of Australian major-bank valuations in May 2026.
CBA’s elevated multiple pulls the four-bank average PE into the low-to-mid 20s, well above the 18-19x range where the other three banks actually trade. Any sector-adjusted valuation calculated using the four-bank average will therefore overstate the implied fair value for ANZ, NAB, or WBC, because it incorporates a premium that the market assigns only to CBA.
Mid-2025 analyst commentary cited sector EPS growth forecasts of approximately 9-10% per annum. Despite similar growth outlooks across the four banks, the valuation gap has persisted, suggesting CBA’s premium reflects factors beyond near-term earnings, such as perceived earnings quality, franchise strength, or index-weight-driven demand.
The PE calculation has produced a number. The sector comparison has placed that number in context. Neither step, on its own, tells an investor whether to buy, hold, or sell.
A stock may trade at a below-peer PE for entirely rational reasons. Slower expected earnings growth, higher perceived risk, weaker competitive positioning, or structural headwinds to margins can all compress a PE multiple without the stock being genuinely undervalued. The discount is the market’s current assessment, and that assessment may be correct.
The PE ratio also has structural limitations that apply regardless of the company being analysed:
A PE-derived valuation raises questions it cannot answer. For ANZ and Australian bank shares specifically, the following factors drive the earnings that sit beneath the ratio:
According to Rask Media research, comprehensive qualitative analysis of a single bank share requires in excess of 100 hours before financial modelling begins. The PE ratio takes roughly 30 seconds to calculate. That gap illustrates where the real analytical work sits.
This article is for informational purposes only and should not be considered financial advice. Investors should conduct their own research and consult with financial professionals before making investment decisions.
The worked example above produced three reference points: ANZ’s FY24 PE of 16.6x, its trailing twelve-month PE of approximately 18x, and a sector-adjusted valuation of A$39.10. Together, these figures sketch a picture of relative value against the major-bank peer group. They are not a price target.
For context, a dividend discount model (DDM) approach applied to ANZ using the A$1.66 annual dividend has produced an averaged valuation of approximately A$35.10, according to available analysis. That figure closely matches the market price of A$35.50, suggesting the stock is priced near fair value from an income-based perspective as well.
The PE ratio is most useful not as a standalone signal but as a prompt for better questions:
Past performance does not guarantee future results. Financial projections are subject to market conditions and various risk factors.
The PE ratio (price-to-earnings ratio) measures how much the market charges for each dollar of a company's annual earnings. For ANZ, dividing the share price by FY24 EPS of A$2.15 produces a PE of approximately 16.6x using the intraday high of A$35.77 on 22 May 2026.
Multiply ANZ's FY24 EPS of A$2.15 by the Australian banking sector average PE of approximately 18x to get a sector-adjusted valuation of A$39.10, which represents the price ANZ shares would trade at if the market assigned them the same multiple as the broader sector.
CBA trades at a trailing PE of approximately 26.5-27.8x, roughly 50% above the 18-19x range of the other three major banks. Analysts suggest this premium reflects perceived earnings quality, franchise strength, and index-weight-driven demand rather than a materially different near-term earnings growth outlook.
Data platforms typically use trailing twelve-month (TTM) EPS, which for ANZ was A$1.97 as of May 2026, producing a higher PE of around 18.04-18.13x. A manual calculation using full-year FY24 EPS of A$2.15 produces a lower figure of 16.6x, so the difference comes down to which earnings period is used.
The PE ratio is backward-looking, ignores debt and balance sheet risk, and is highly sensitive to the peer group chosen. For example, including CBA in the sector average inflates the implied fair value for ANZ, NAB, and Westpac because CBA's outsized premium is not representative of the broader three-bank cluster.