
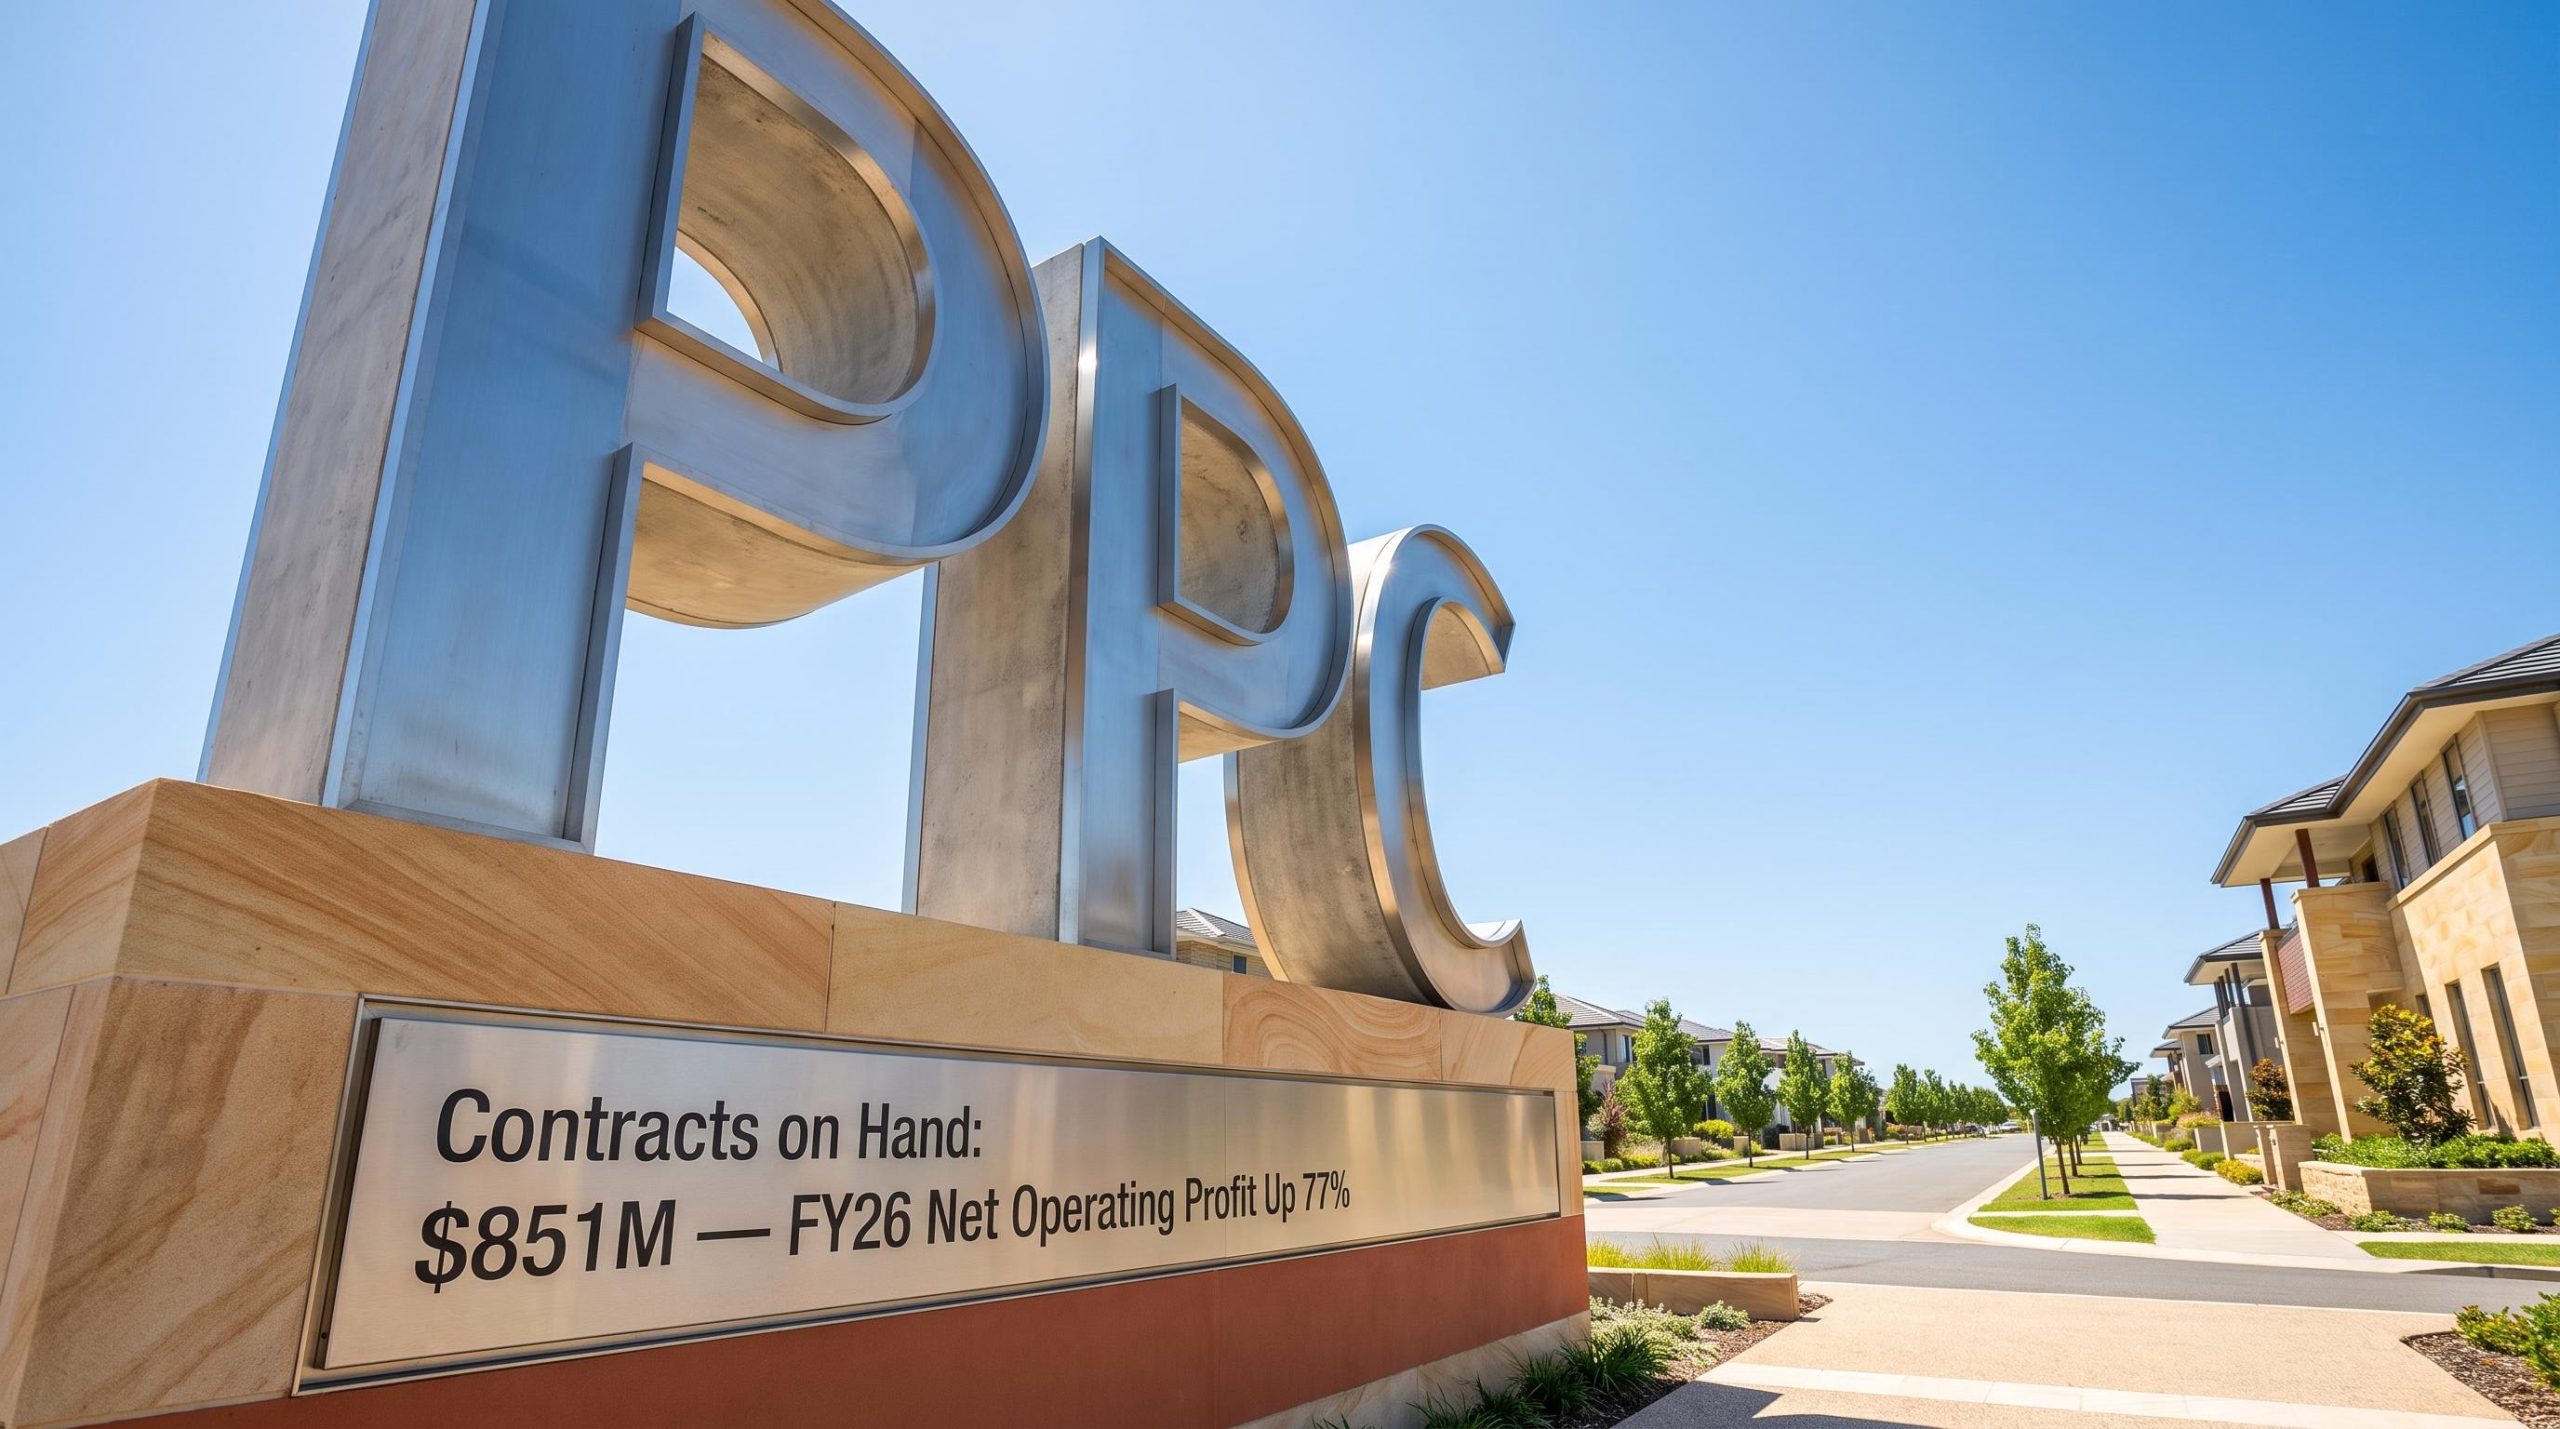
Peet delivers record FY26 net operating profit of $103.4 million, up 77%
In its FY26 full-year results for the year ended 30 June 2026, Peet Limited (ASX: PPC) delivered record earnings, with growth flowing through to increased returns for shareholders. The result was underpinned by favourable market conditions, strong sales across Western Australia and Queensland and the disciplined execution of the Group’s strategy.
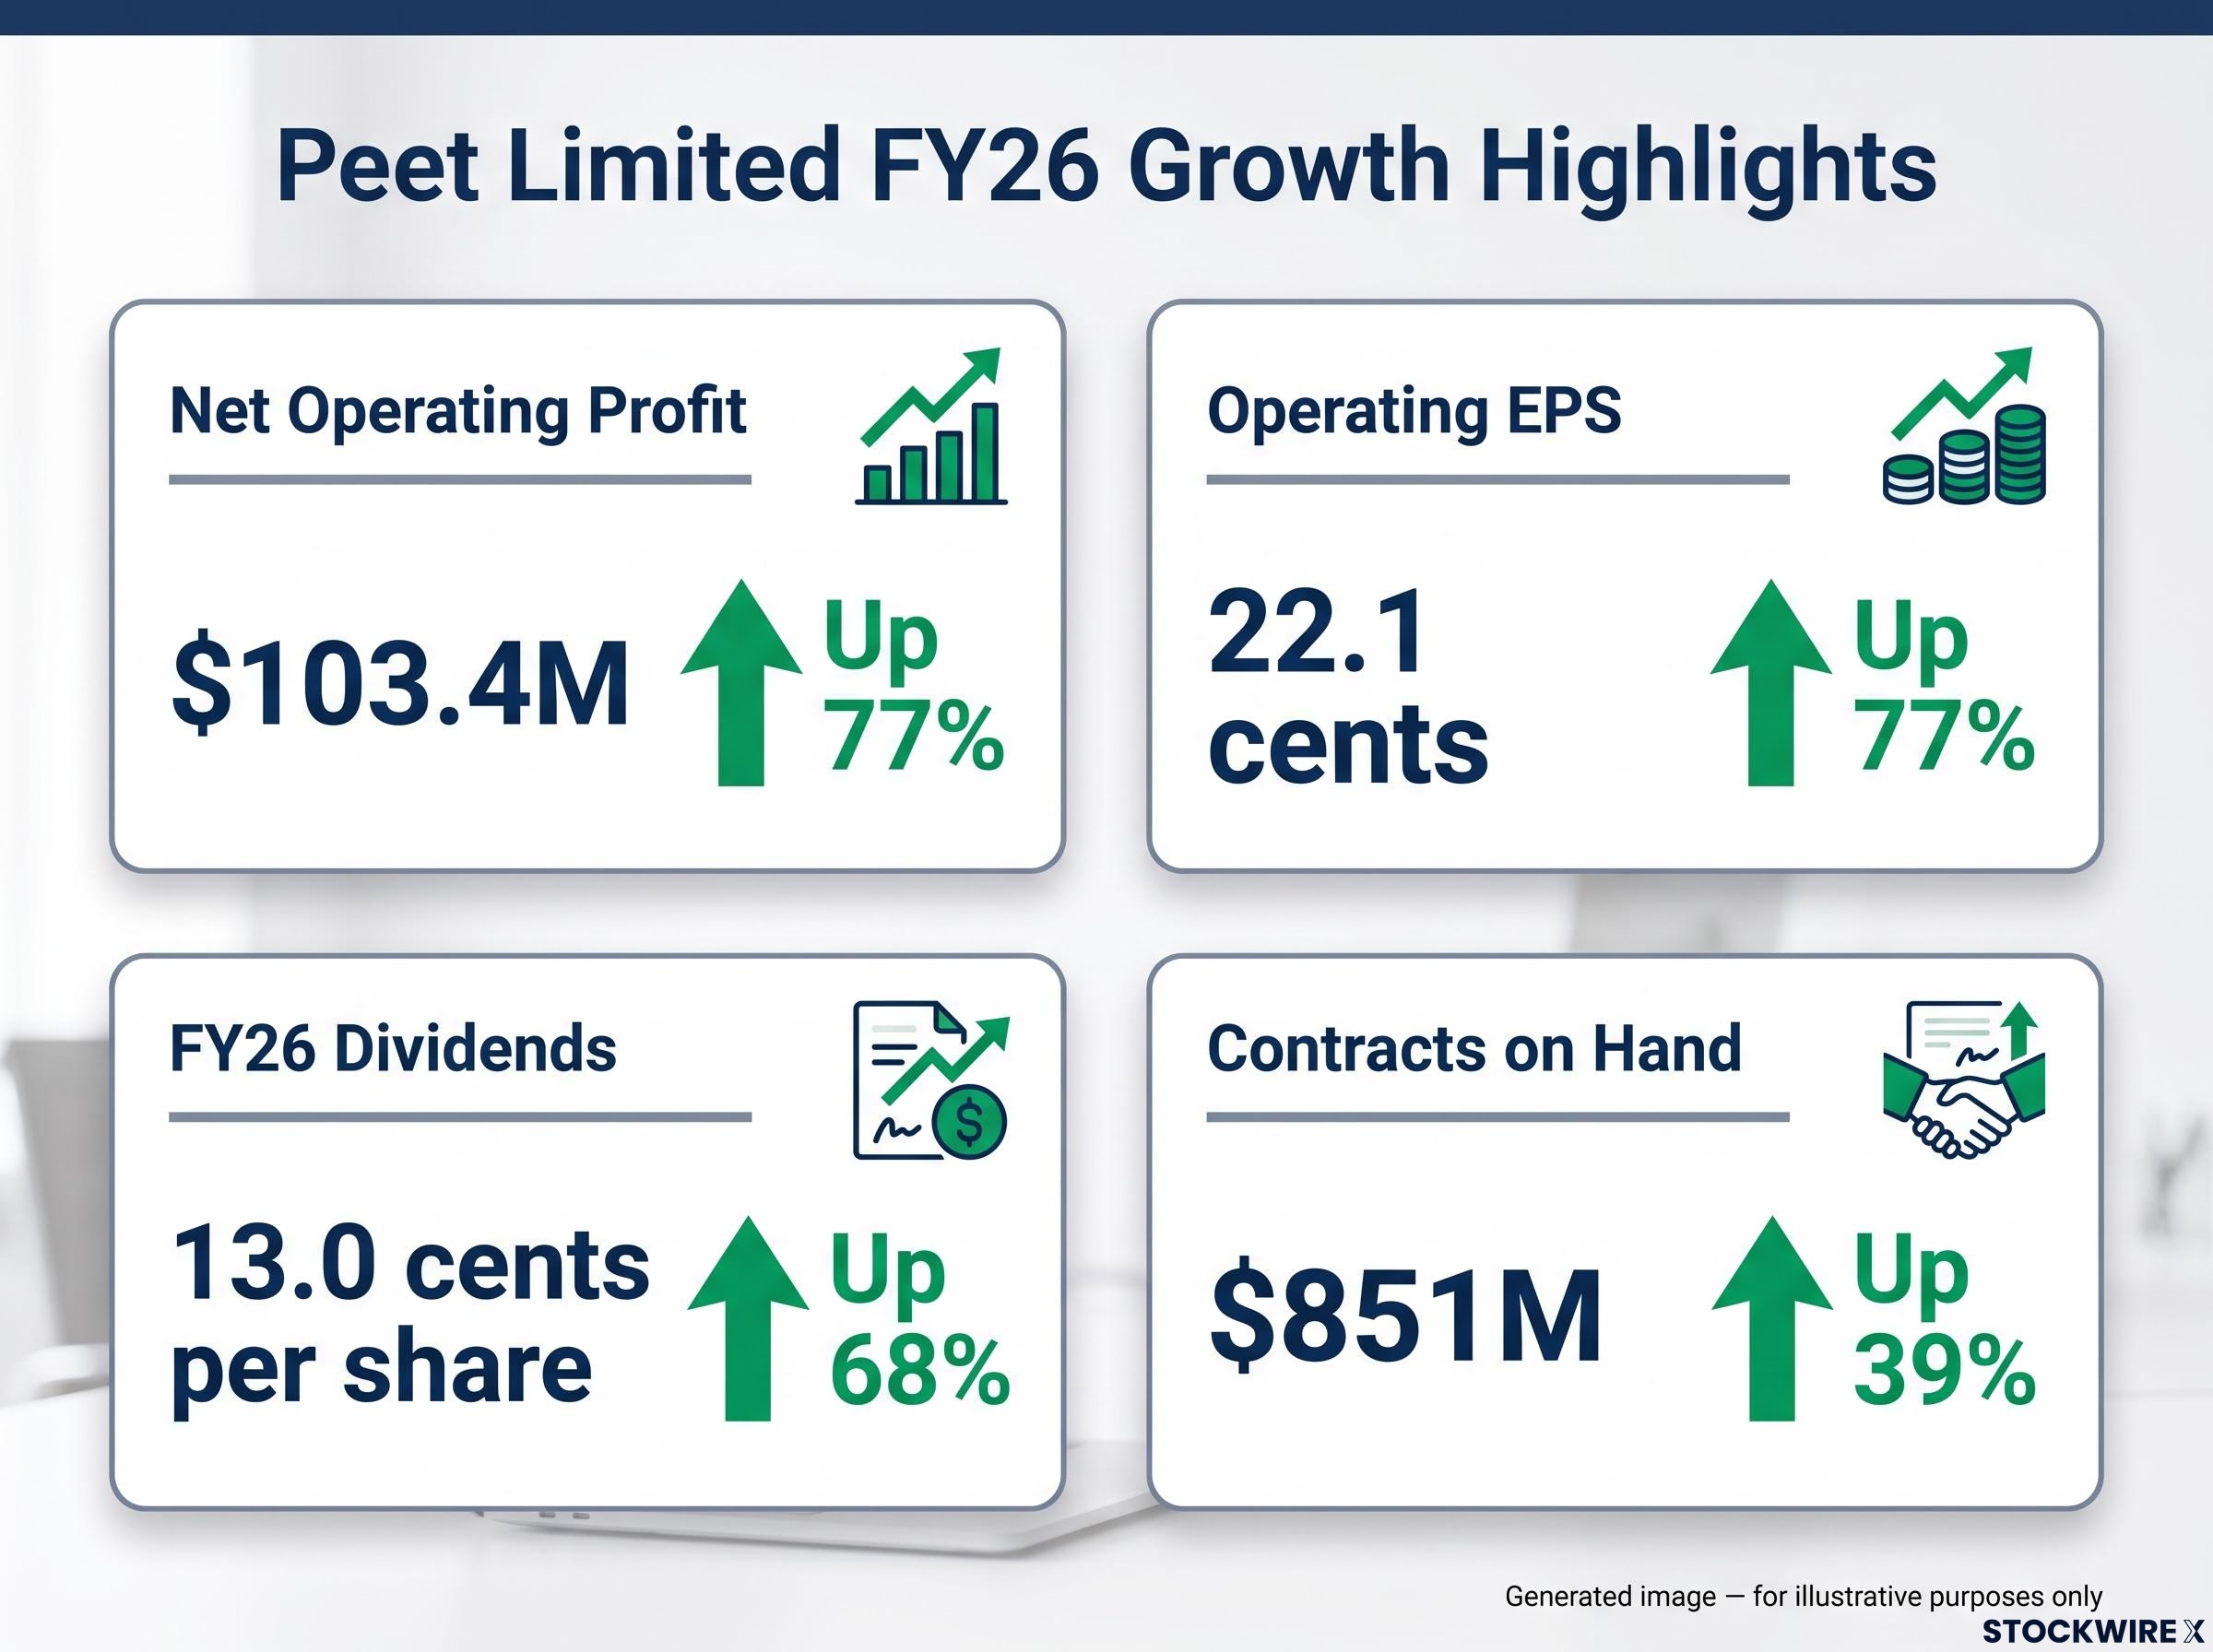
The residential land developer recorded net operating profit of $103.4 million, a 77% increase, alongside a substantial lift in dividends. Key headline figures for the period included:
-
Net operating profit: $103.4M, up 77%
-
Operating earnings per share (EPS): 22.1 cents, up 77%
-
FY26 dividends: 13.0 cents per share, fully franked, up 68%
-
EBITDA margin: 36%
-
Contracts on hand: $851M, up 39%
When big ASX news breaks, our subscribers know first
FY26 financial results at a glance
The full financial scorecard reflected strong period-on-period growth across earnings, margins and shareholder returns, supported by a modest increase in revenue.
| Metric | FY26 | Movement |
|---|---|---|
| Net operating profit | $103.4M | Up 77% |
| Revenue | $450.2M | Up 3% |
| EBITDA | $162.8M | Up 54% |
| EBITDA margin | 36% | Up 50% |
| Operating EPS | 22.1 cents | Up 77% |
| Total dividends | 13.0 cents (fully franked) | Up 68% |
| NTA per share | $1.49 | Up 9% |
Revenue of $450.2 million comprised statutory revenue of $419.1 million and a $31.1 million share of net profits from associates and joint ventures. Peet noted that the non-IFRS measures used in the result have not been audited or reviewed by EY.
The 1H FY26 result had already signalled the trajectory, with Peet reporting a 102% profit surge to $50.9 million at the half-year mark and upgrading its full-year guidance to the $86-90 million range, a forecast the full-year outcome ultimately exceeded.
Balance sheet strengthens as gearing falls to 24.8%
Peet maintained a strong balance sheet throughout FY26, with net debt reduced to $201.3 million at 30 June 2026, down from $243.6 million a year earlier. The improvement was supported by strong operating cash generation from Developments and higher distributions from Funds Management projects.
During the year, the Company completed the early repayment of $75 million of Peet Notes, reducing debt costs and improving financial flexibility. Cash and available debt facility headroom of approximately $260 million provides capacity to fund the current portfolio and future growth initiatives.
Gearing reduced to 24.8%, remaining comfortably within the Group’s target range of 20% to 30%, while interest cover improved to 7.6 times.
Brett Fullarton, Chief Executive Officer
“FY26 represents another exceptional year for Peet, with record operating profit, significant earnings growth and increased returns to shareholders. The result reflects the strength of our national portfolio, favourable conditions across several of our key markets and the disciplined execution of our strategy.”
Sales momentum and a $11.5 billion development pipeline
Operational performance during the year reflected continued demand across the Group’s key markets, with the development pipeline remaining a central feature of the business.
FY26 sales and settlements
-
Lots sold: 2,996, up 8%, largely driven by strong market conditions in Western Australia and improving activity in Victoria.
-
Lots settled: 2,665, up 1%, supported by strong demand across Western Australia and Queensland.
Development pipeline depth
-
More than 26,400 lots across 37 projects.
-
Estimated end value of approximately $11.5 billion (gross development value).
-
Activated pipeline increased to 80%.
-
Long-life projects including Flagstone City (QLD), Onderra (ACT, formerly the University of Canberra project), Brabham (WA), Googong (NSW) and Aston (VIC).
The Group described its pipeline as a key competitive advantage, with its long-life portfolio providing earnings visibility over the coming decade.
What “contracts on hand” and “activated pipeline” mean for investors
Contracts on hand of $851 million, up 39%, represent revenue that has been contracted but is awaiting completion, providing visibility into FY27 earnings.
Activation occurs when a project is launched, at which point all lots in that project are considered activated (per the company’s definition). Peet’s activated pipeline rising to 80% signals that a larger share of its portfolio is generating, or is ready to generate, sales.
Together, these measures point to forward earnings visibility.
Peet’s outlook heading into FY27
Peet outlined a positive outlook in the result, entering the new financial year with momentum from its contract position and activated pipeline. Key points from the outlook included:
-
Entering FY27 with $851 million of contracts on hand and a highly activated pipeline.
-
Solid demand across Western Australia, Queensland and South Australia, with the Company well placed to benefit as conditions improve in Victoria and NSW/ACT.
-
Favourable structural housing fundamentals, including population growth, constrained housing supply, positive labour market conditions and government policies supporting first home buyers and investors in the new homes sector.
-
Ongoing monitoring of cost-of-living pressures, interest rate movements and broader macroeconomic factors, though Peet expects long-term residential market drivers to remain supportive.
The Board declared a final fully franked dividend of 6.5 cents per share, payable on 22 September 2026.
Peet stated it remains well positioned to target growth in FY27, supported by its strong balance sheet, established development pipeline, high level and visibility of contracts on hand and demand across key residential markets, with outcomes subject to prevailing market conditions and settlement timing.
Don’t Miss the Next Real Estate Winner on the ASX
Big News Blast delivers FREE breaking ASX news straight to your inbox within minutes of release, complete with in-depth analysis. Join 20,000+ investors already staying ahead of the market. Click the “Free Alerts” button at Big News Blast to get the next market-moving announcement the moment it drops.