
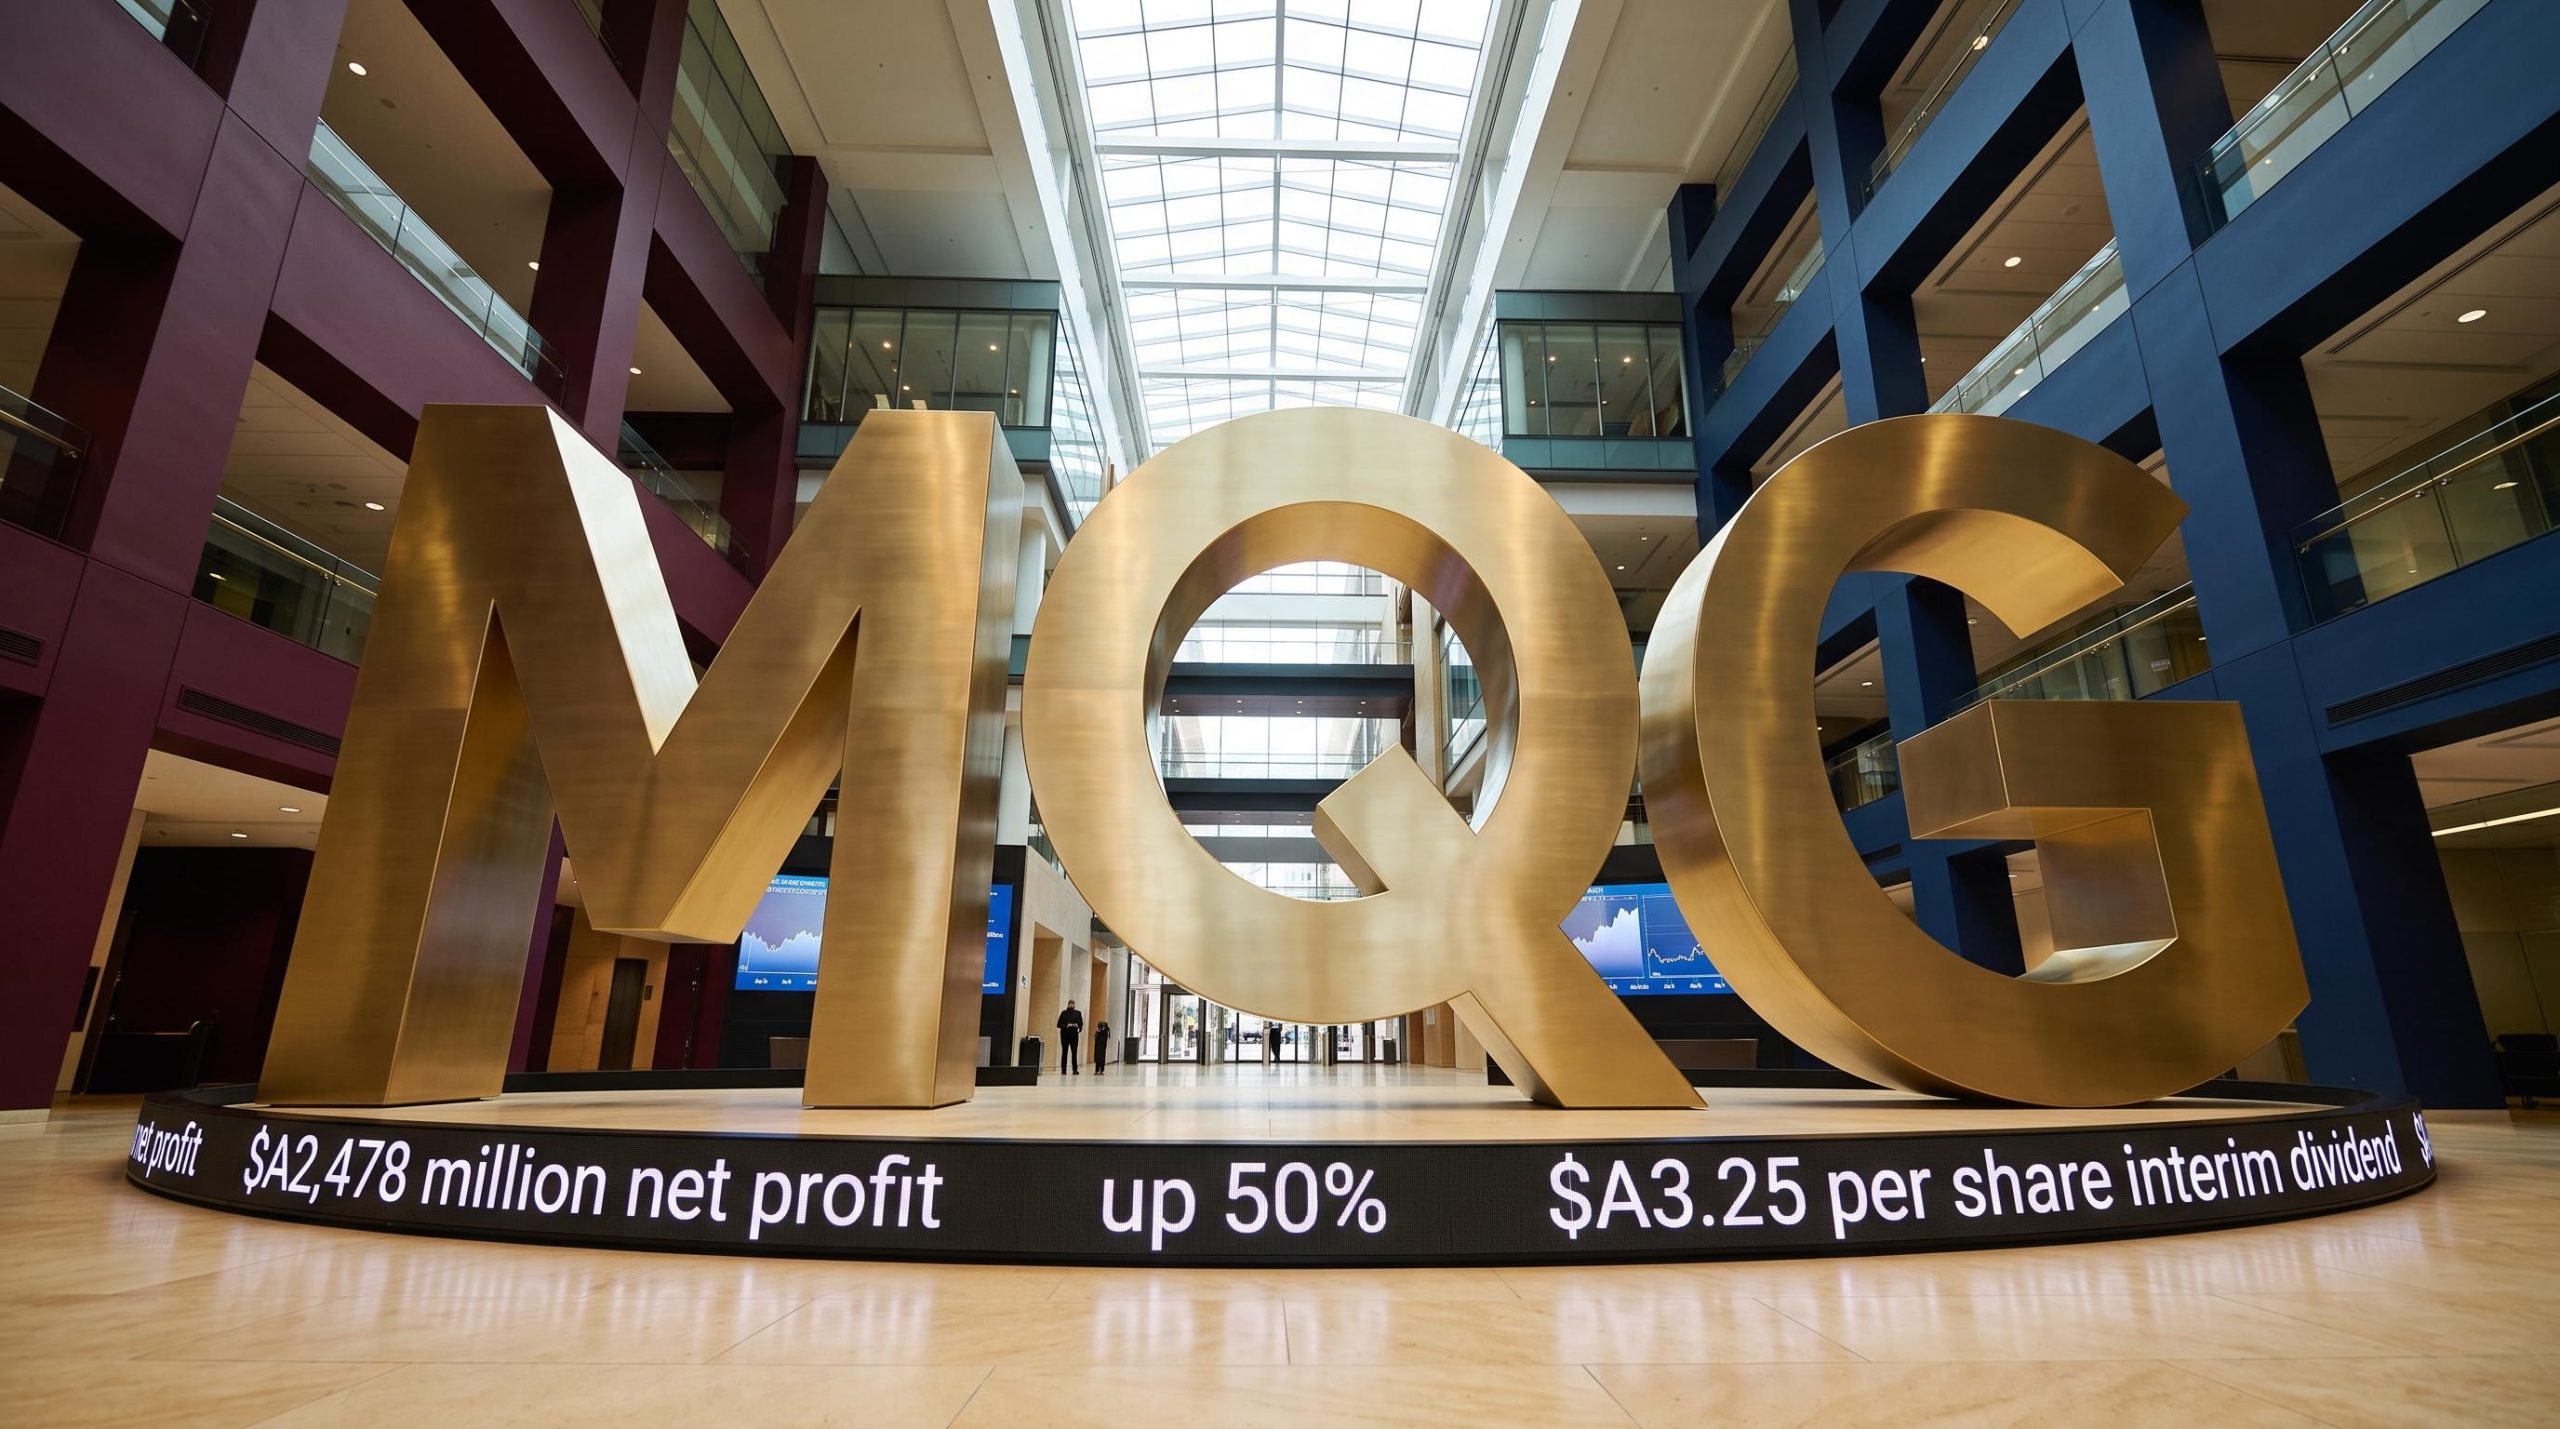
Macquarie posts $A2,478 million 1H27 net profit, up 50%
In its half-year result for the six months to 30 September 2026 (1H27), Macquarie Group (ASX: MQG) reported a net profit after tax attributable to ordinary shareholders of $A2,478 million. That was up 50% on 1H26 and down 22% on the half year ended 31 March 2026 (2H26).
Earnings per share came in at $A6.52, up 49% on 1H26, while annualised return on equity was 13.8%, compared with 14.0% in FY26. Net operating income of $A9,568 million was up 10% on 1H26 and down 11% on 2H26. Operating expenses of $A6,317 million were up 1% on 1H26 and down 3% on 2H26.
The result was released on 6 November 2026 and was the last before Managing Director and Chief Executive Officer Shemara Wikramanayake’s retirement.
Shemara Wikramanayake, Managing Director and Chief Executive Officer
“The strength of the result reflects the diversity of our businesses, the depth of our expertise to navigate less certain market conditions and our teams’ ability to identify opportunities and deliver for our clients…”
Earnings sit well above the prior corresponding period, though the sequential decline against 2H26 is clear in both profit and income.
The 2H26 comparison reflects a record second half in which earnings jumped 93% on the first half, a high base that makes the sequential decline in 1H27 easier to place in context.
When big ASX news breaks, our subscribers know first
Operating group performance across the four divisions
Macquarie reported net profit contributions from four operating groups. Net profit contribution is management accounting profit before unallocated corporate items, profit share and income tax.
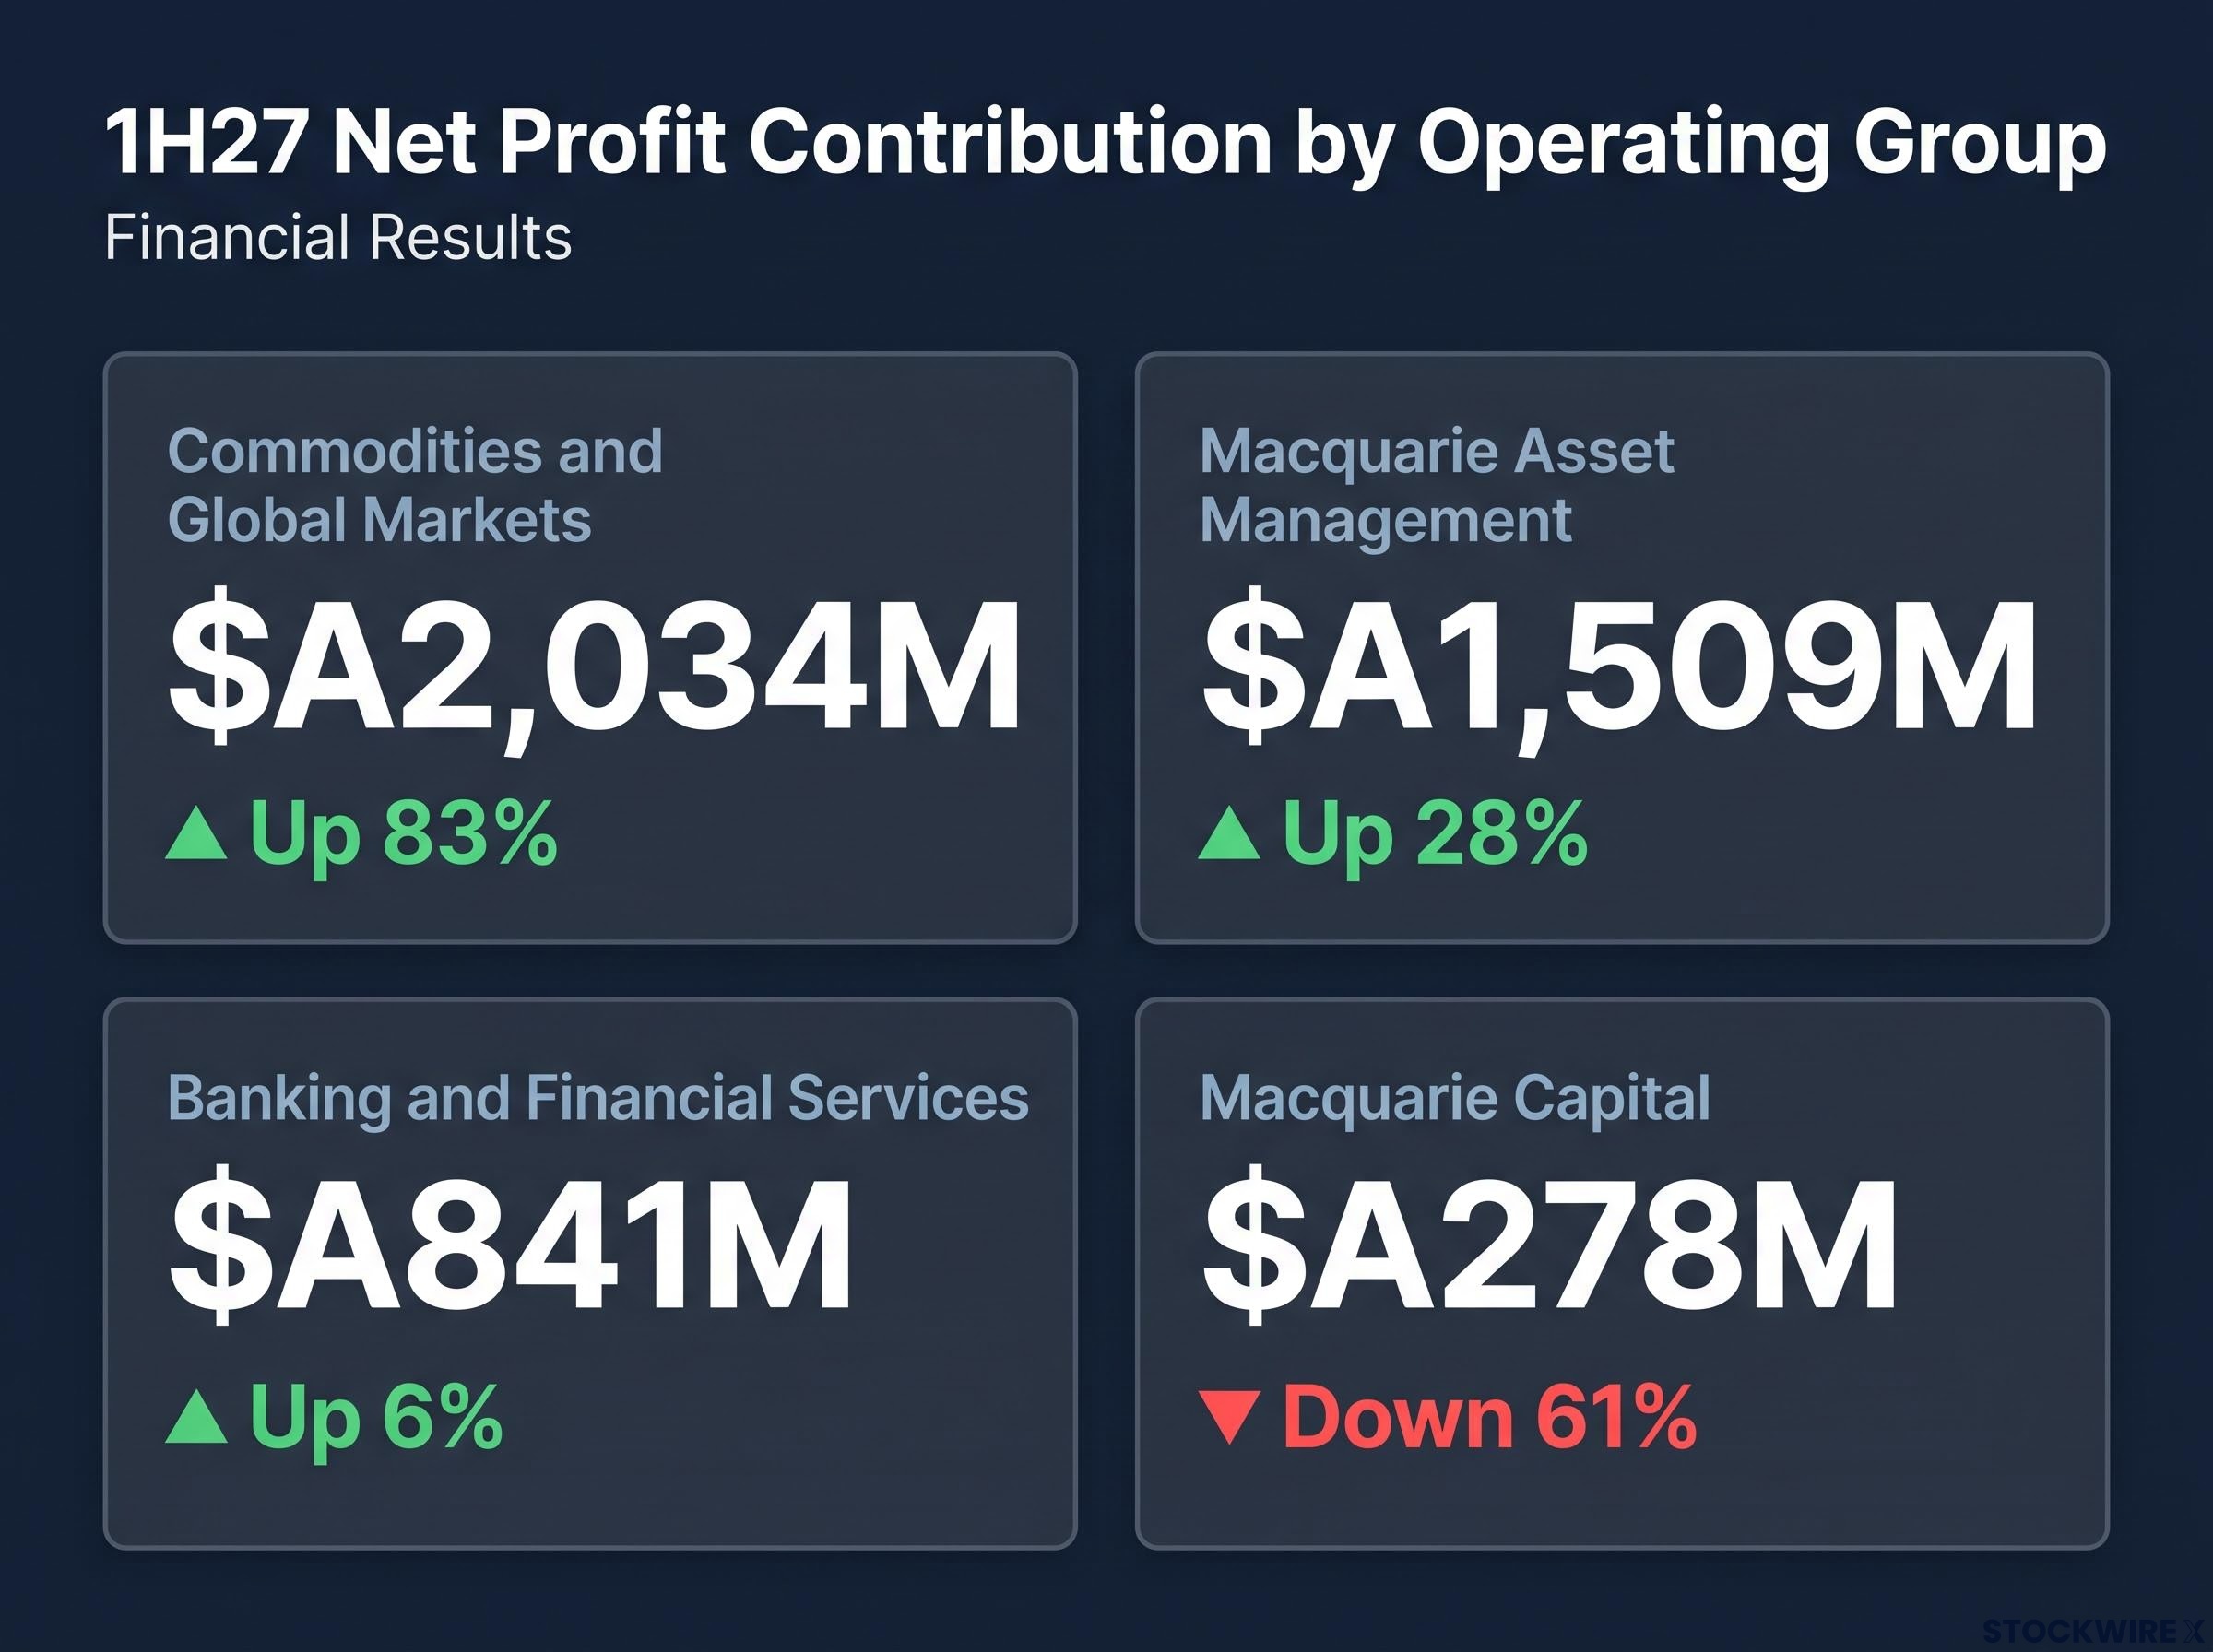
| Operating Group | 1H27 net profit contribution | 1H26 | Change | Key driver |
|---|---|---|---|---|
| Macquarie Asset Management | $A1,509M | $A1,175M | Up 28% | Gain on sale of Macquarie AirFinance, partially offset by lower performance fees |
| Banking and Financial Services | $A841M | $A793M | Up 6% | Loan portfolio and BFS deposit growth, partially offset by lower margins, higher credit provisions and higher expenses |
| Commodities and Global Markets | $A2,034M | $A1,113M | Up 83% | Higher net interest and trading income across all major business lines, plus asset sales in Asset Finance |
| Macquarie Capital | $A278M | $A711M | Down 61% | Lower investment-related income and lower mergers and acquisitions fees, partially offset by higher brokerage income |
What drove the swing
The two largest movements pointed in opposite directions:
- Commodities and Global Markets rose 83%, with higher net interest and trading income across all major business lines, due to increased client activity and trading opportunities across specific commodities and financial markets.
- Macquarie Capital fell 61%, reflecting lower investment-related income primarily driven by timing of asset realisations, and lower mergers and acquisitions fees.
Macquarie Asset Management also saw lower performance fees due to the timing of asset realisations, offset by the gain on sale of Macquarie AirFinance. Income spread across several divisions is the central point for investors, as strength in one area offset weakness in another.
Capital, funding and the 1H27 interim dividend
Macquarie stated its financial position exceeds the Australian Prudential Regulation Authority’s (APRA) Basel III regulatory requirements.
Balance sheet strength
Key Bank Group measures at 30 September 2026 were:
- CET1 ratio (APRA Basel III Level 2): 12.9% (Harmonised: 17.7%), up from 12.8% (Harmonised: 17.5%) at 31 March 2026.
- APRA Leverage Ratio: 4.4% (Harmonised: 4.9%).
- Liquidity Coverage Ratio (LCR): 187%.
- Net Stable Funding Ratio (NSFR): 116%.
Total deposits increased to $A244.2 billion, up 10% from $A221.5 billion at 31 March 2026. A further $A16.3 billion of new term funding was raised during the first half, covering a range of tenors, currencies and product types.
Interim ordinary dividend
The Board announced a 1H27 interim ordinary dividend of $A3.25 per share (35% franked), representing a payout ratio of 50%. That compares with the 1H26 interim of $A2.80 (35% franked) and the 2H26 final of $A4.20 (35% franked).
Macquarie’s dividend policy is an annual payout ratio of 50 to 70 per cent. For what each date means, see how to read an ASX dividend announcement.
A capital position above regulatory requirements sits alongside the dividend and the company’s cautious stance.
Education: how to read a bank and non-bank group result like Macquarie’s
Net profit contribution shows how much each division earned before costs that sit across the group, such as unallocated corporate items, profit share and income tax. It allows readers to compare divisions, though the divisional figures are not the same as group net profit.
CET1 stands for Common Equity Tier 1, a measure of a bank’s core capital. Macquarie reports it in APRA and Harmonised forms. Harmonised estimates follow the updated Basel Committee on Banking Supervision (BCBS) Basel III framework, but Macquarie Bank Limited is not regulated by the BCBS, so those ratios are indicative only. Basel III applies only to the Bank Group and not the Non-Bank Group.
Timing matters for results. Both Macquarie Asset Management and Macquarie Capital cited the timing of asset realisations, which is when investments are sold, as a factor in their results. Income can therefore move between periods depending on when those sales occur.
Outlook and what happens next for Macquarie
Greg Ward, Managing Director and Chief Executive Officer Designate, provided the outlook. Macquarie continues to maintain a cautious stance, with a conservative approach to capital, funding and liquidity.
Greg Ward’s career at Macquarie spans 30 years, including 14 as Global Chief Financial Officer and a long tenure leading the banking and financial services franchise, which the Board has positioned as a platform for the next phase of growth.
Factors that may influence the short-term outlook include:
- Market conditions, including global economic conditions, inflation and interest rates, significant volatility events, and the impact of geopolitical events.
- Completion of period-end reviews and the completion of transactions.
- The geographic composition of income and the impact of foreign exchange.
- Potential tax or regulatory changes and tax uncertainties.
Greg Ward, Managing Director and Chief Executive Officer Designate
“Macquarie remains well-positioned to deliver superior performance in the medium term with established, diverse income streams…”
Dated events tied to the interim dividend are:
- The record date for the interim ordinary dividend is 12 November 2026.
- The Dividend Reinvestment Plan (DRP) pricing period is the eight business days from 18 November 2026 to 27 November 2026, with DRP shares issued at a discount to the prevailing market price of 1.5 per cent. The shares may be purchased on-market in part or in full if issuing becomes impractical or inadvisable.
- The payment date for the interim ordinary dividend is 17 December 2026.
Stay Ahead on Financials News Before the Market Moves
Get FREE breaking ASX news delivered to your inbox within minutes of release, complete with in-depth analysis. Join 20,000+ investors already receiving real-time alerts from Big News Blast. Click the “Free Alerts” button to be first to know when the next market-moving financials announcement lands.