

In its FY26 full year results summary for the year to 30 September 2026, National Australia Bank (NAB) reported cash earnings of $6,141m, down 13.4% on FY25. Statutory net profit was $6,143m.
The headline reflects large notable items rather than weaker trading. Excluding them, cash earnings were $7,090m, flat on FY25, while underlying profit grew 6.9%.
FY26 results: underlying profit up 6.9% as large notable items cut cash earnings 13.4%
NAB declared a final dividend of 85 cps, 100% franked. Total dividends for the year were 170 cps, flat on FY25, and the Group Common Equity Tier 1 (CET1) ratio ended the year at 11.87%.
Large notable items (LNIs) were $1,347m before tax and $949m after tax. They sit in operating expenses and in the Corporate Functions and Other division.
NAB CEO Andrew Irvine described the year as one of momentum alongside a deliberate build in resilience.
Andrew Irvine, NAB CEO
“In FY26 we delivered good momentum while taking deliberate steps to strengthen our resilience, positioning us to continue growing and supporting customers…”
Key FY26 numbers at a glance
The table below compares FY26 with FY25 on a cash earnings basis, using the source figures.
| Metric | FY26 | FY25 | Change |
|---|---|---|---|
| Net operating income | $22,014m | $20,813m | 5.8% |
| Net interest income | $18,512m | $17,398m | 6.4% |
| Credit impairment charge | $1,547m | $833m | 85.7% |
| Cash earnings | $6,141m | $7,091m | (13.4%) |
| Cash earnings excluding LNIs | $7,090m | $7,091m | Flat |
| Cash ROE excluding LNIs | 11.4% | 11.4% | Flat |
When big ASX news breaks, our subscribers know first
Business banking drives growth while credit charges weigh
Volume growth in business banking supported income, while a higher credit impairment charge absorbed much of the gain in earnings.
Volume growth and margins
Revenue rose 5.8%, helped by volume growth and higher margins and partly offset by the translation impact of a lower New Zealand dollar. Net interest margin increased 6 bps to 1.80%, or 3 bps excluding a benefit from M&T and lower liquid assets.
Expenses excluding LNIs rose 4.5%, mainly on higher personnel costs, higher investment spend and technology-related costs. Productivity benefits, a lower New Zealand dollar and lower payroll review and customer-related remediation charges partly offset these.
NAB’s three priorities showed progress:
- Australian business lending balances rose 9.8%, supported by market share gains.
- Deposit balances rose 5.2%, including 7.4% growth in business transaction account balances across Business and Private Banking (B&PB) and Corporate and Institutional Banking (C&IB).
- Australian home lending drawdowns via proprietary channels improved to 50% in FY26 from 41% in FY25.
Divisional performance
Cash earnings excluding LNIs were mixed by division.
| Division | FY26 cash earnings ex LNIs | Change v FY25 |
|---|---|---|
| Business and Private Banking | $3,685m | 10.7% |
| Personal Banking | $1,362m | 8.7% |
| Corporate and Institutional Banking | $1,740m | (6.1%) |
| New Zealand Banking | NZ$1,381m | (7.0%) |
B&PB and Personal Banking both grew on higher revenue. C&IB and New Zealand Banking each reported lower earnings, primarily on increased credit impairment charges.
Credit impairment charge
The credit impairment charge was $1,547m against $833m in FY25. It comprised individually assessed charges of $1,083m, which primarily relate to customers in the C&IB and B&PB business lending portfolio, and collective provision charges of $464m.
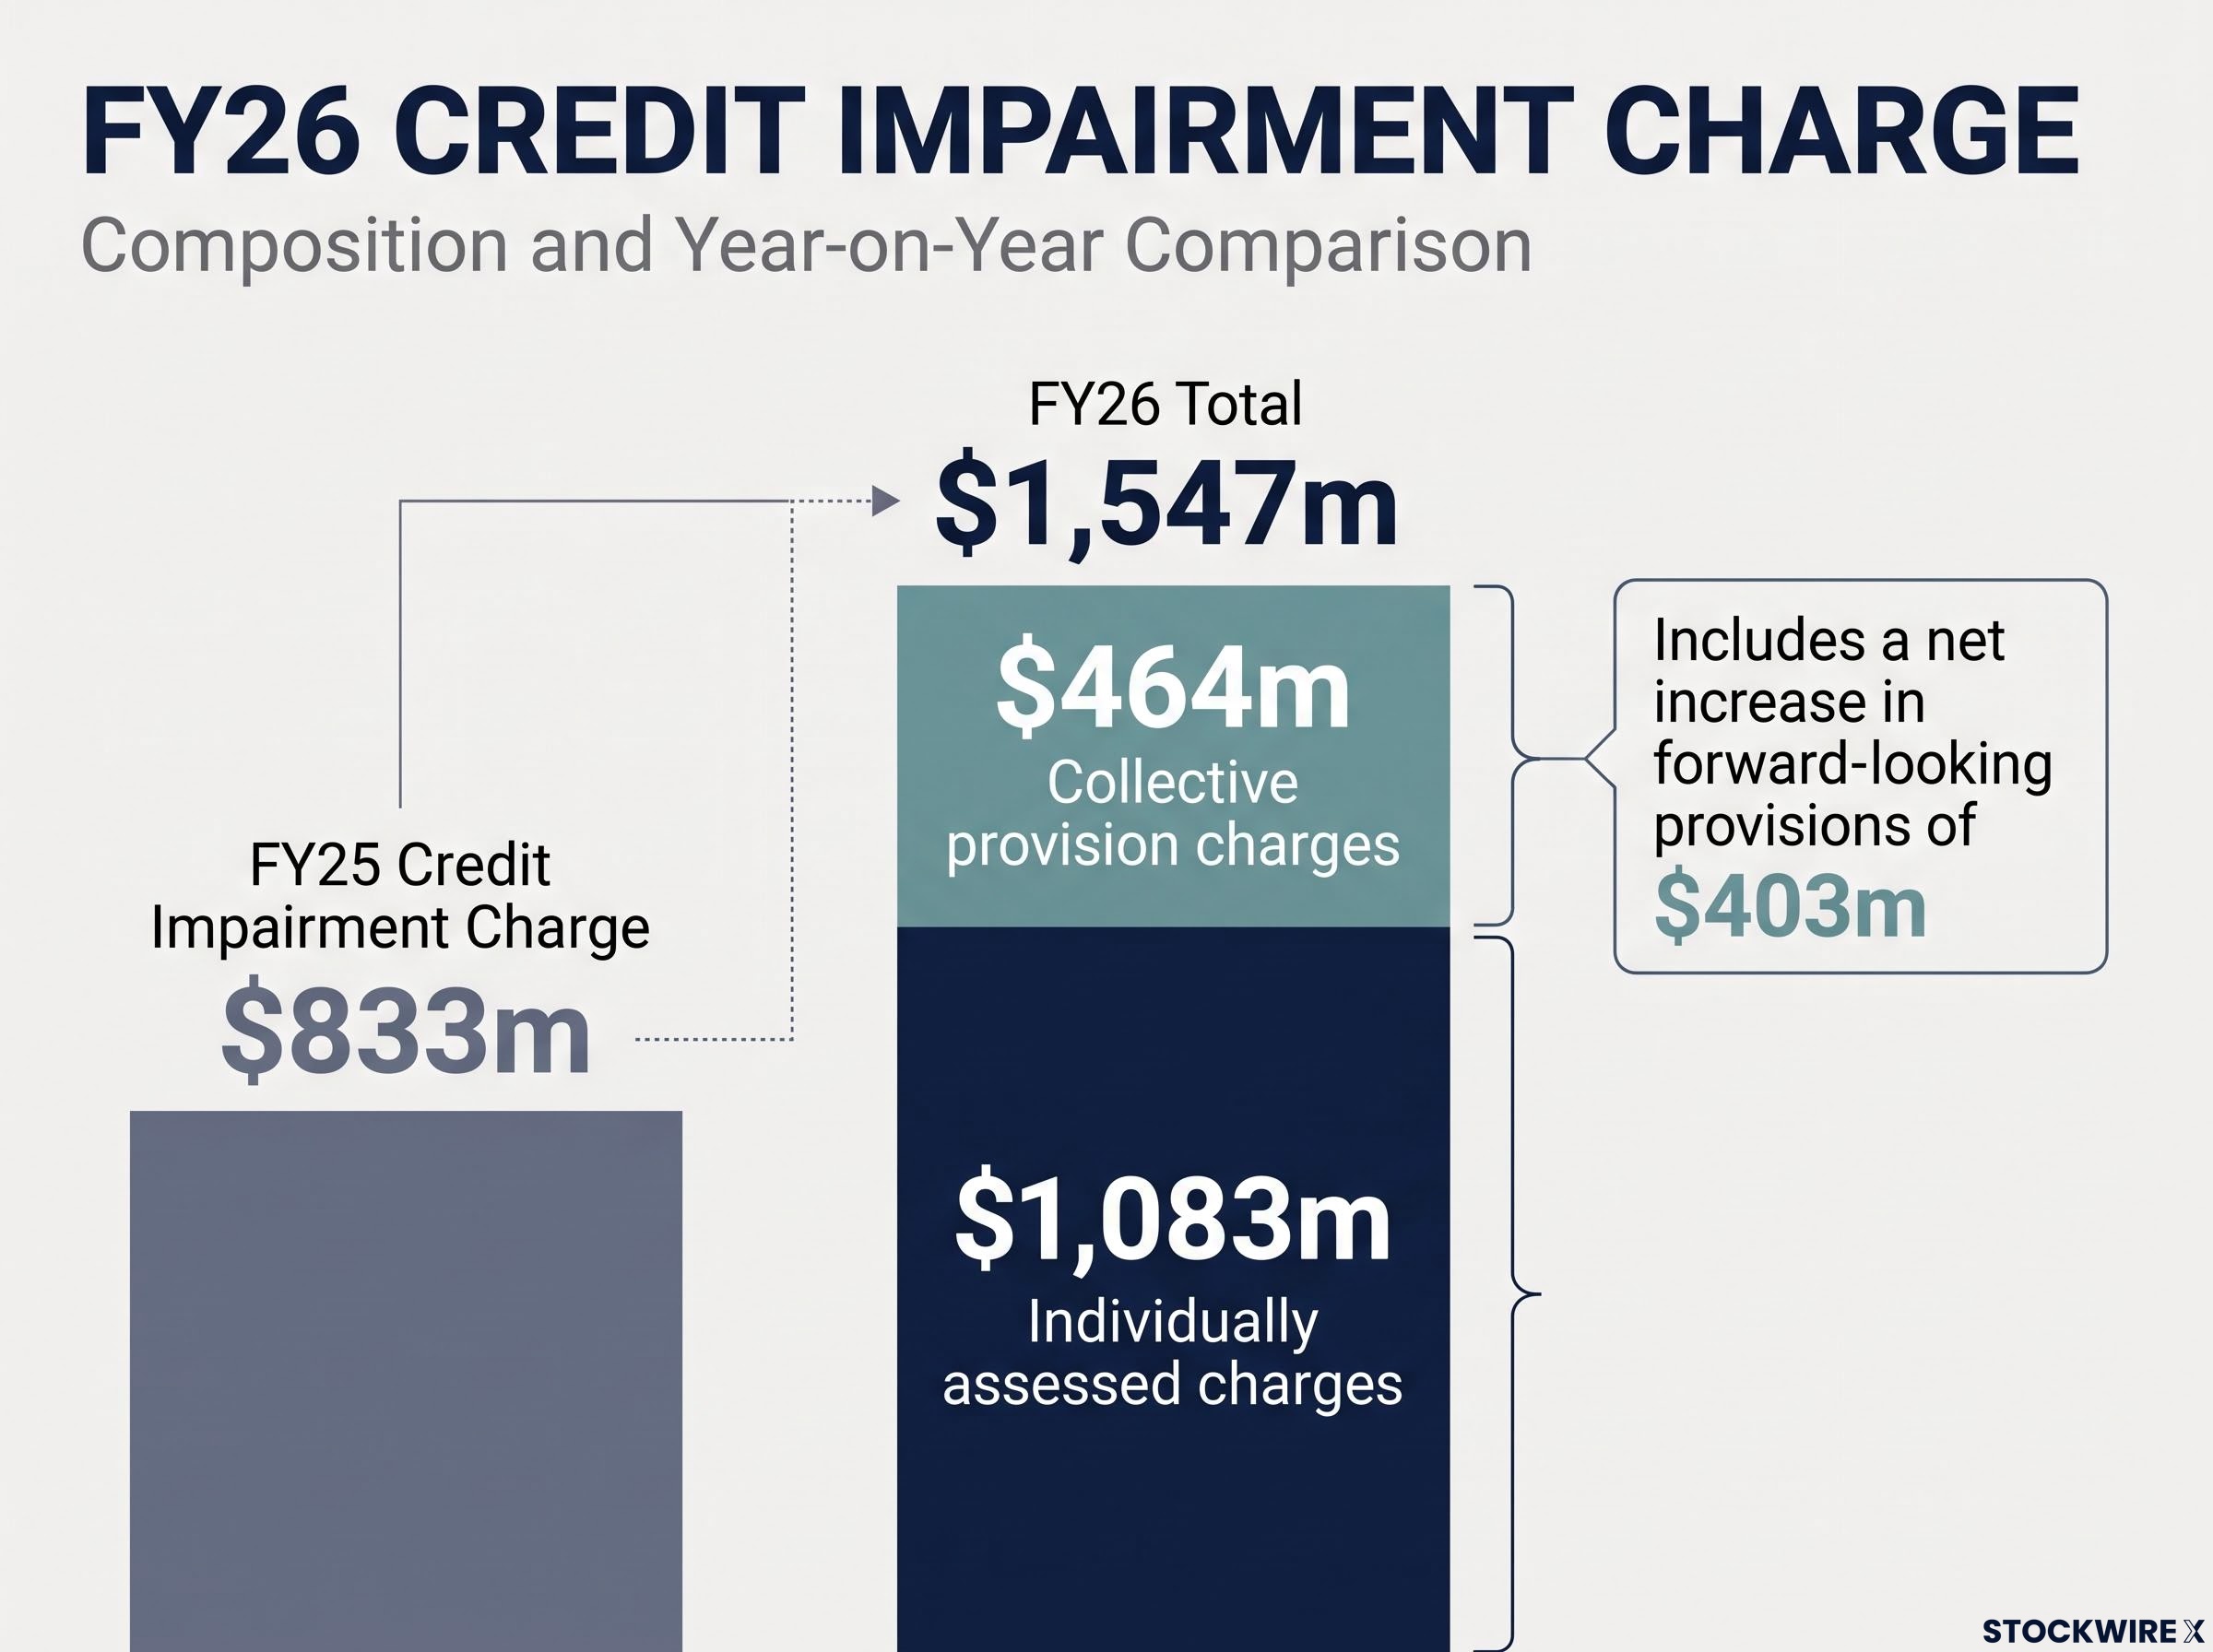
The collective charge includes a net increase in forward-looking provisions of $403m, reflecting a more challenging economic outlook. Collective provisions as a ratio of credit risk-weighted assets (CRWA) rose 7 bps to 1.40%, and total provisions represent 1.76% of CRWA.
The ratio of non-performing exposures to gross loans and advances increased 1 bp to 1.56%. The default but not impaired ratio reduced 4 bps to 1.22%.
How banks build resilience: capital, provisions and cost discipline
A CET1 ratio measures a bank’s highest-quality capital against its risk-weighted assets. Collective provisions are money set aside for expected loan losses that have not yet been tied to specific borrowers.
NAB said it strengthened provisioning to reflect an environment of slowing growth, declining house prices, higher interest rates and inflationary pressures. Its CET1 target is greater than 11.25%, and the pro forma ratio compares with that.
The balance sheet strengthening measures were first outlined in April 2026, when NAB tied the discounted DRP and a partial underwrite to a $300 million forward-looking provision build against Middle East conflict-related fuel supply risks.
NAB pointed to several steps taken in FY26:
- Group CET1 ratio of 11.87%, up 17 bps from September 2025.
- A pro forma CET1 ratio of 12.07%, reflecting the expected impact of a 1.5% discount applied to the final 2026 dividend reinvestment plan (DRP), which is expected to raise approximately $0.9 billion.
- $1.8 billion of CET1 capital raised via the FY26 interim DRP, equivalent to +41 bps.
- The sale of the Group’s remaining 20% stake in MLC Life to Nippon Life Insurance Company for $497 million, worth +11 bps.
- A change to the software capitalisation policy, so software assets are added at a lower rate and amortised more quickly.
- Action to reshape the workforce to be more efficient.
Liquidity coverage ratio (LCR) was a quarterly average of 135%, and the Net Stable Funding Ratio (NSFR) was 116%.
What FY27 looks like for NAB
Management said investment spend was held broadly stable at $1.8 billion in FY26, and productivity benefits reached $463 million. Product numbers have declined and are now 32% below FY22 levels.
The three priorities of growing business banking, driving deposit growth and strengthening proprietary home lending remain the focus.
NAB’s economic outlook is cautious for Australia. Real GDP growth is forecast to slow to 1.4% over 2026 and 1.0% over 2027. Lags in the transmission of monetary policy are likely to see official cash rates on hold at 4.85% for a while.
New Zealand is forecast to improve, with real GDP growth of 2.1% over 2026 and 2.8% over 2027.
Stated forward-looking items
- FY27 investment spend: NAB plans to invest at a similar level to FY26, which was $1.8 billion.
- FY27 underlying cost growth: expected to be less than 3%, excluding higher restructuring charges announced in October 2026 and the impact of the software capitalisation policy change.
- Final 2026 DRP: the 1.5% discount is expected to raise approximately $0.9 billion, lifting the pro forma CET1 ratio to about 12.07%.
- RBNZ cash rate: the source outlook expects a further 100 bps increase by mid 2027, after a 50 bps rise from July to 2.75%.
The restructuring behind that cost outlook involves cuts to up to 2,500 roles concentrated in corporate functions and senior management, with management saying customer-facing banking roles would not be materially affected.
For investors, the FY26 result pairs flat earnings excluding LNIs with growth in underlying profit and a stronger capital position. Credit charges and the economic outlook remain the variables to watch.
Stay Ahead on Banking and Finance News Before the Market Moves
Get FREE breaking ASX news from non-resource sectors delivered to your inbox within minutes of release, complete with in-depth analysis and the full announcement. Join 20,000+ subscribers already ahead of the market. Click the “Free Alerts” button at Big News Blast to receive alerts the moment news breaks.