
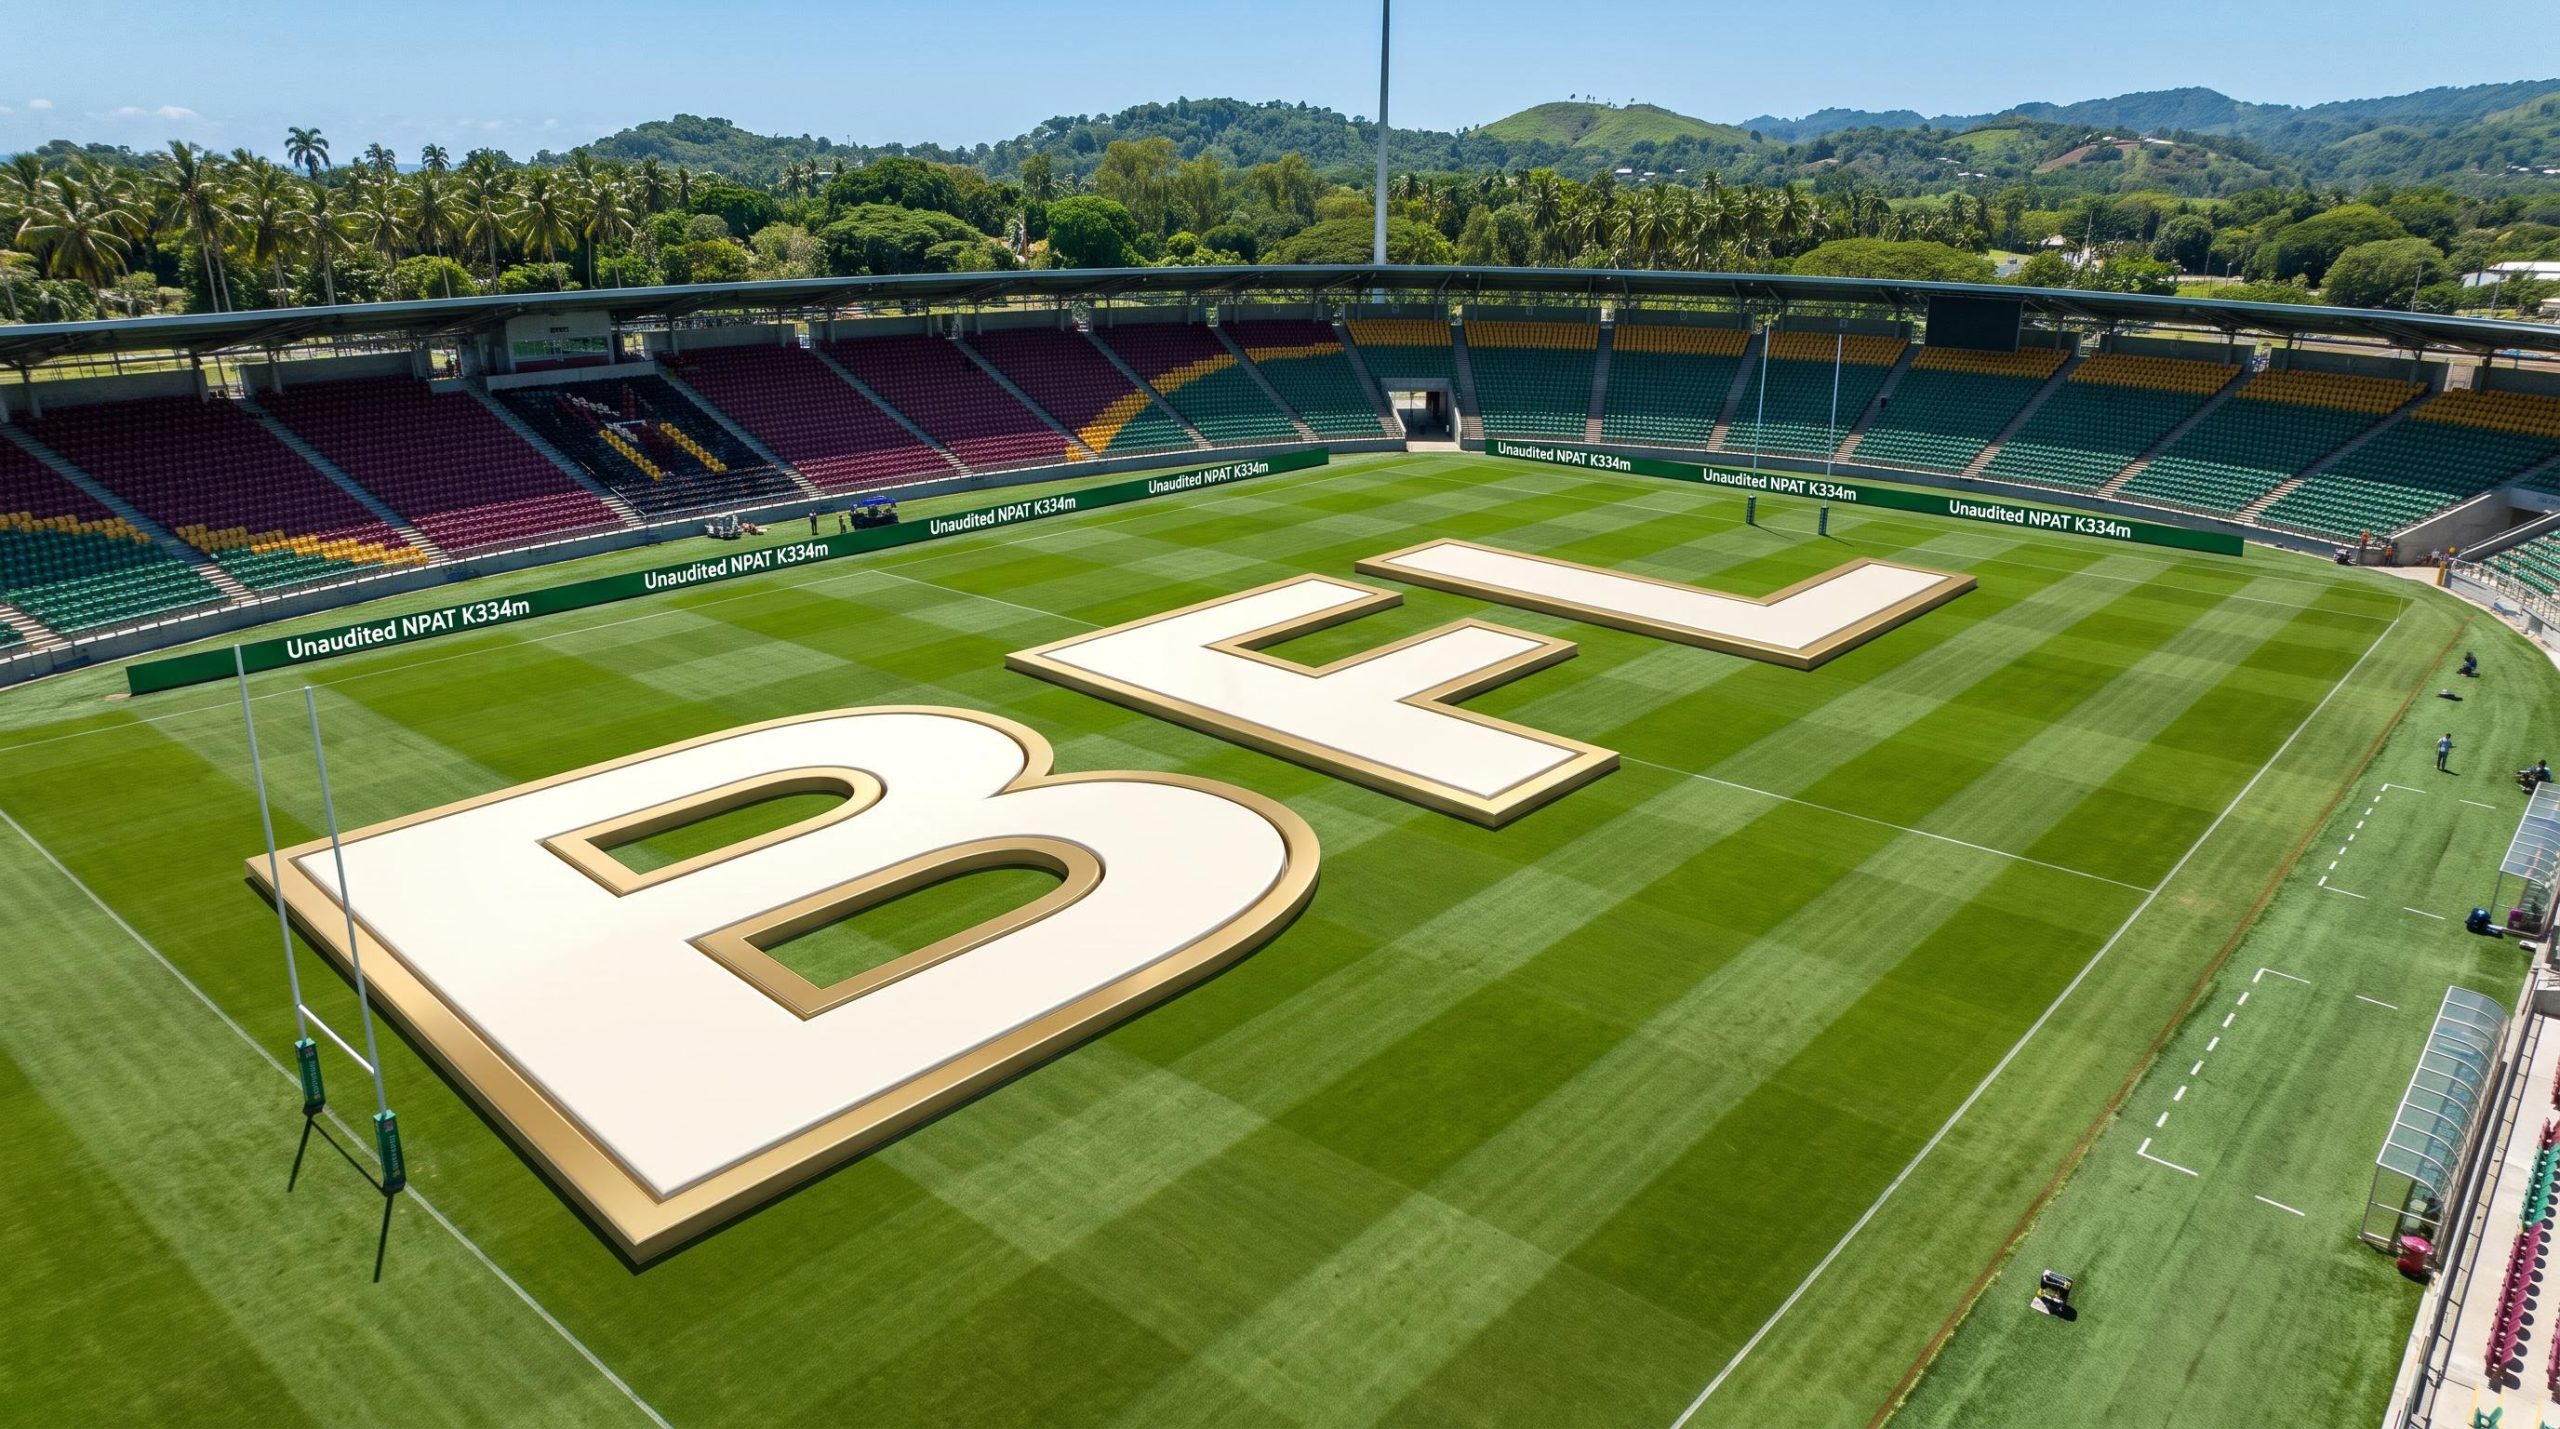
Q3 2026 results: BSP posts K334m unaudited NPAT, up 18% on the prior comparable quarter
In its third quarter of 2026 trading update for the period ended 30 September 2026, BSP Financial Group reported unaudited Net Profit after Tax (NPAT) of K334m. That was up 8% on the 1H26 quarterly average and 18% on the prior comparable quarter.
Revenue reached K997m, up 6% on the 1H26 quarterly average and 16% on the prior comparable quarter. The Cost-to-Income Ratio of 43.6% sat at the midpoint of the 42-45% target range, while annualised Return on Equity was 24.9%, up 100bps on the 1H26 quarterly average.
The group trades under ASX code BFL and PNGX code BSP. Group Chief Executive Officer Mark T. Robinson described the quarter as one of continued momentum across the group.
Operating expenses rose 5% on the 1H26 quarterly average, against NPAT growth of 8% and revenue growth of 6%. Earnings growth outpacing cost growth points to operating leverage.
Headline metrics at a glance
- Unaudited NPAT: K334m
- Revenue: K997m
- Operating expenses: K435m, up 5% on the 1H26 quarterly average
- Non-interest Income: K378m, up 6% on the 1H26 quarterly average
When big ASX news breaks, our subscribers know first
Revenue mix and profit drivers
Net Interest Income reached K619m, up 5% on the 1H26 quarterly average and 12% on the third quarter of 2025. Management said this consistent growth underscores the strength of lending across the South Pacific.
Non-interest Income showed balanced growth. FX Income was K231m, up 26% on 3Q25, and Fee Income was K127m, up 13% on 3Q25. Insurance/Other Income was K20m, down 13% on the 1H26 quarterly average.
The credit impairment charge fell to K30m from K38m on the 1H26 quarterly average. Management said credit quality remained broadly stable, with no material deterioration in provisioning trends during the quarter.
| PGK (millions) | 1H26 qtr avg | 3Q26 | Movement 3Q26 vs 1H26 qtr avg | Movement 3Q26 vs 3Q25 |
|---|---|---|---|---|
| Revenue | 943 | 997 | ▲ 6% | ▲ 16% |
| Net Interest Income | 587 | 619 | ▲ 5% | ▲ 12% |
| FX Income | 215 | 231 | ▲ 7% | ▲ 26% |
| Fee Income | 118 | 127 | ▲ 8% | ▲ 13% |
| Operating profit | 530 | 562 | ▲ 6% | ▲ 16% |
| Earnings before tax | 462 | 532 | ▲ 8% | ▲ 15% |
| Unaudited NPAT | 310 | 334 | ▲ 8% | ▲ 18% |
In Australian dollar terms, NPAT was A$107m, up 5% on the 1H26 quarterly average and 2% on 3Q25. The conversion used an average exchange rate of 0.3198 AUD=1PGK for 3Q26, compared with 0.3290 for the 1H26 quarterly average, which accounts for the smaller growth in AUD terms.
How banks make money: understanding net interest income and capital ratios
Net interest income is the difference between what a bank earns on loans and what it pays on deposits. When lending grows, this figure generally rises.
The Capital Adequacy Ratio measures a bank’s capital against its risk-weighted assets, showing how much of a buffer it holds against losses. The Leverage Ratio compares capital with total exposures without adjusting for risk, giving a simpler check on how heavily a bank is geared.
Regulators set minimum levels for both. For BSP, lending growth supported Net Interest Income in the quarter, and its capital buffers sit well above the minimums.
Balance sheet strength and capital position
Gross loans were K19.4bn at September 2026, up 1.6% on June 2026 (K19.1bn), largely driven by retail mortgages and personal lending products. Total deposits reached K37.5bn, up 3.6% on June 2026 (K36.2bn).
| Measure | Jun-26 | Sep-26 | Change | Regulatory minimum |
|---|---|---|---|---|
| Gross loans (PGK billions) | 19.1 | 19.4 | +1.6% | n/a |
| Total deposits (PGK billions) | 36.2 | 37.5 | +3.6% | n/a |
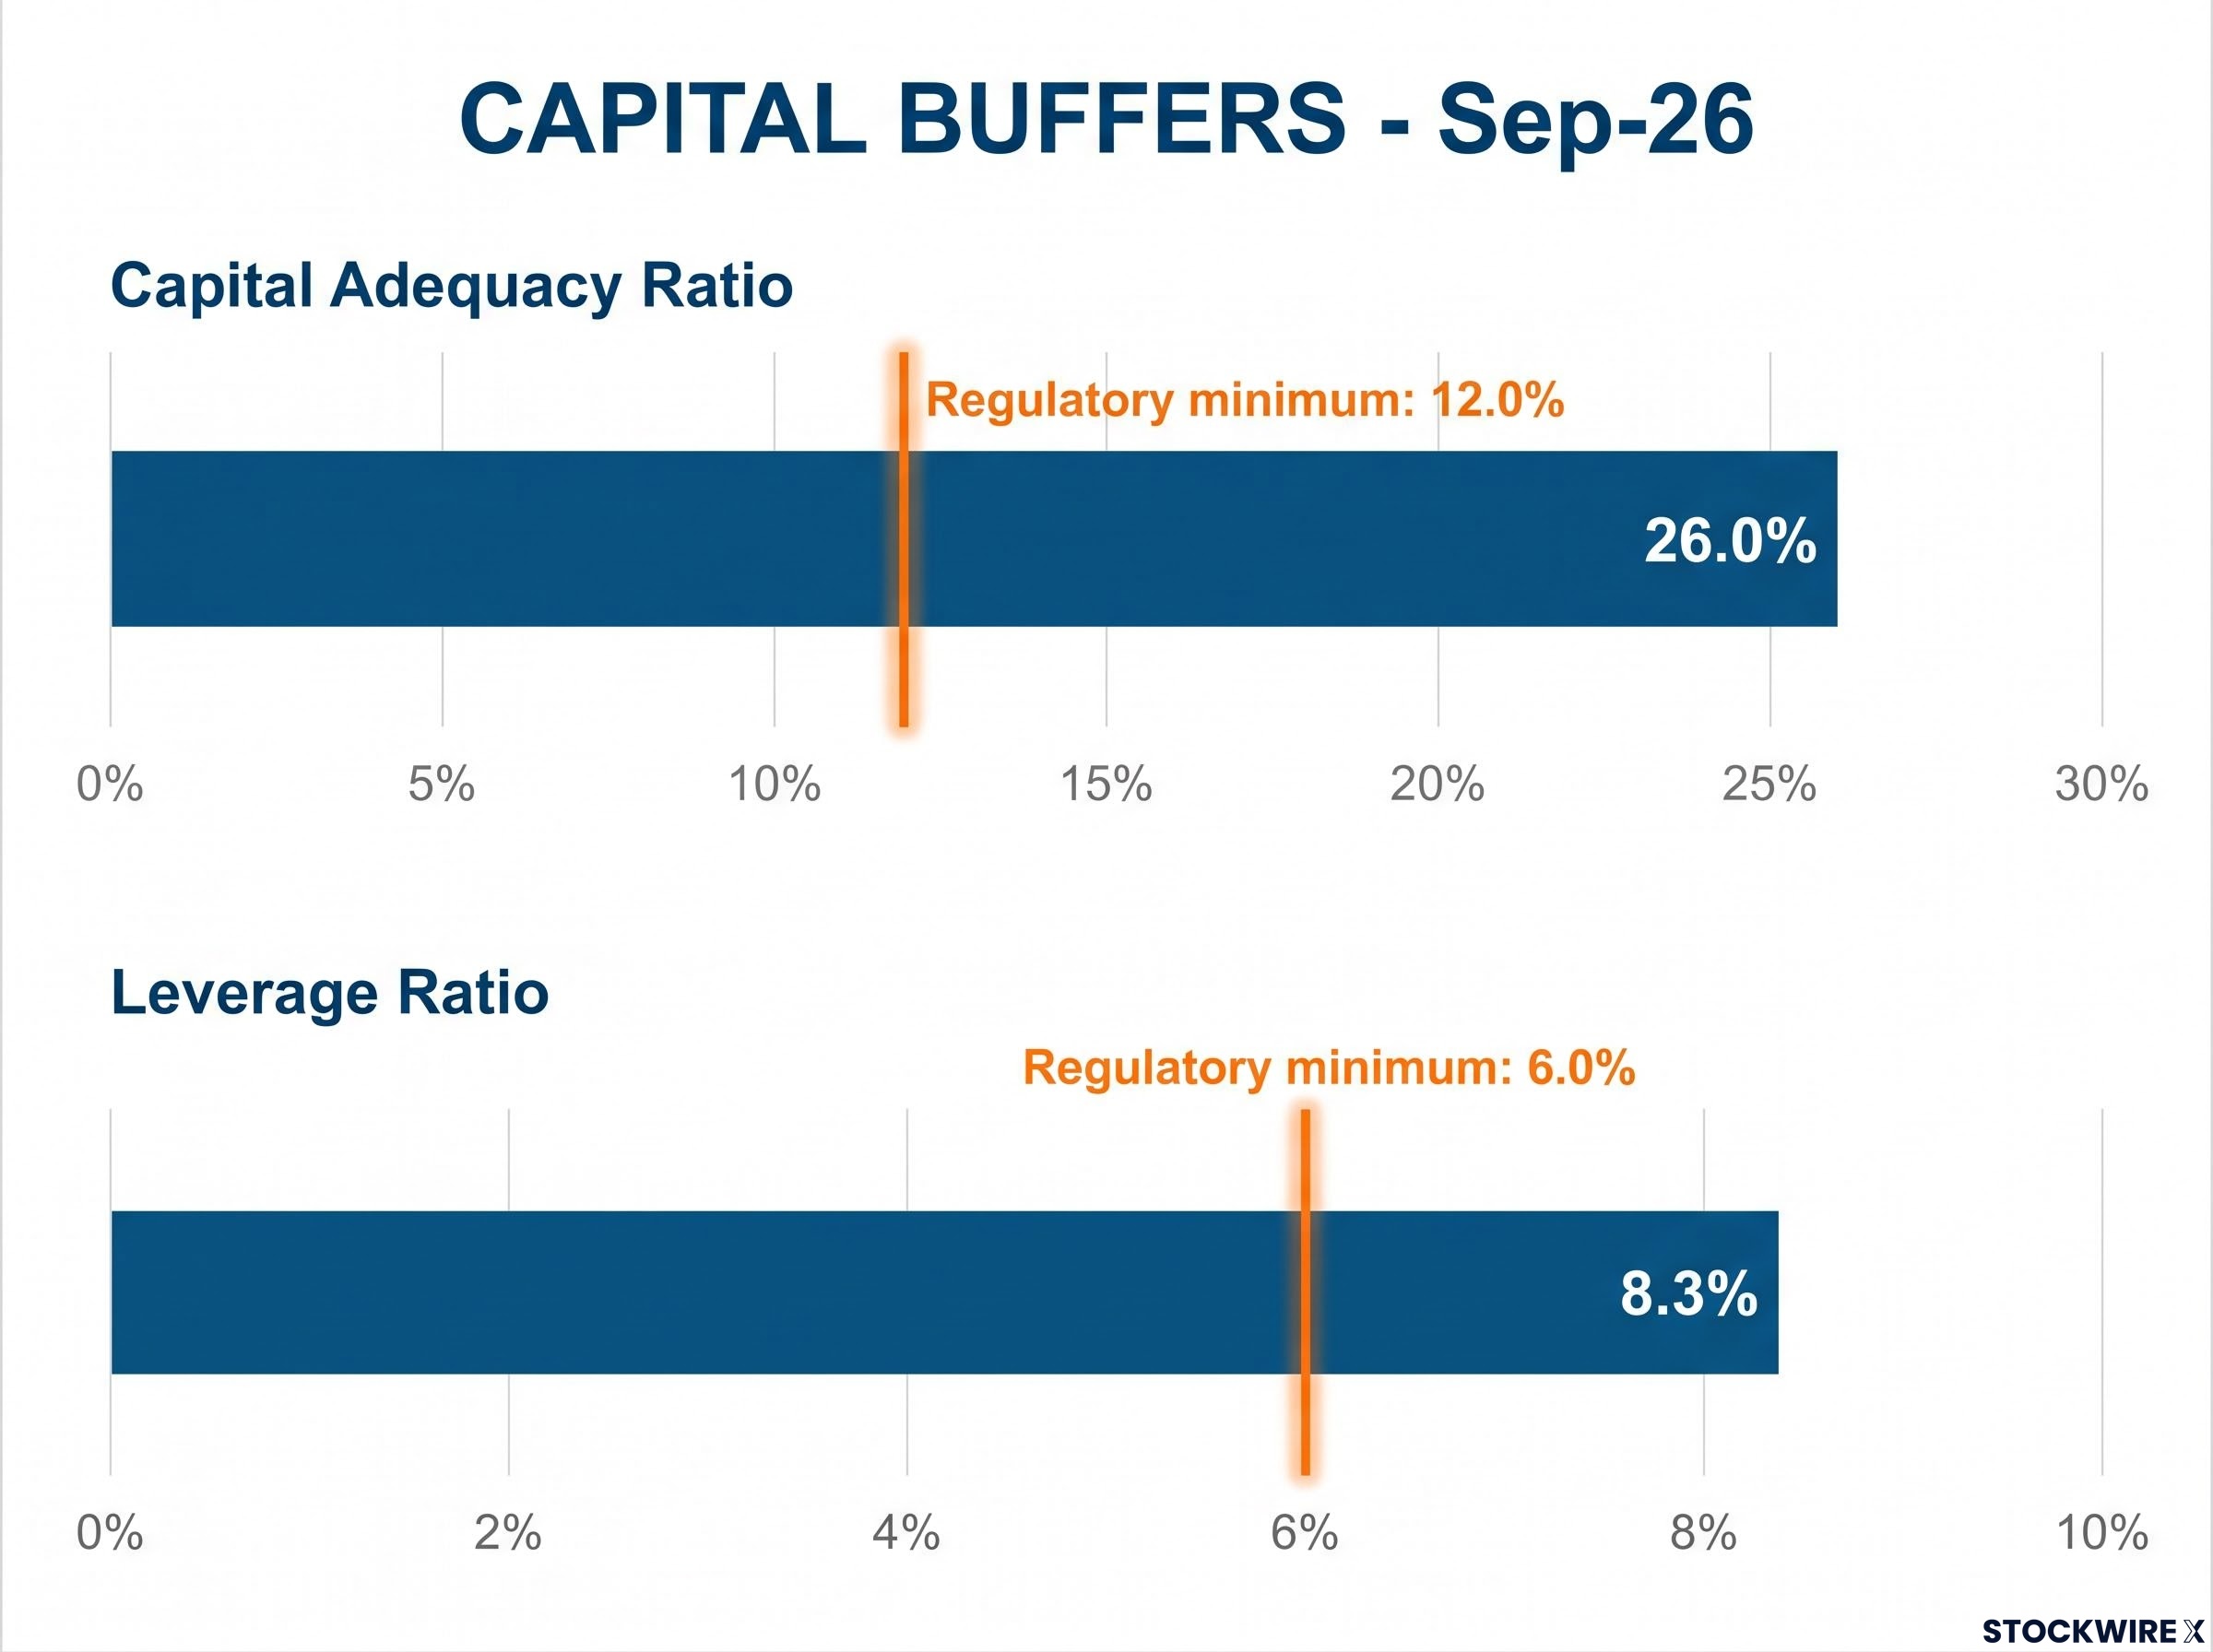
| Capital Adequacy Ratio | 25.3% | 26.0% | +70bps | 12.0% |
| Leverage Ratio | 8.9% | 8.3% | -60bps | 6.0% |
The Capital Adequacy Ratio of 26.0% is more than double the 12.0% regulatory requirement. The Leverage Ratio of 8.3% remains well above the 6.0% requirement.
BSP said the capital position reflects capacity to support customers and continued investment.
Modernising for Growth and the outlook
Management said the Modernising for Growth program is progressing well, with costs managed through its investment phase. It remains focused on four strategic priorities:
- Better serving customers
- Investments that support a safe and secure bank
- Ensuring the business is simple and scalable
- Building a high-performance culture and capabilities
During the quarter, BSP announced a multi-year sponsorship agreement with the PNG Chiefs, the 19th team to join the National Rugby League. BSP became the club’s Principal Foundation Partner, commencing in its foundation period ahead of joining the NRL in the 2028 season.
On the outlook, management said economic growth across the South Pacific has held up reasonably well and provides a broadly supportive outlook. Regional risks persist, including higher fuel prices and El Niño.
Operational risk also featured earlier in 2026, when a BSP cyber breach was contained to a non-production test environment, with no customer data or live systems affected and services restored.
Copper, coffee and cocoa prices remain resilient. In the medium to longer term, management pointed to a positive contribution to growth from the infrastructure to establish the PNG Chiefs and the pipeline of major energy and resources projects, including Papua LNG.
Get Financials News Before the Market Moves
Join 20,000+ investors receiving FREE breaking ASX news within minutes of release, complete with in-depth analysis and the full announcement. Click the “Free Alerts” button at Big News Blast to get the next financials and fintech update the moment it breaks.