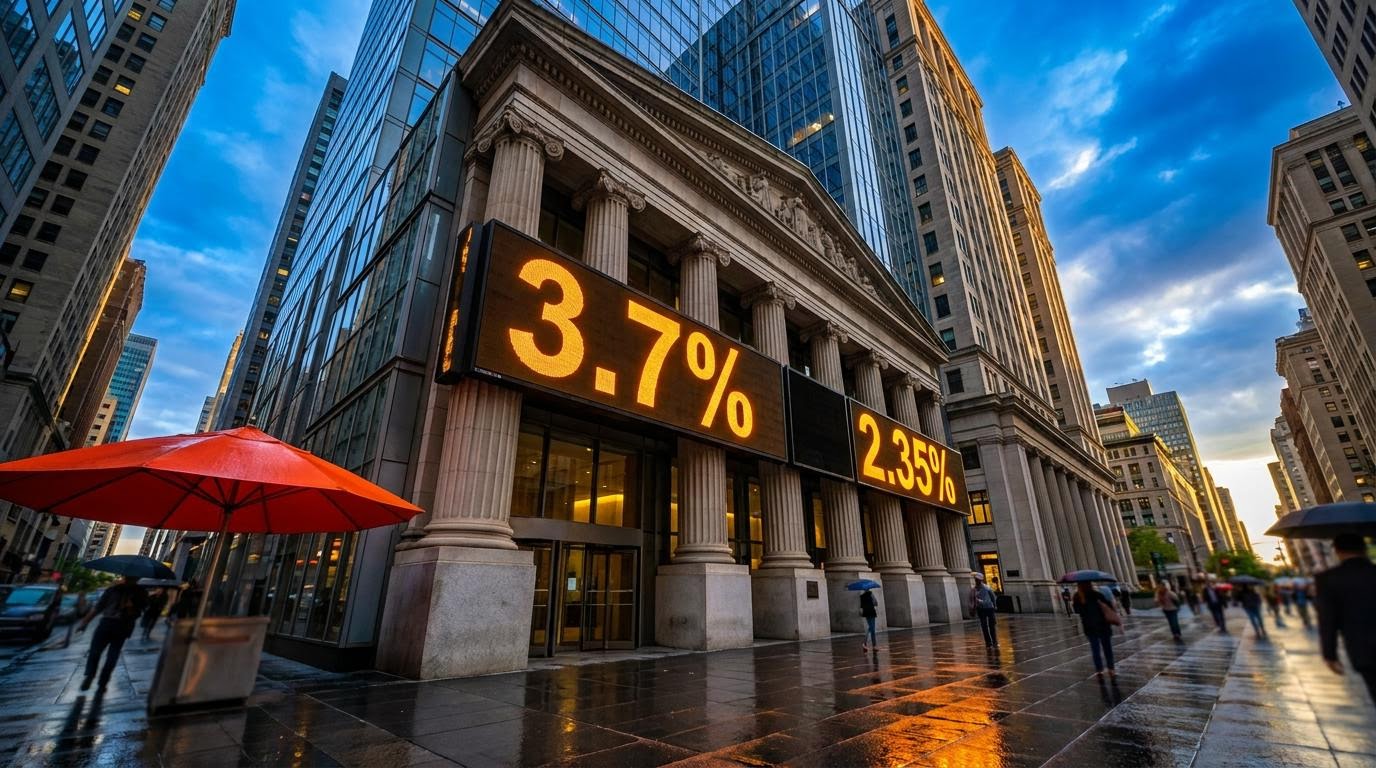
Most investors watching the Federal Reserve are fixed on one number: the overnight rate. Early in 2026, the consensus expected Chair Kevin Warsh to cut it. Instead, the Fed raised rates 25 bp on 16 September 2026, and markets now price roughly 75 bp of further hikes, according to Nancy Davis, founder of Quadratic Capital.
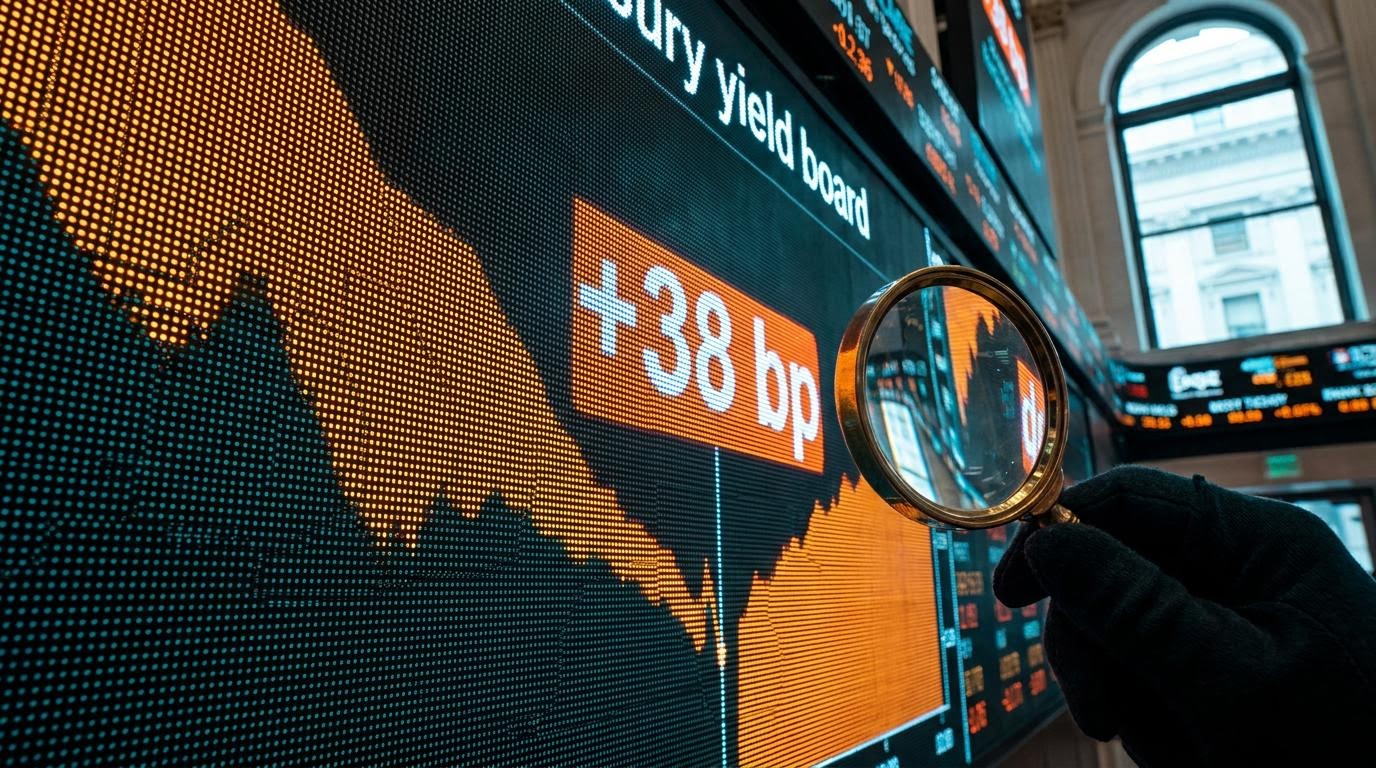
The signal many readers miss sits further out the curve. On the 19 October Treasury curve, the gap between 2-year and 10-year yields was about +38 bp. That narrow spread says more about where policy is heading than the target rate does, and it frames any yield curve steepener trade being weighed right now.
The timing makes this urgent. The Fed meets on 27-28 October and the midterm elections follow on 3 November, so curve shape is being tested by policy and politics in the same fortnight. Misread it and you can be right on the Fed but still wrong on your bond exposure.
Here is why the curve flattened, what could steepen it, and how curve-trade ETFs express each view, along with what they cost.
Why did the curve flatten when markets expected Warsh cuts?
How the data killed the cut narrative
The cut thesis rested on one assumption: that inflation would keep cooling. It did not. September CPI came in at 3.7% year on year, up from 3.4% in August, with a 0.6% monthly jump. August PCE sat at 3.4%.
Bank of America’s reversal to three hikes in 2026, driven by core PCE near 3.3%, shows how quickly the cut narrative unravelled once inflation stopped cooling.
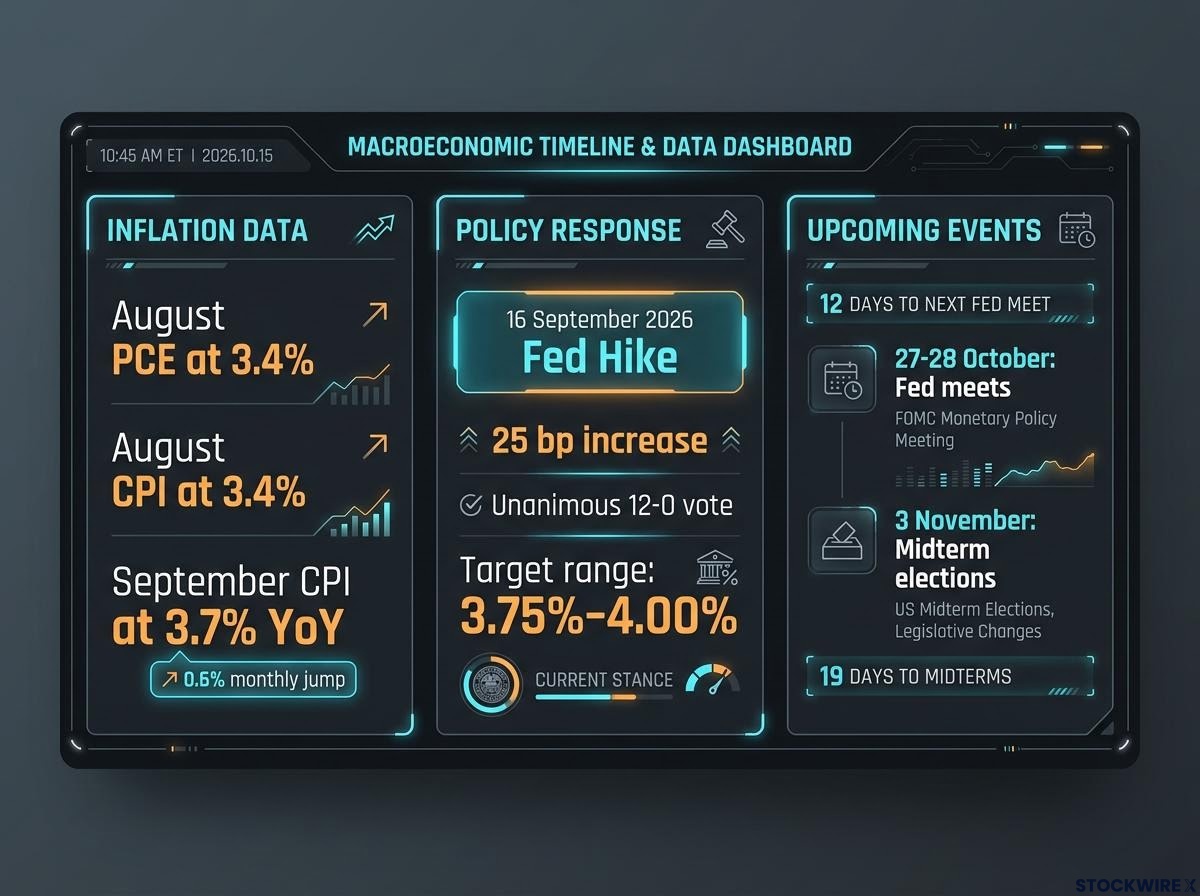
The September hike was a unanimous 12-0 vote, lifting the target range to 3.75%-4.00%. On 16 October, Warsh declined to “prejudge meetings” or say what he might do later in the year.
Fed Vice Chair Philip Jefferson, New York Fed President John Williams and Governor Christopher Waller then signalled another hike may be needed, though not necessarily at consecutive meetings. Strategists at J.P. Morgan Chase kept a base case of one more quarter-point hike, with risks tilted towards hotter inflation.
What the curve is saying now
Front-end yields repriced higher as cuts disappeared. Long-end yields rose less, held back by anchored inflation expectations and softer long-run growth expectations.
| Reading | 2-year | 10-year | 30-year | Spreads |
|---|---|---|---|---|
| 19 October 2026 | 4.77% | 5.15% | 5.48% | 2s10s +38 bp; 2s30s +71 bp |
| September low | Not reported | Not reported | Not reported | 2s10s narrowest since March 2025; 2s30s just under 55 bp |
| 6 October 2026 | Not reported | Not reported | Not reported | 2s10s 48 bp |
Davis cites about 26.5 bp of hikes priced for this year and 51 bp next year, with December hike odds around 86-90% across sources. She also says the curve inverted earlier in 2026; other research did not find evidence of that, so the claim remains unresolved.
Her broader point holds regardless. Bonds, like equities, move on expectations versus delivery. A curve that has flattened while hikes stay priced tells you the market is betting on tightening being delivered, and any wobble in that delivery is where your curve exposure gets tested.
When big ASX news breaks, our subscribers know first
Curve shape basics: what a steepener actually bets on
On a screen, a steepener looks simple: a spread widening. The 2s10s spread is the 10-year yield minus the 2-year yield; 2s30s uses the 30-year. Flattening means the gap narrows, as it did into September. Steepening means it widens.
The trouble is that the same widening can mean opposite things.
| Type | What moves | Typical driver | 2026 relevance |
|---|---|---|---|
| Bull steepening | Short yields fall faster than long | Expected Fed easing | Needs the Fed to abandon priced hikes |
| Bear steepening | Long yields rise faster than short | Term premium, deficits, inflation expectations | Fiscal and supply worries |
| Bear flattening | Short yields rise faster than long | Fed tightening | The September repricing |
| Bull flattening | Long yields fall faster than short | Weaker growth outlook | Possible if growth fears rise |
Term premium is the extra yield investors demand for holding a long bond instead of rolling short ones. Stifel reports investors are asking for more compensation to lend to the government for 30 years, and Fidelity attributes recent steepening mainly to higher long yields and a rebuilt term premium rather than aggressive cuts. IG adds that heavy issuance forces the government to offer higher yields.
Heavy issuance is not only a Treasury story: AI hyperscaler bond supply competes for the same long-duration capital, and estimates suggest it has added roughly 0.3 percentage points to the 10-year yield.
DBS argued on 29 July that the curve could stay flat if inflation expectations remain anchored, and that sustained steepening is hard without actual easing.
Davis on curve shape Rates analysis should weigh the shape of the curve, not only the overnight rate.
Knowing which steepening you are betting on tells you which risks you carry. A fiscal-driven bear steepener punishes the same duration positions a policy-driven bull steepener rewards.
What happens to the curve if the Fed does not deliver the priced-in hikes?
October hold odds have swung from 72.3% (CNBC, 16 October) to 86.2% (IBTimes, 19 October), with Davis citing about 85%. The move reflects repricing after September CPI. December is the meeting markets actually expect to deliver.
Five ways a missed hike reshapes the curve
- Front-end repricing: the 2-year falls as priced hikes come out, widening spreads if longer yields lag.
- Growth expectations: fewer recession fears may lift intermediate yields relative to the front end.
- Term premium: long-end compensation can keep rising regardless of Fed action.
- Fiscal supply: heavy issuance may hold long yields high even if the Fed pauses.
- Inflation expectations: if they stay anchored, the curve may remain flat despite a pause.
Why the long end may not cooperate
Wells Fargo argues midterm effects depend less on gridlock than on whether fiscal talks raise Treasury borrowing needs. BlackRock said on 1 October it prefers front- and intermediate-term Treasuries, flagging politics, fiscal policy and the AI investment cycle as long-end risks. Allianz Global Investors said on 15 October that the case for a sustained steepening trade had weakened after the September hike. Davis expects volatility may ease after the elections, depending on results.
The counterargument A failed hike can pull the front end lower, but fiscal risk and term premium may lift the long end enough to produce a different steepening, or none at all.
If the Fed pauses and you assume the long end follows the front end down, you may be wrong. The scenario to price is the 2-year falling while 30-year yields stay high.
A pause that lets the spread widen would also change credit supply conditions, because wider term spreads improve bank net interest margins and make new lending more attractive.
How curve-trade ETFs express a view, and where they can hurt you
What the ETFs do and what BNDD has returned
The appeal is simplicity. Quadratic, Davis’s own firm, runs a 2s30s flattener (BNDD) and a steepener (STPP), which she calls building blocks. She personally prefers the steepener; that view comes from the issuer. STPP also aims to reduce the short volatility embedded in mortgages, though its 2026 performance was not found.
BNDD beat long Treasuries in H1 2026 (NAV +7.53% versus +0.44%). Its record through 30 September 2026 looks different:
- NAV: -3.99% (3 months), -1.76% (6 months), -1.38% (1 year)
- Closing price: -5.54%, -1.59%, -1.77%
| Trade | Main exposure | Principal risks |
|---|---|---|
| Flatteners | Long duration plus options on spread narrowing | Lose if the curve steepens or long yields rise |
| Steepeners | Short rates falling against long rates | Lose if hikes continue or the long end rallies faster |
| Carry and roll | Paying for optionality while waiting | Time decay and financing costs while right on direction |
| Options | Convex curve exposure | Expensive implied volatility, wider spreads in shocks |
| Mortgage convexity | Hedging flows from mortgage holders | Flows amplify moves and disrupt timing |
| Liquidity and basis | Futures, swaps and options, not one cash spread | Market price can diverge from NAV |
Because BNDD’s closing price trailed its NAV by more than 1.5 points over three months, treat these ETFs as tools demanding timing, cost awareness and position sizing, not simple spread bets.
What history suggests about hiking cycles
In 2004-2006, the Fed hiked about 425 bp while the 10-year rose far less than the 2-year, ending in inversion. The 2022-2023 inversion ran deep without an immediate recession. Hiking cycles usually flatten, but distortion can last, and 2026’s deficits, supply and term premium make a clean repeat less certain.
History adds a caution here, since bond market recession signals can cluster around flat-back curve shapes like this one, which has appeared only about 5.4% of the time since 1990.
What the October meeting and the midterms change, and what they do not
Whether the Fed hikes is not the whole question. What matters is whether delivery matches what is priced, and whether the long end follows future short rates or inflation, supply and term premium.
Three variables deserve your attention:
- The 27-28 October statement and Warsh’s tone
- December hike odds, currently near 86-90%
- Post-election fiscal and Treasury issuance signals
Before acting on any curve view, test it against both bull and bear steepening paths and the carry costs of holding it. This is analysis, not personalised financial advice.
This article is for informational purposes only and should not be considered financial advice. Investors should conduct their own research and consult with financial professionals before making investment decisions. Past performance does not guarantee future results. Financial projections are subject to market conditions and various risk factors.