Vanguard VIHY Declares First Distribution at 49.49 Cents per Unit
9 mins ago
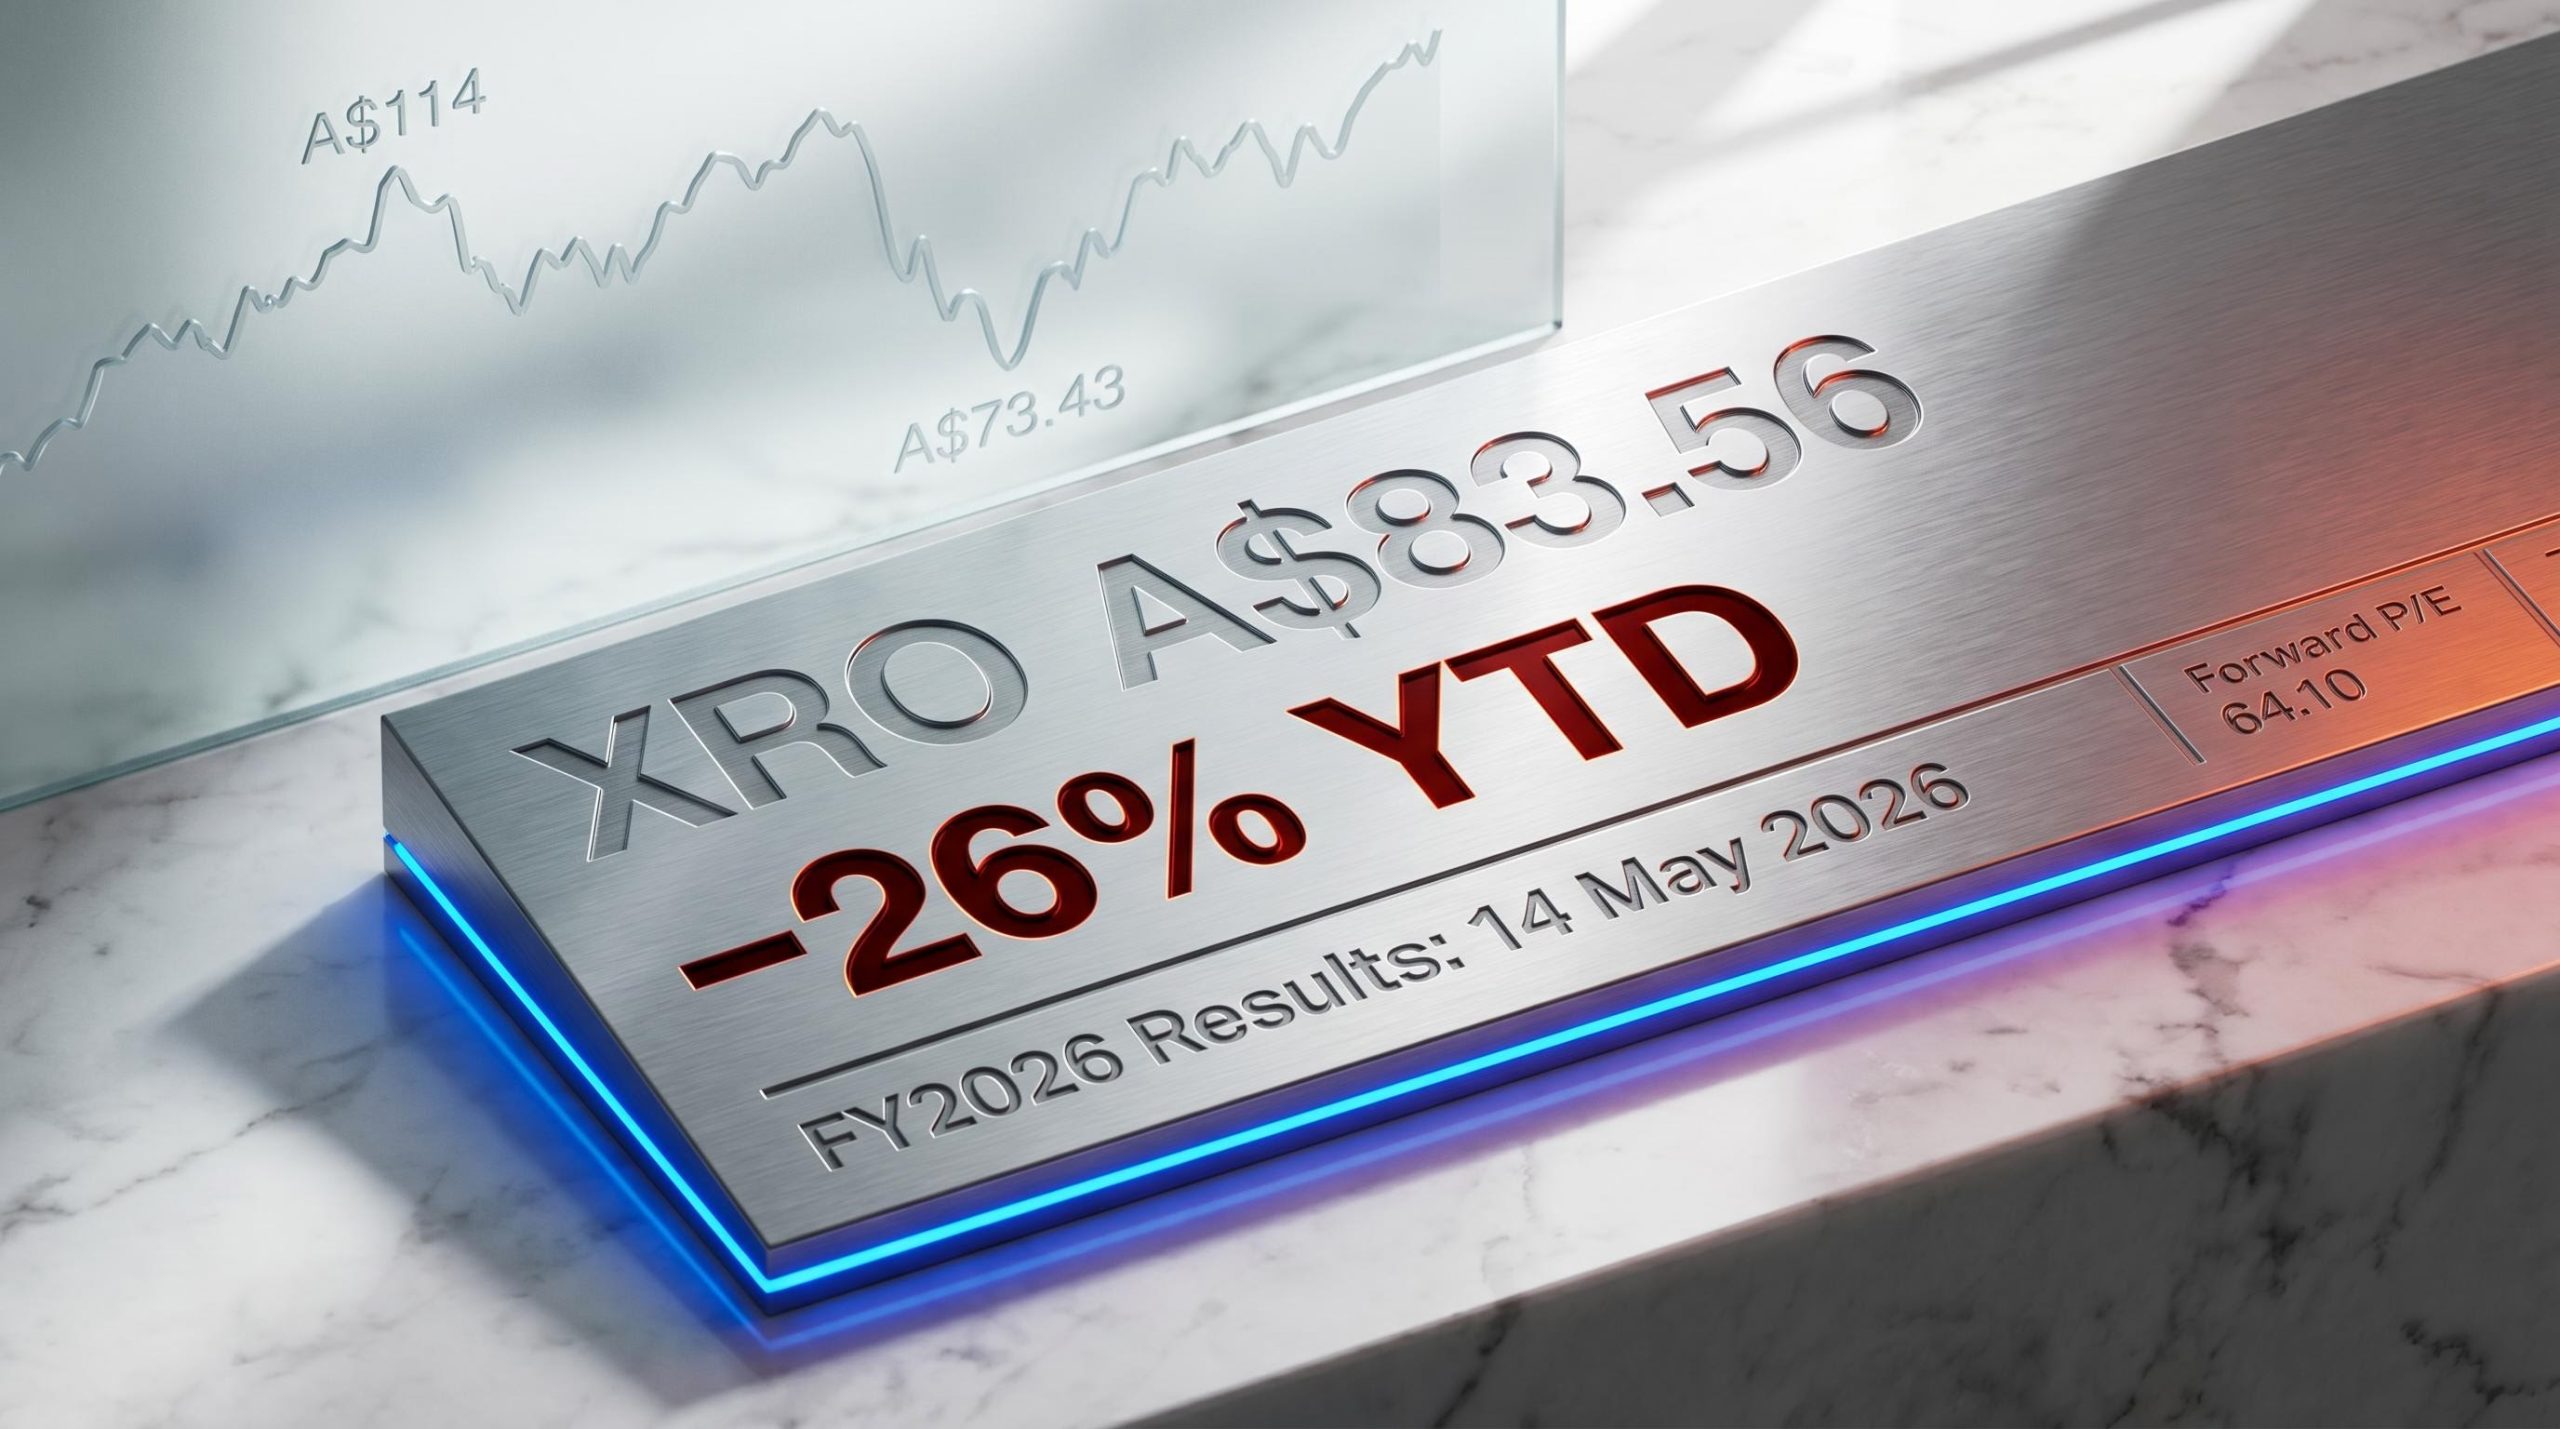
Xero shares have shed more than A$30 in five months, a decline that has erased roughly A$10 billion in market capitalisation since the stock traded near A$114 at the start of 2026. At A$83.56 as of 8 May 2026, the XRO share price sits 26% below where it began the year, yet the stock still carries a forward price-to-earnings ratio above 64.
That combination raises a pointed question for Australian investors: is this a high-quality business temporarily mispriced, or is the market correctly reassessing a more difficult medium-term outlook? With full-year FY2026 results due on 14 May 2026, the timing makes the question unusually pressing. What follows works through Xero’s actual financial data, the mechanics of the selloff, and the analyst consensus, then frames what due diligence still needs to happen before the fundamentals can translate into a considered view on the stock.
The decline did not arrive in a single shock. It built in stages, each compounding the damage from the one before.
The first significant pressure point was the Melio acquisition, announced in October 2025. Xero paid US$2.5 billion (approximately A$3.9 billion) upfront for the US B2B payments platform, funding the deal partly through an A$1.85 billion equity placement at A$176 per share, a 9.4% discount to the prevailing price. The stock dropped approximately 9% on the announcement as investors absorbed the dilution.
Two months later, the 1H FY2026 results (released in November 2025) compounded the sentiment damage. Revenue grew 20% year-on-year to NZ$1.194 billion, a number that would ordinarily support a premium multiple. Instead, the market focused on gross margin compression and integration costs, pushing shares approximately 5% lower on results day.
Then the macro environment turned. A broader tech sector re-rating in February 2026, combined with sustained interest rate sensitivity, reduced tolerance for high-multiple growth names across the ASX. Xero, still priced at a forward P/E above 60, absorbed the brunt of that re-rating.
The broader context matters here: sentiment-driven multiple contraction across ASX growth names between October 2025 and April 2026 saw forward P/E ratios compress 26%-64% even as consensus earnings forecasts held firm or improved, a dynamic that directly shaped the macro re-rating pressure Xero absorbed alongside its company-specific headwinds.
Four primary drivers converged to produce the decline:
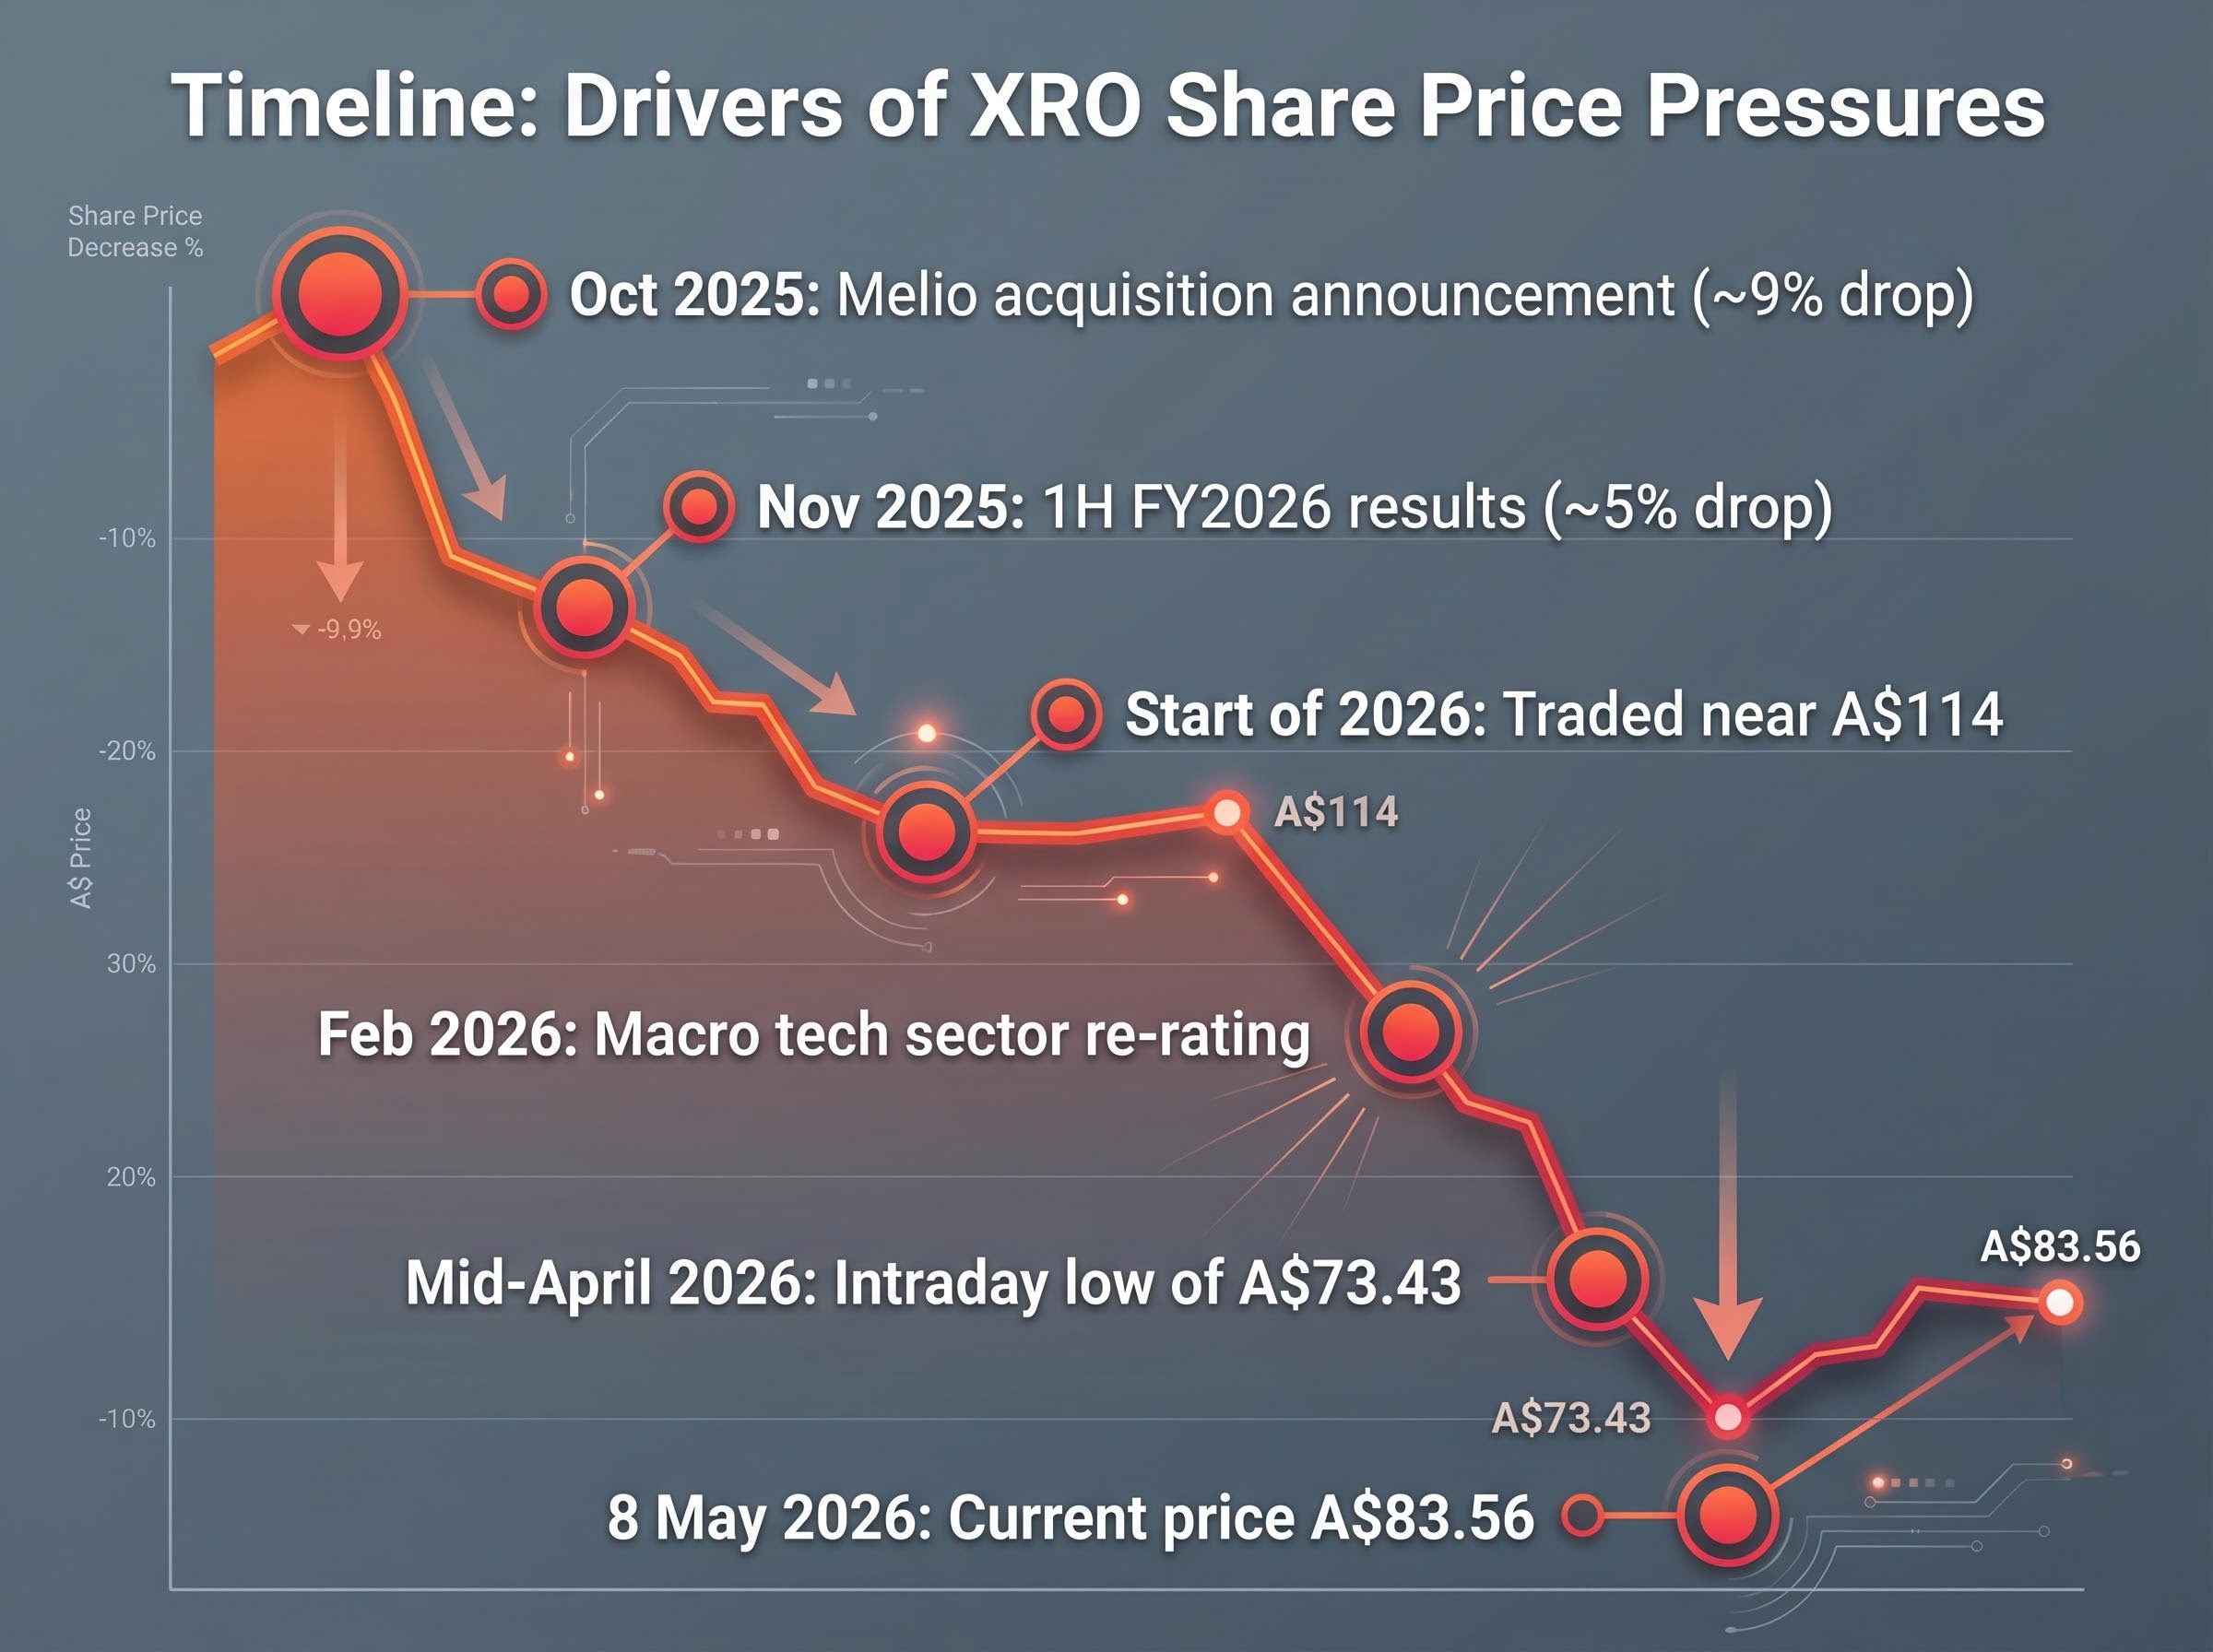
Mid-April 2026 low: The stock reached an intraday low of approximately A$73.43 in mid-April before recovering roughly 12% to current levels, indicating that some of the worst-case pricing has already been partially reversed.
Start with the top line. Xero reported annual revenue of A$1,714 million in its most recent full year, representing a three-year compound annual growth rate (CAGR) of approximately 26.4%. That figure captures sustained business momentum rather than a single strong reporting period, and it places Xero among the faster-growing software businesses on the ASX over the medium term.
Gross margin reinforces the quality of that revenue. At 88.2%, Xero’s margin reflects the economics of a cloud software product where each additional subscriber costs very little to serve. A margin at that level signals that the core product generates substantial value before overhead costs are applied, a characteristic of subscription-based software businesses with low marginal delivery costs.
The profitability trajectory tells a story of its own. Three years ago, Xero reported a net loss of A$9 million. In the most recent full year, that figure had swung to a net profit of A$175 million. The shift from loss-making to material profitability, while maintaining revenue growth above 26%, represents a meaningful inflection in the business model’s earnings capacity.
The Rule of 40 benchmark, which combines revenue growth rate and profit margin into a single score, is the metric Xero itself has cited as a FY28 target; a score above 40 has historically commanded materially higher revenue multiples, with each 10-point improvement above the threshold adding approximately 1.1x EV/Revenue in the current market environment.
The balance sheet adds a further layer. Xero holds net debt of negative A$306 million, meaning cash and equivalents exceed borrowings. The debt-to-equity ratio sits at 87.9%, with equity comfortably above total debt. Return on equity for FY24 came in at 14.3%.
Taken together, these capital structure metrics describe a business with financial flexibility. The net cash position matters particularly given the Melio integration spend ahead; it provides a buffer against the near-term cost profile that acquisition integration typically demands.
| Metric | Most recent value | Three-year comparison |
|---|---|---|
| Revenue | A$1,714M | Three-year CAGR: ~26.4% |
| Gross margin | 88.2% | Consistently above 85% |
| Net profit | A$175M | From a loss of A$9M three years prior |
| Net debt | Negative A$306M (net cash) | Cash exceeds borrowings |
| Debt-to-equity | 87.9% | Equity exceeds total debt |
| Return on equity (FY24) | 14.3% | N/A |
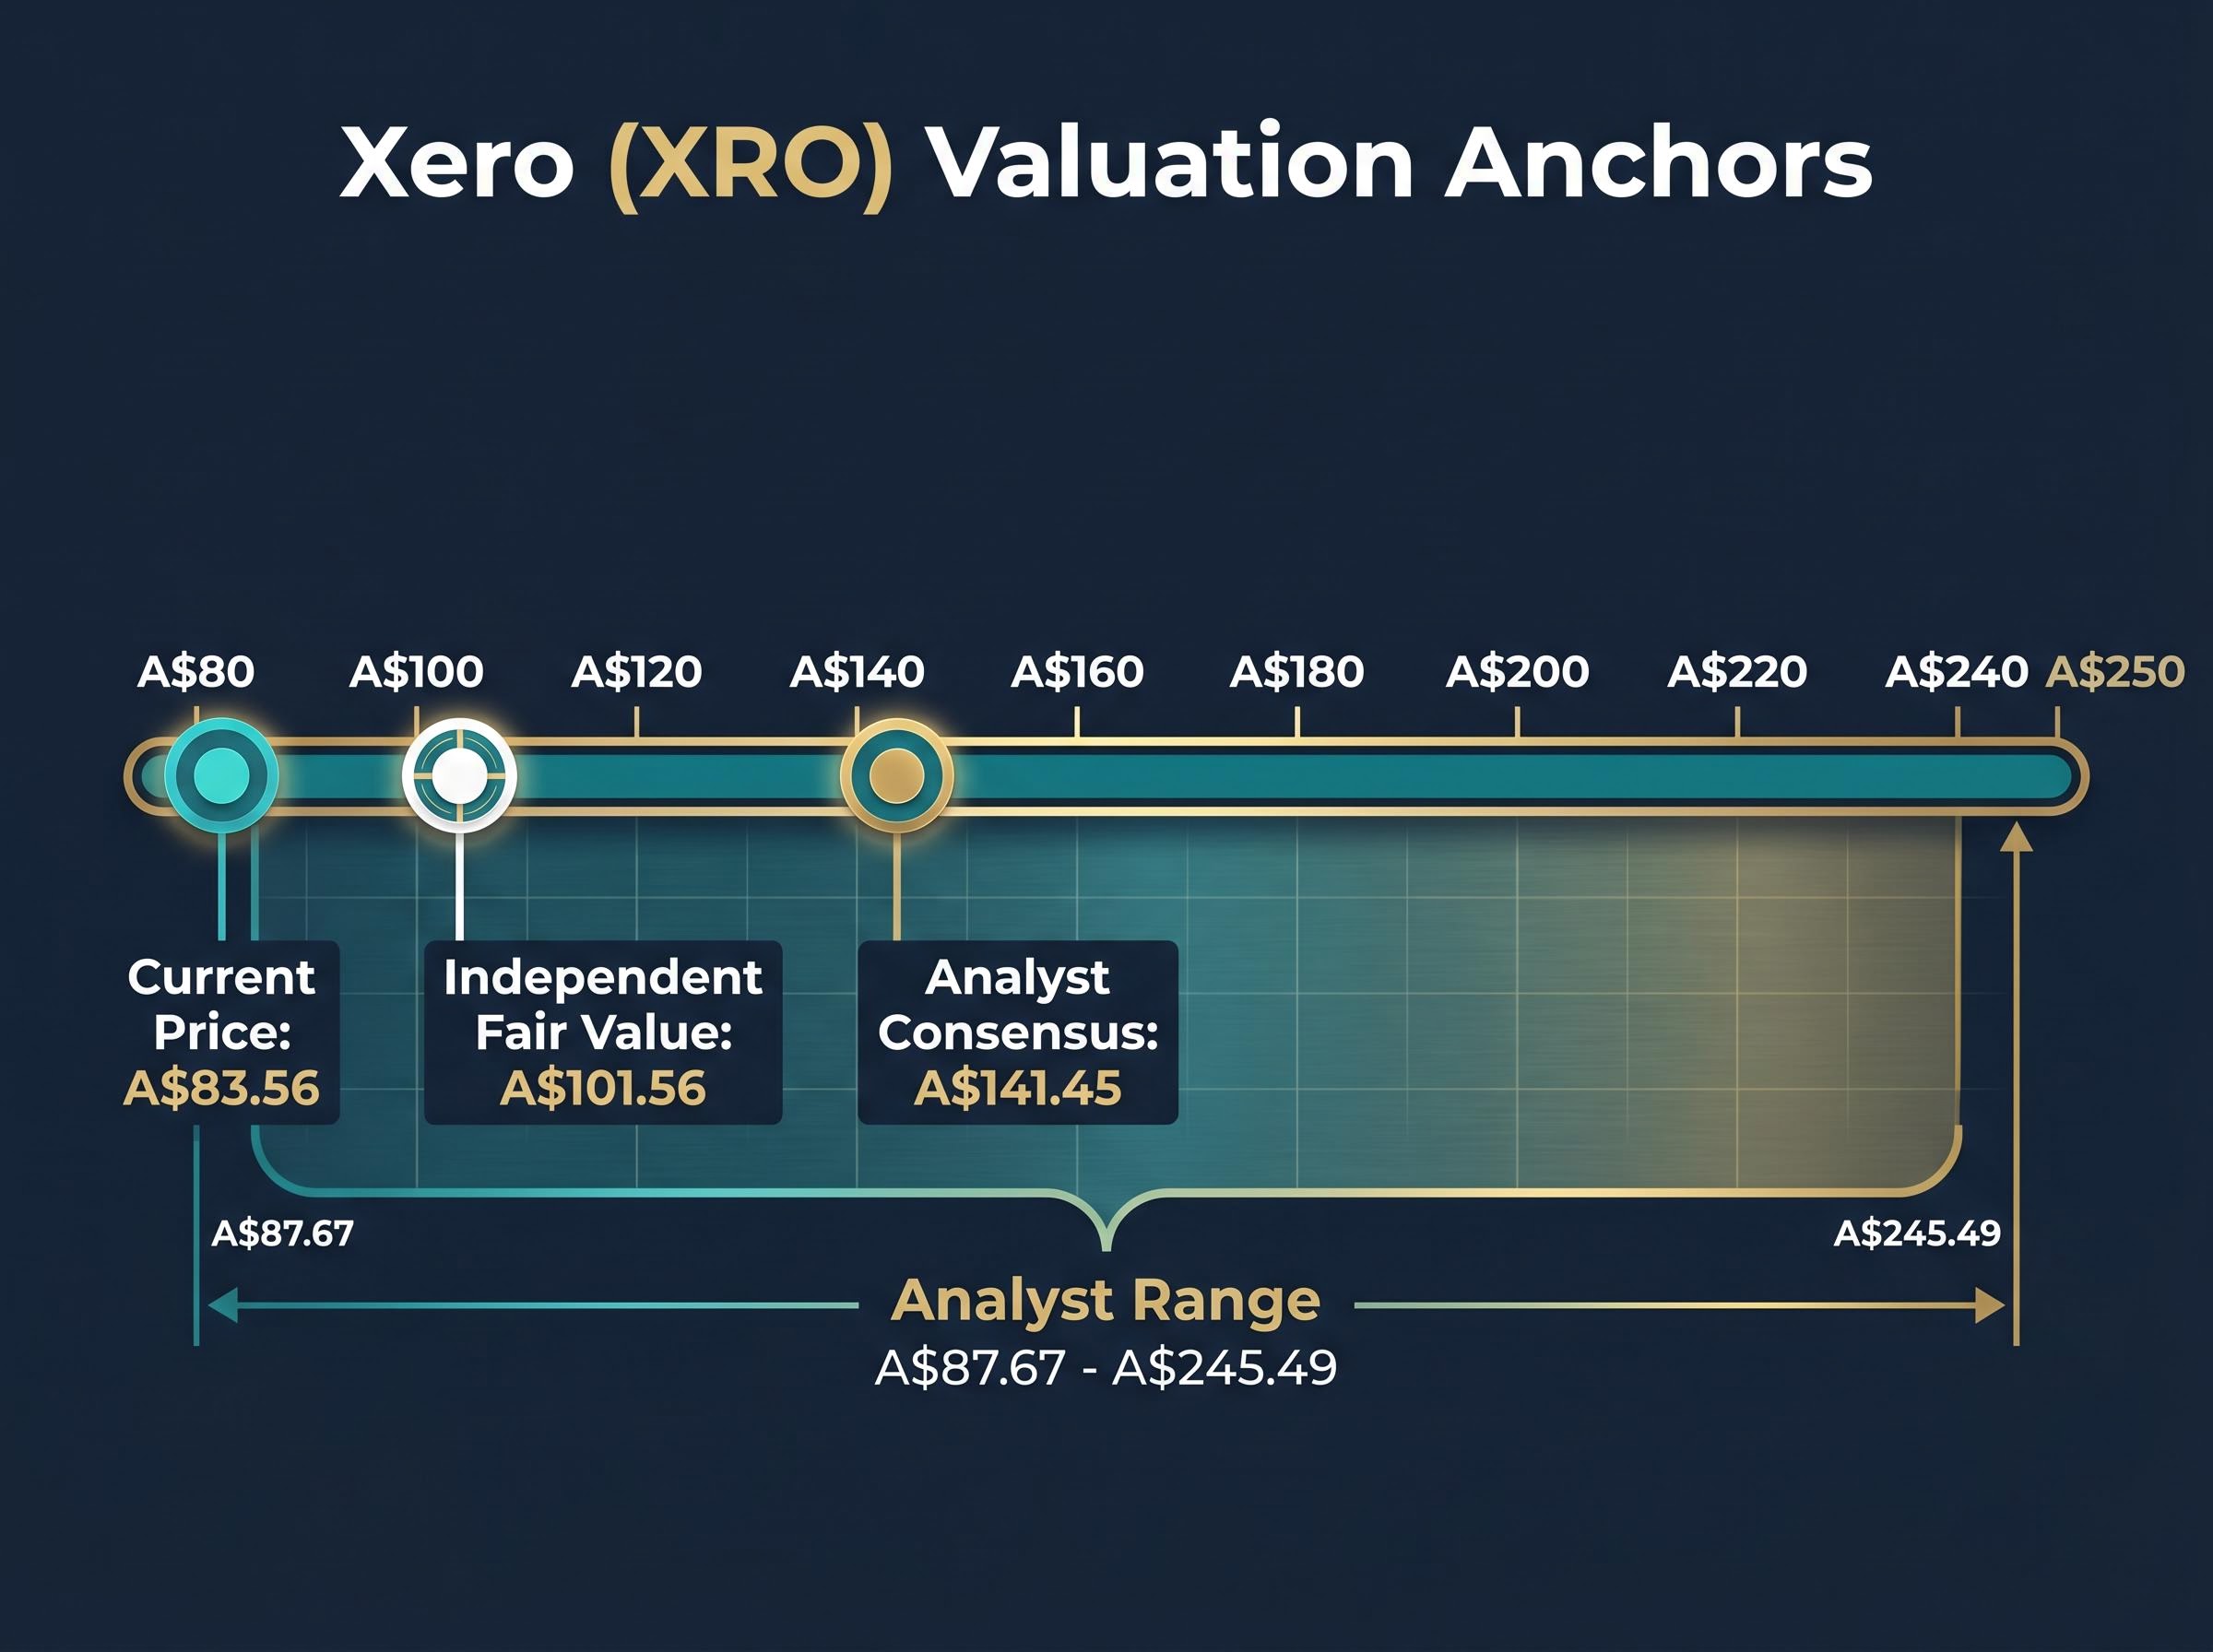
At A$83.56, Xero trades on a trailing P/E of 55.94 and a forward P/E of 64.10. A forward multiple above 64 means the market is demanding substantial earnings growth just to hold the current price level. Any shortfall against consensus expectations does not merely disappoint; it compresses the multiple that justifies the valuation.
The analyst community, however, sees a different picture. Across 13 rated brokers, the consensus stands at 11 buy ratings, 2 holds, and zero sells. The average 12-month price target is A$141.45, implying approximately 69% upside from the current price. The range spans from A$87.67 to A$245.49, a spread wide enough to signal genuine disagreement about how the next 12-18 months resolve.
A more conservative anchor comes from an independent fair value estimate of A$101.56 (published by Simply Wall St contributor Ethan_cpa). The gap between that figure and the broker consensus average reflects execution risk pricing rather than structural disagreement about the business.
Three valuation anchors frame the current debate:
Motley Fool characterised XRO on 5 May 2026 as a “rare ASX opportunity” following the stock’s approximately 50% decline from its peak. That framing captures the bullish case in its most concentrated form, though it carries the inherent limitation of any single-point-in-time assessment made before full-year results arrive.
The full-year FY2026 results, due 14 May 2026, represent a near-term binary catalyst. Depending on where revenue growth, margin trajectory, and management guidance land, the market’s interpretation of these multiples could shift materially in either direction.
The financial metrics covered above describe a business that has improved materially across revenue, margin, and profitability. None of those metrics, however, can forecast what comes next.
Financial statements describe the past and present. They capture what has already happened in the business. The competitive dynamics, execution variables, and structural questions that will determine whether Xero’s earnings trajectory holds or falters sit outside the income statement.
The Melio acquisition introduces execution variables that prior-period financials cannot capture. A US$2.5 billion acquisition in a new geography, the US market, carries integration risks that include margin compression from elevated operating expenses, uncertainty about Melio’s contribution to Xero’s earnings profile in FY2027 and beyond, and the challenge of competing against Intuit’s QuickBooks on its home ground.
The 1H FY2026 results already showed the cost side of this equation: elevated operating expenses and margin pressure arrived before the revenue upside. Whether the full-year results demonstrate early traction or continued cost absorption will shape how analysts model the acquisition’s payback period.
Beyond Melio, the forward P/E of 64.10 provides limited margin for earnings misses. Any FY2026 result that disappoints relative to consensus could compress the multiple further, even if the underlying business trajectory remains intact. AI disruption, cited by both Simply Wall St and Motley Fool commentary in May 2026 as a structural overhang, adds a longer-term uncertainty with an unclear timeline.
Four risk dimensions sit alongside the financial positives:
For investors wanting to understand how management is framing the Melio investment beyond the current cost absorption phase, the detailed analysis of Xero’s Melio breakeven path and AI monetisation strategy covers the H2 FY28 breakeven timeline, the US$70 million revenue synergy target, and the specific JAX engagement metrics that management is using to track AI adoption progress.
The financial data covered in this article serves as a structured starting point rather than a decision trigger. The following four-step framework, illustrated using Xero as the worked example, applies equally to any comparable ASX technology stock.
The four-step framework above draws on the same fundamental analysis metrics that form the core of any structured equity review: P/E ratio, revenue growth, gross margin, and return on equity each answer a distinct question about the business, and reading them together against sector peers produces more reliable signals than any single figure in isolation.
Xero’s full-year FY2026 results are due on 14 May 2026, making them the most immediate data point that will either validate or complicate the financial picture built in the preceding sections.
ASIC continuous disclosure obligations require ASX-listed disclosing entities like Xero to promptly release information that could materially affect their share price, which is why the 14 May FY2026 results release carries formal regulatory weight beyond its significance as an investor event.
With 11 of 13 rated analysts holding buy recommendations and an average target of A$141.45, the professional consensus leans constructive. The target range, however, spans from A$87.67 to A$245.49. That spread signals that even among analysts who broadly agree the stock is undervalued, there is genuine disagreement about how the next 12-18 months resolve.
The specific data points to monitor in the results release:
For investors who have worked through the preliminary analysis this article describes, knowing exactly what to look for in the upcoming results is the difference between reacting to the headline profit number and assessing whether the underlying investment thesis is strengthening or weakening.
The financial picture that emerges from Xero’s reported data describes a business in better shape than the share price alone would suggest: a 26.4% three-year revenue CAGR, an 88.2% gross margin, a swing from loss-making to A$175 million in net profit, and a net cash position of A$306 million.
Genuine uncertainties sit alongside those positives. Melio integration execution remains unproven. The forward P/E of 64.10 leaves limited room for earnings misses. AI disruption remains a structural question mark without a defined timeline. And the full-year results have not yet landed.
Financial metrics are the beginning of the due diligence process for XRO, not the end. Comparing the current price against peer valuations, understanding the Melio acquisition economics, and watching the 14 May results with specific questions about margin trajectory and Melio’s contribution timeline represent the next concrete steps. Investors tracking XRO are better served by approaching those results with that structured framework than by reacting to the headline number in isolation.
This article is for informational purposes only and should not be considered financial advice. Investors should conduct their own research and consult with financial professionals before making investment decisions. Past performance does not guarantee future results. Financial projections are subject to market conditions and various risk factors.
Xero (XRO) was trading at A$83.56 as of 8 May 2026, down approximately 26% from the start of the year when the stock traded near A$114.
The decline was driven by four converging factors: dilution from the A$1.85 billion equity placement tied to the Melio acquisition, margin compression flagged in the 1H FY2026 results, a broader ASX tech sector re-rating due to interest rate sensitivity, and growing AI disruption concerns weighing on SaaS multiples.
Across 13 rated brokers, the consensus price target for XRO is A$141.45, with 11 buy ratings and 2 holds, implying approximately 69% upside from the current price of A$83.56.
Xero is scheduled to release its full-year FY2026 results on 14 May 2026, which represents the next major catalyst that could materially shift the market's view on the stock's valuation.
Xero reported a three-year revenue CAGR of approximately 26.4%, a gross margin of 88.2%, a swing from a A$9 million net loss to A$175 million net profit, and a net cash position of A$306 million in its most recent full year.