10 Approved Rivals, Yet S&P Global’s Moat Keeps Compounding
55 mins ago
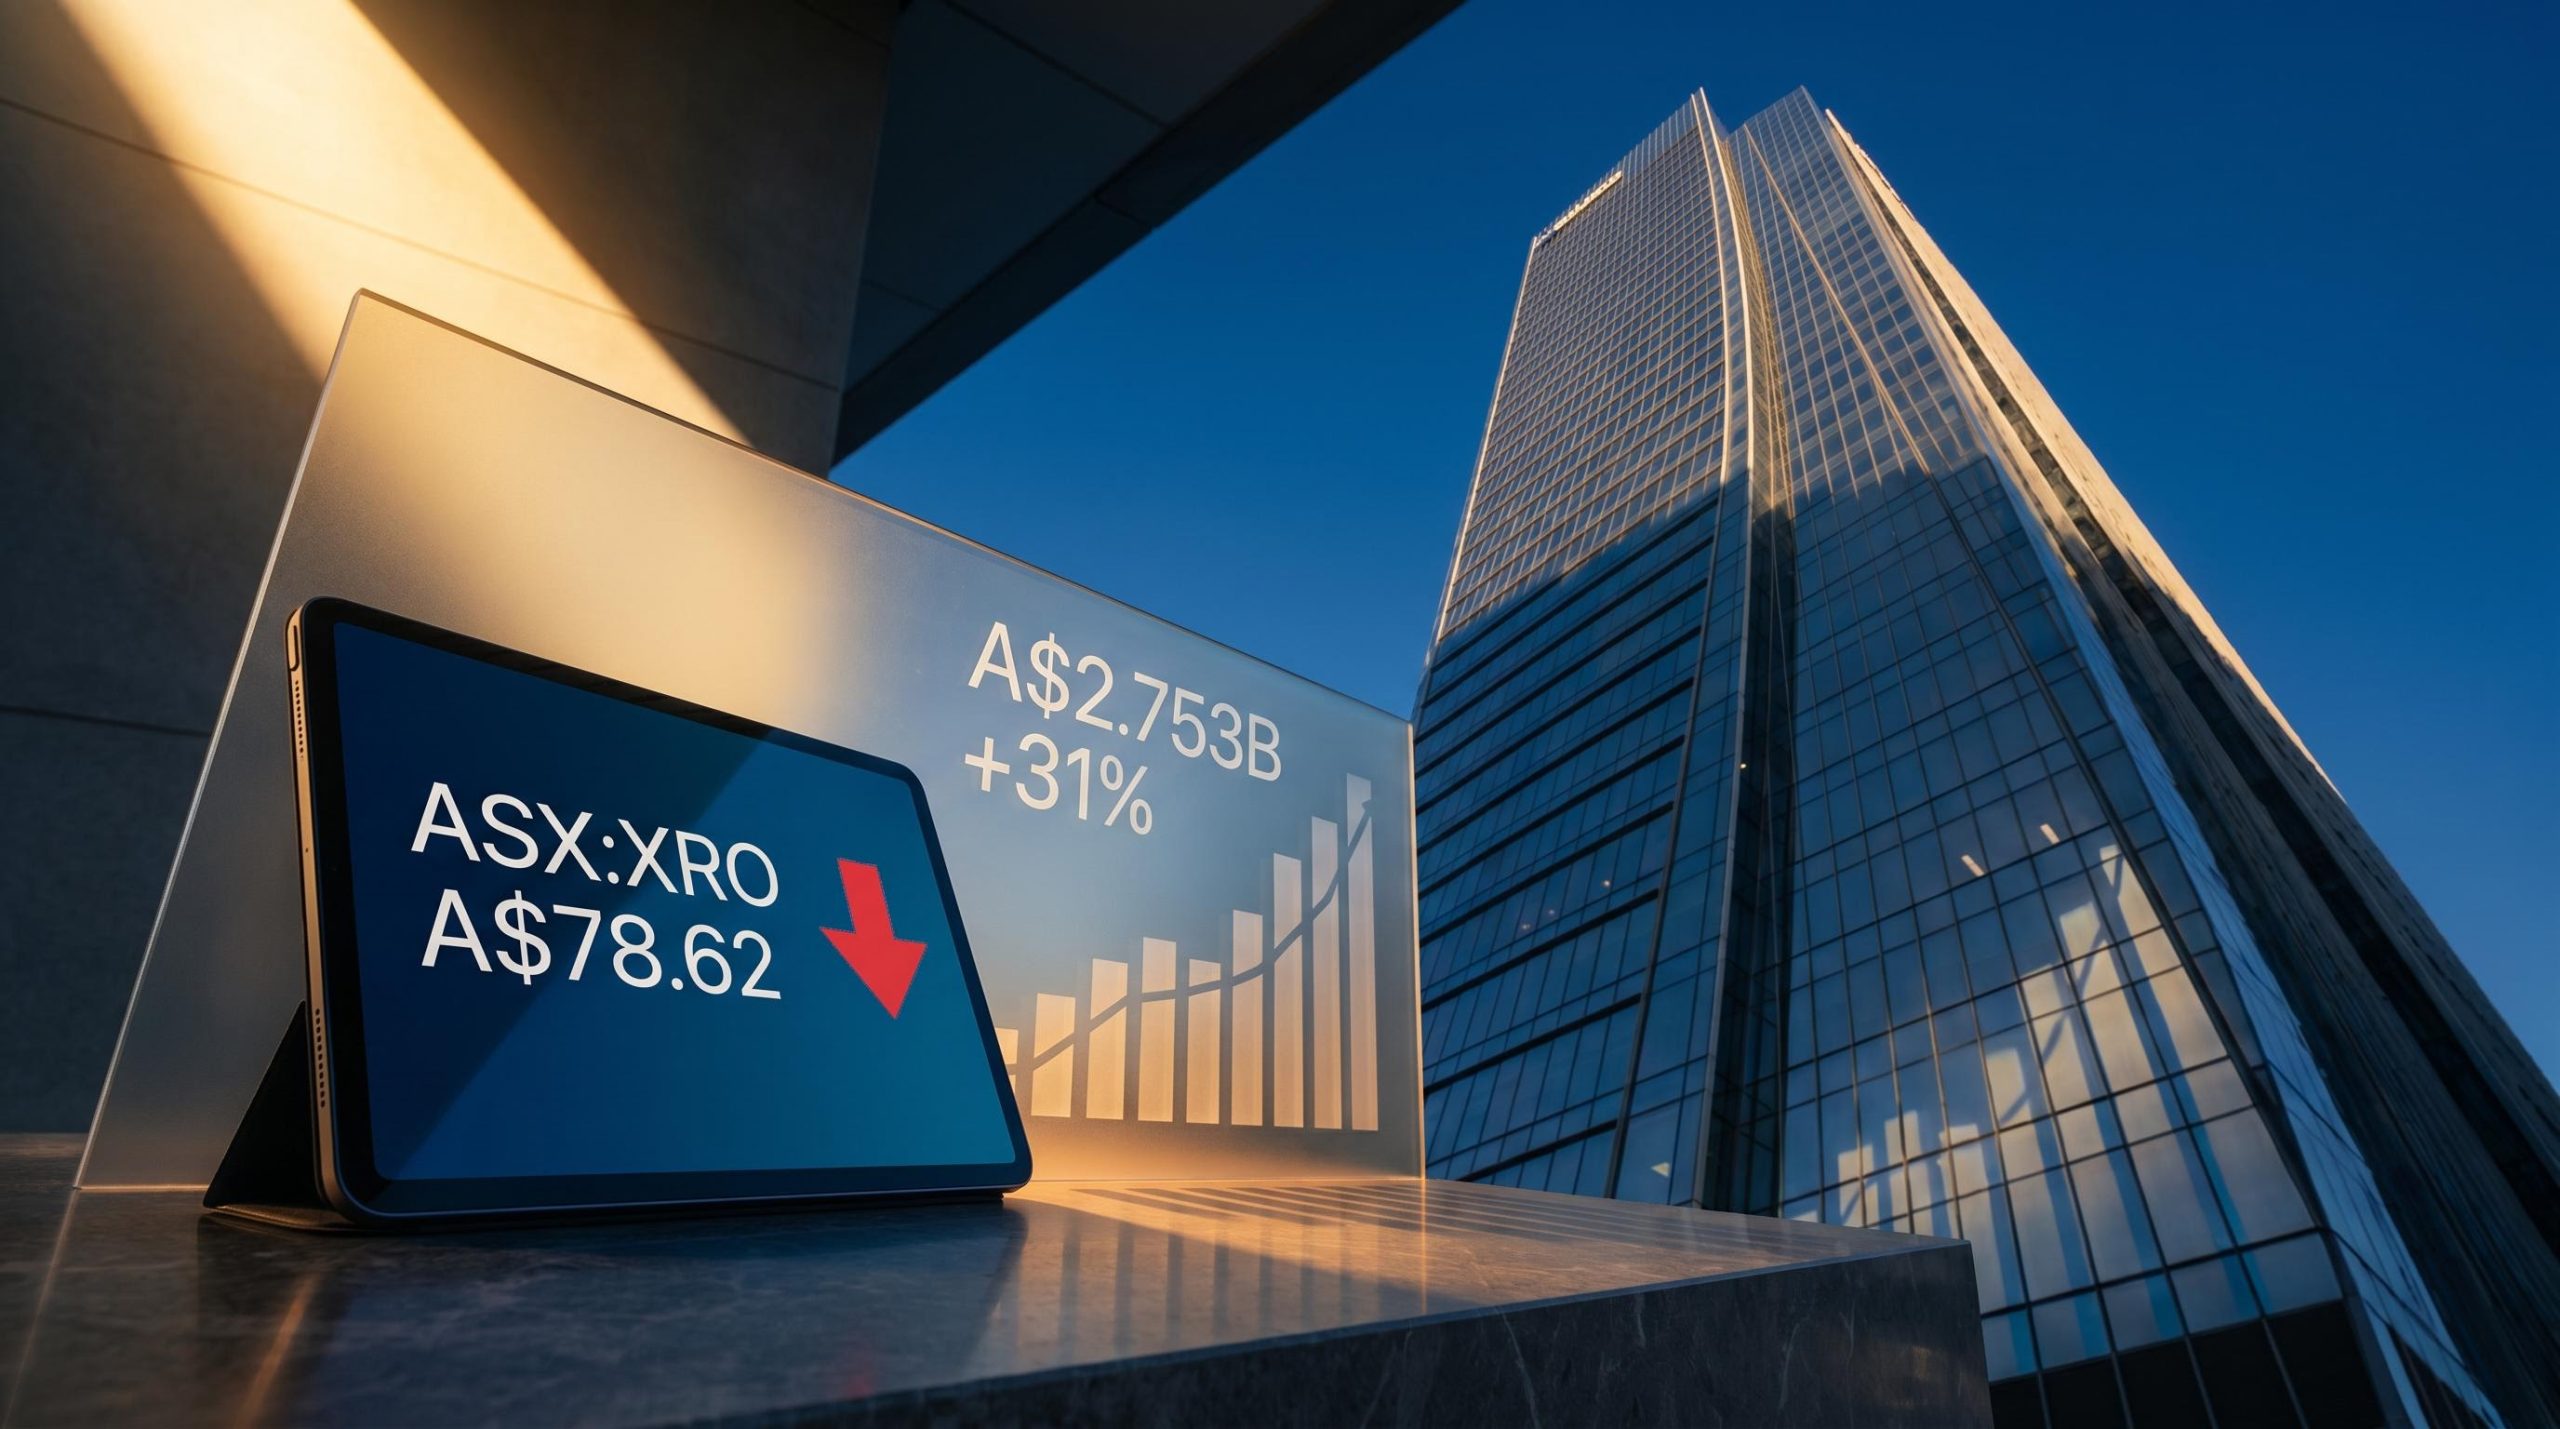
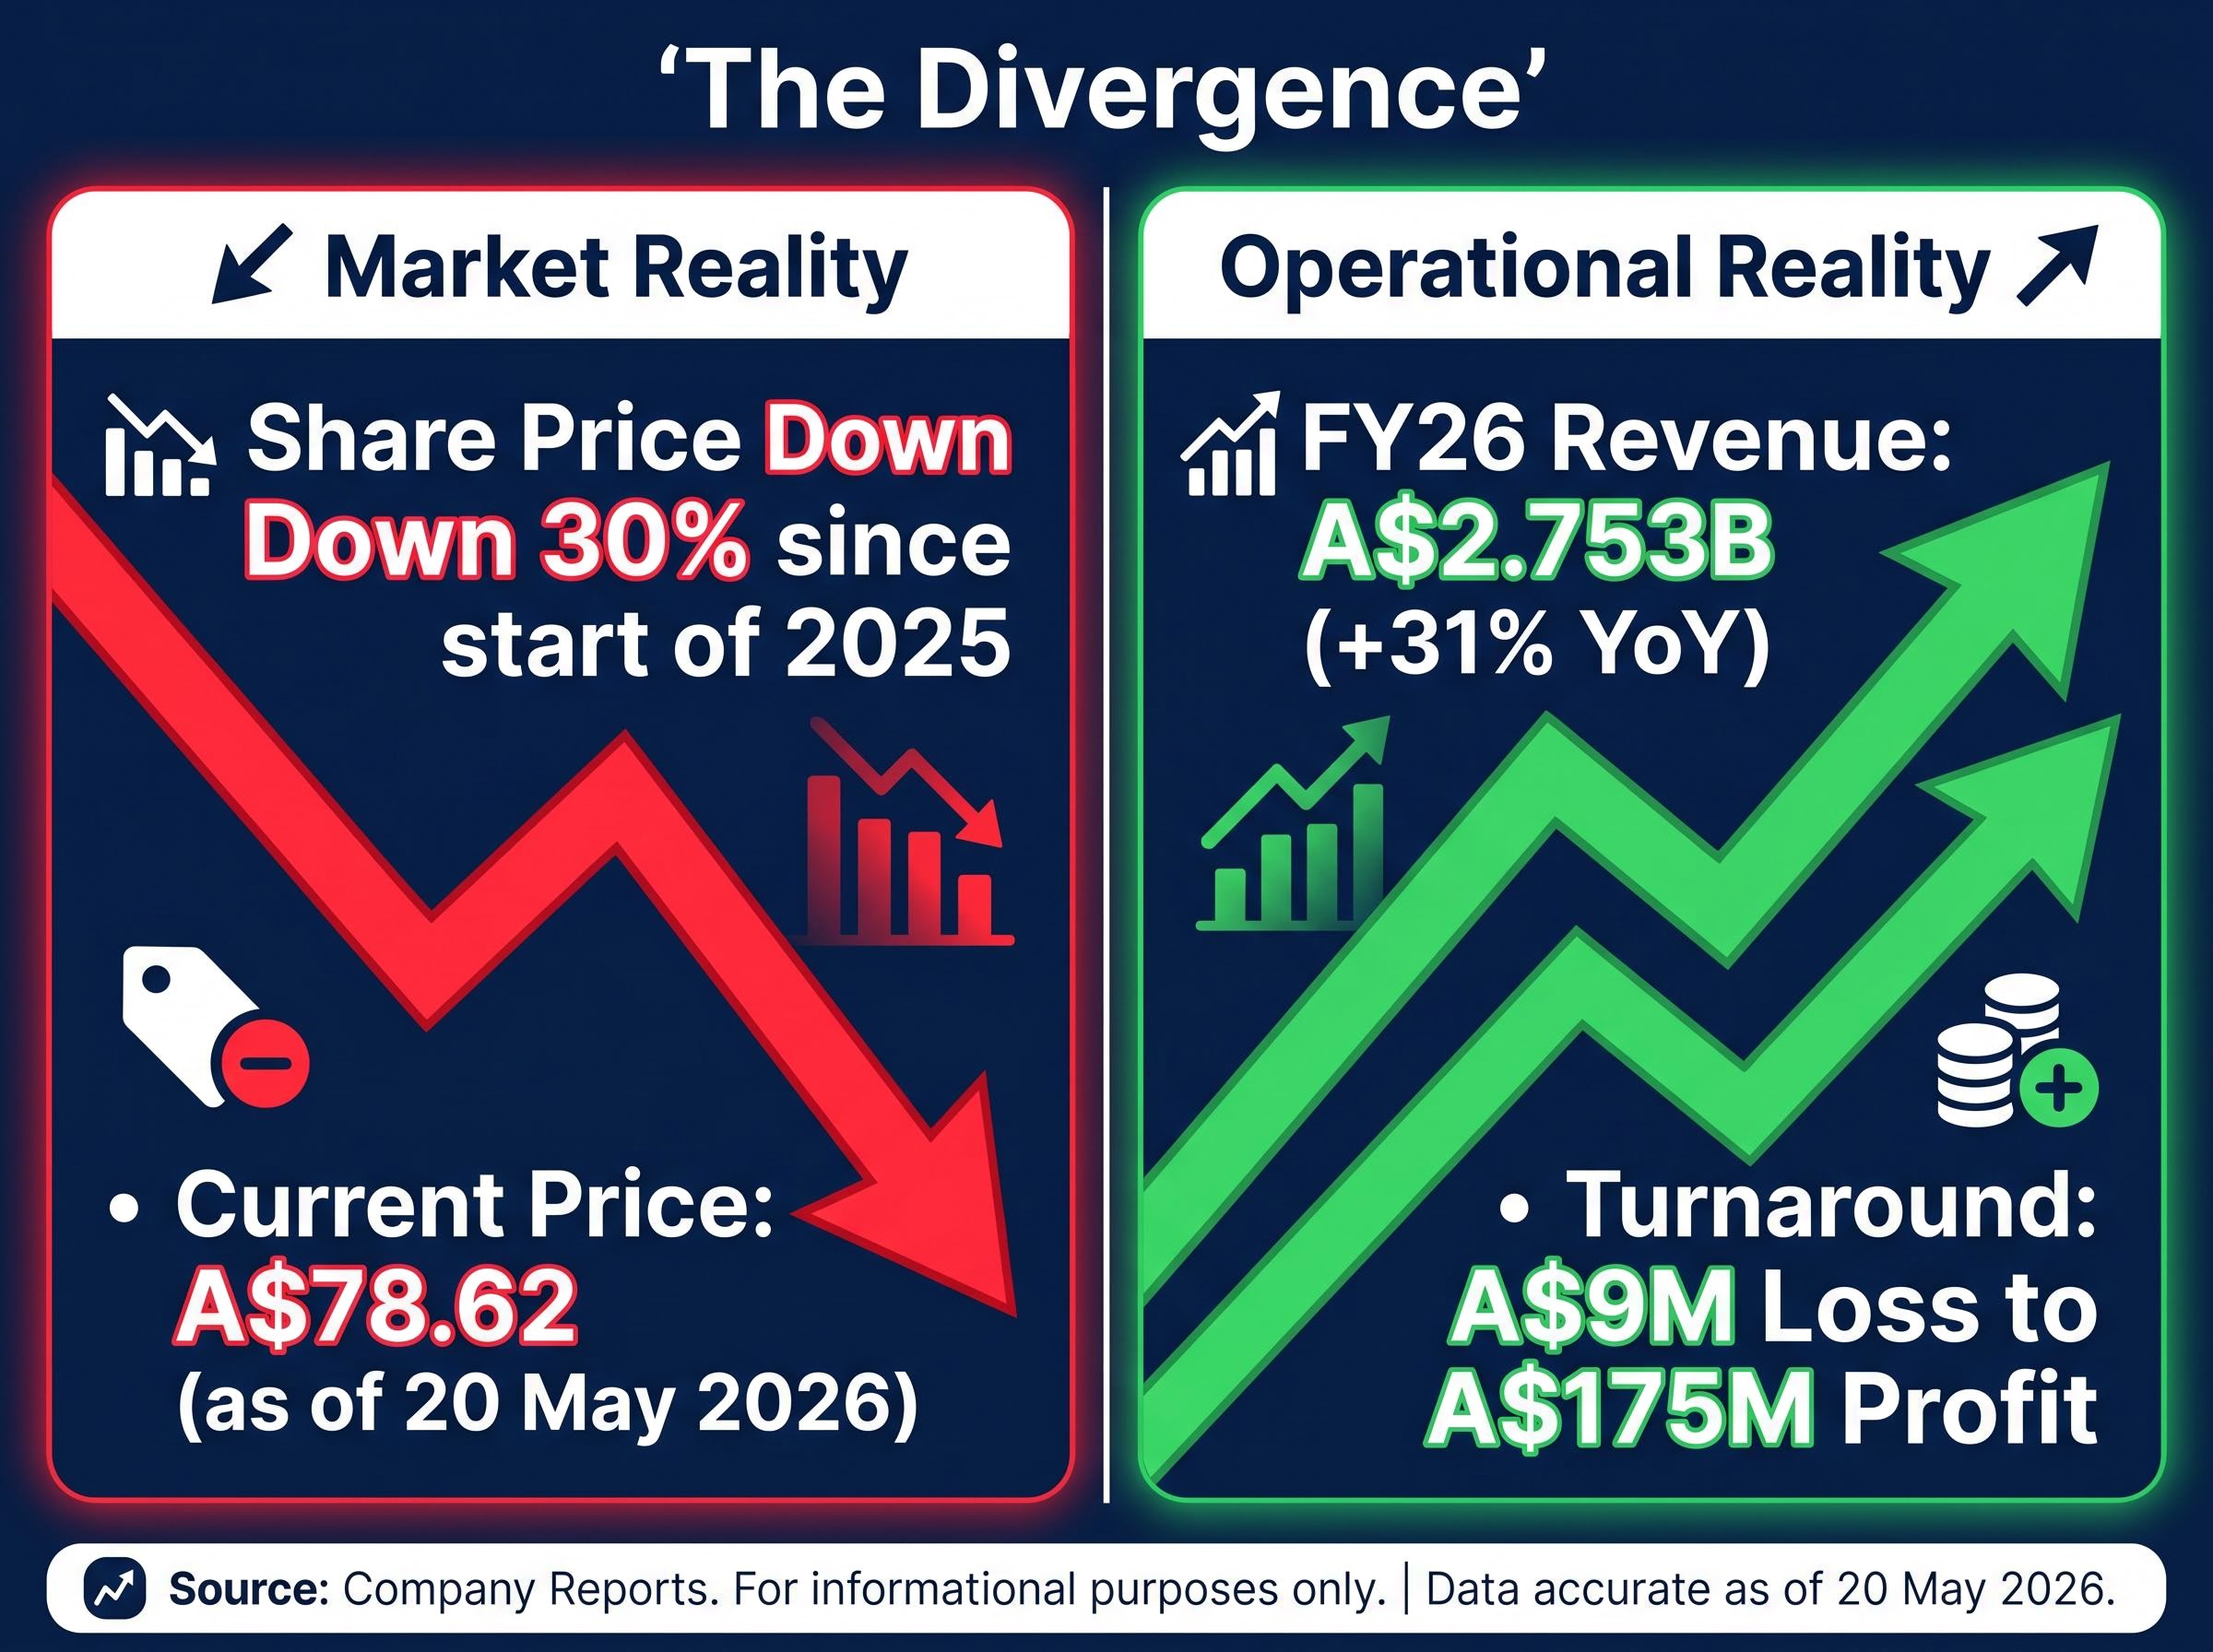
Xero’s share price has fallen roughly 30% since the start of 2025, yet the company just reported A$2.753 billion in full-year revenue, up 31% year-on-year, and has swung from a net loss to A$175 million in profit over three years. That gap between operational momentum and share price direction is the tension worth unpacking.
As of 20 May 2026, ASX:XRO trades at approximately A$78.62, a level well below the analyst consensus target range of A$129-A$141 across 14 brokers. The divergence has attracted attention from investors, small business owners, and accountants who follow the stock closely and want to understand whether the decline signals a structural problem or a valuation reset.
What follows is a walk through the financial metrics driving that question: revenue growth trajectory, gross margin quality, balance sheet resilience, and current valuation framing, giving readers a structured lens for evaluating what the falling Xero share price actually means.
The apparent contradiction is real. Xero has delivered accelerating revenue, record subscriber numbers, and a full profitability turnaround, yet the stock is down roughly 27-30% from where it started 2025. The explanation lies not in the business, but in how the market was pricing it.
Prior to the correction, Xero’s share price had embedded very high growth expectations. As global SaaS and growth-tech multiples compressed through 2025-26, the stock repriced even as underlying metrics improved. Three compounding factors drove the de-rating:
Earnings quality and rate sensitivity emerged as the two variables that most reliably separated ASX tech recovery stories from ongoing underperformers during the S&P/ASX 200 Information Technology Index’s 48% drawdown between August 2025 and March 2026, with companies carrying demonstrated profitability before the trough recovering materially faster than high-growth but cash-negative peers.
Morningstar’s framing describes the valuation as “demanding but less stretched” after the correction, attributing the de-rating to macro multiple compression rather than any collapse in the business itself.
Brokers including Macquarie and Morgan Stanley maintained Outperform and Overweight ratings through FY25-26, even as price targets were trimmed. The consensus range of A$77 to A$236 underscores how wide the disagreement remains.
The top-line story starts with the structural signal. Xero’s three-year revenue compound annual growth rate (CAGR) sits at 26.4% per year, a figure that reflects sustained momentum rather than a single strong quarter.
The most recent full-year result confirmed the pattern. FY26 operating revenue reached A$2.753 billion, up 31% on a reported basis and 28% in constant currency. That builds on earlier periods where annual revenue was approximately A$1,714 million, meaning the business has more than doubled its top line in three years.
Subscriber growth underpins the compounding. Xero ended FY25 with 4.16 million subscribers and grew that base to approximately 4.92 million by the end of FY26. In the first half of FY26, subscriber additions ran at approximately +10% year-on-year, while average revenue per user (ARPU) improved by approximately +8% in constant currency.
| Metric | Value |
|---|---|
| FY25 subscribers | 4.16 million |
| FY26 subscribers (approx.) | ~4.92 million |
| FY26 full-year revenue | A$2.753 billion (+31%) |
| Three-year revenue CAGR | 26.4% |
Revenue consistency at this scale and growth rate is uncommon among ASX-listed technology companies, and it provides the commercial foundation that makes Xero’s profitability turnaround credible rather than incidental.
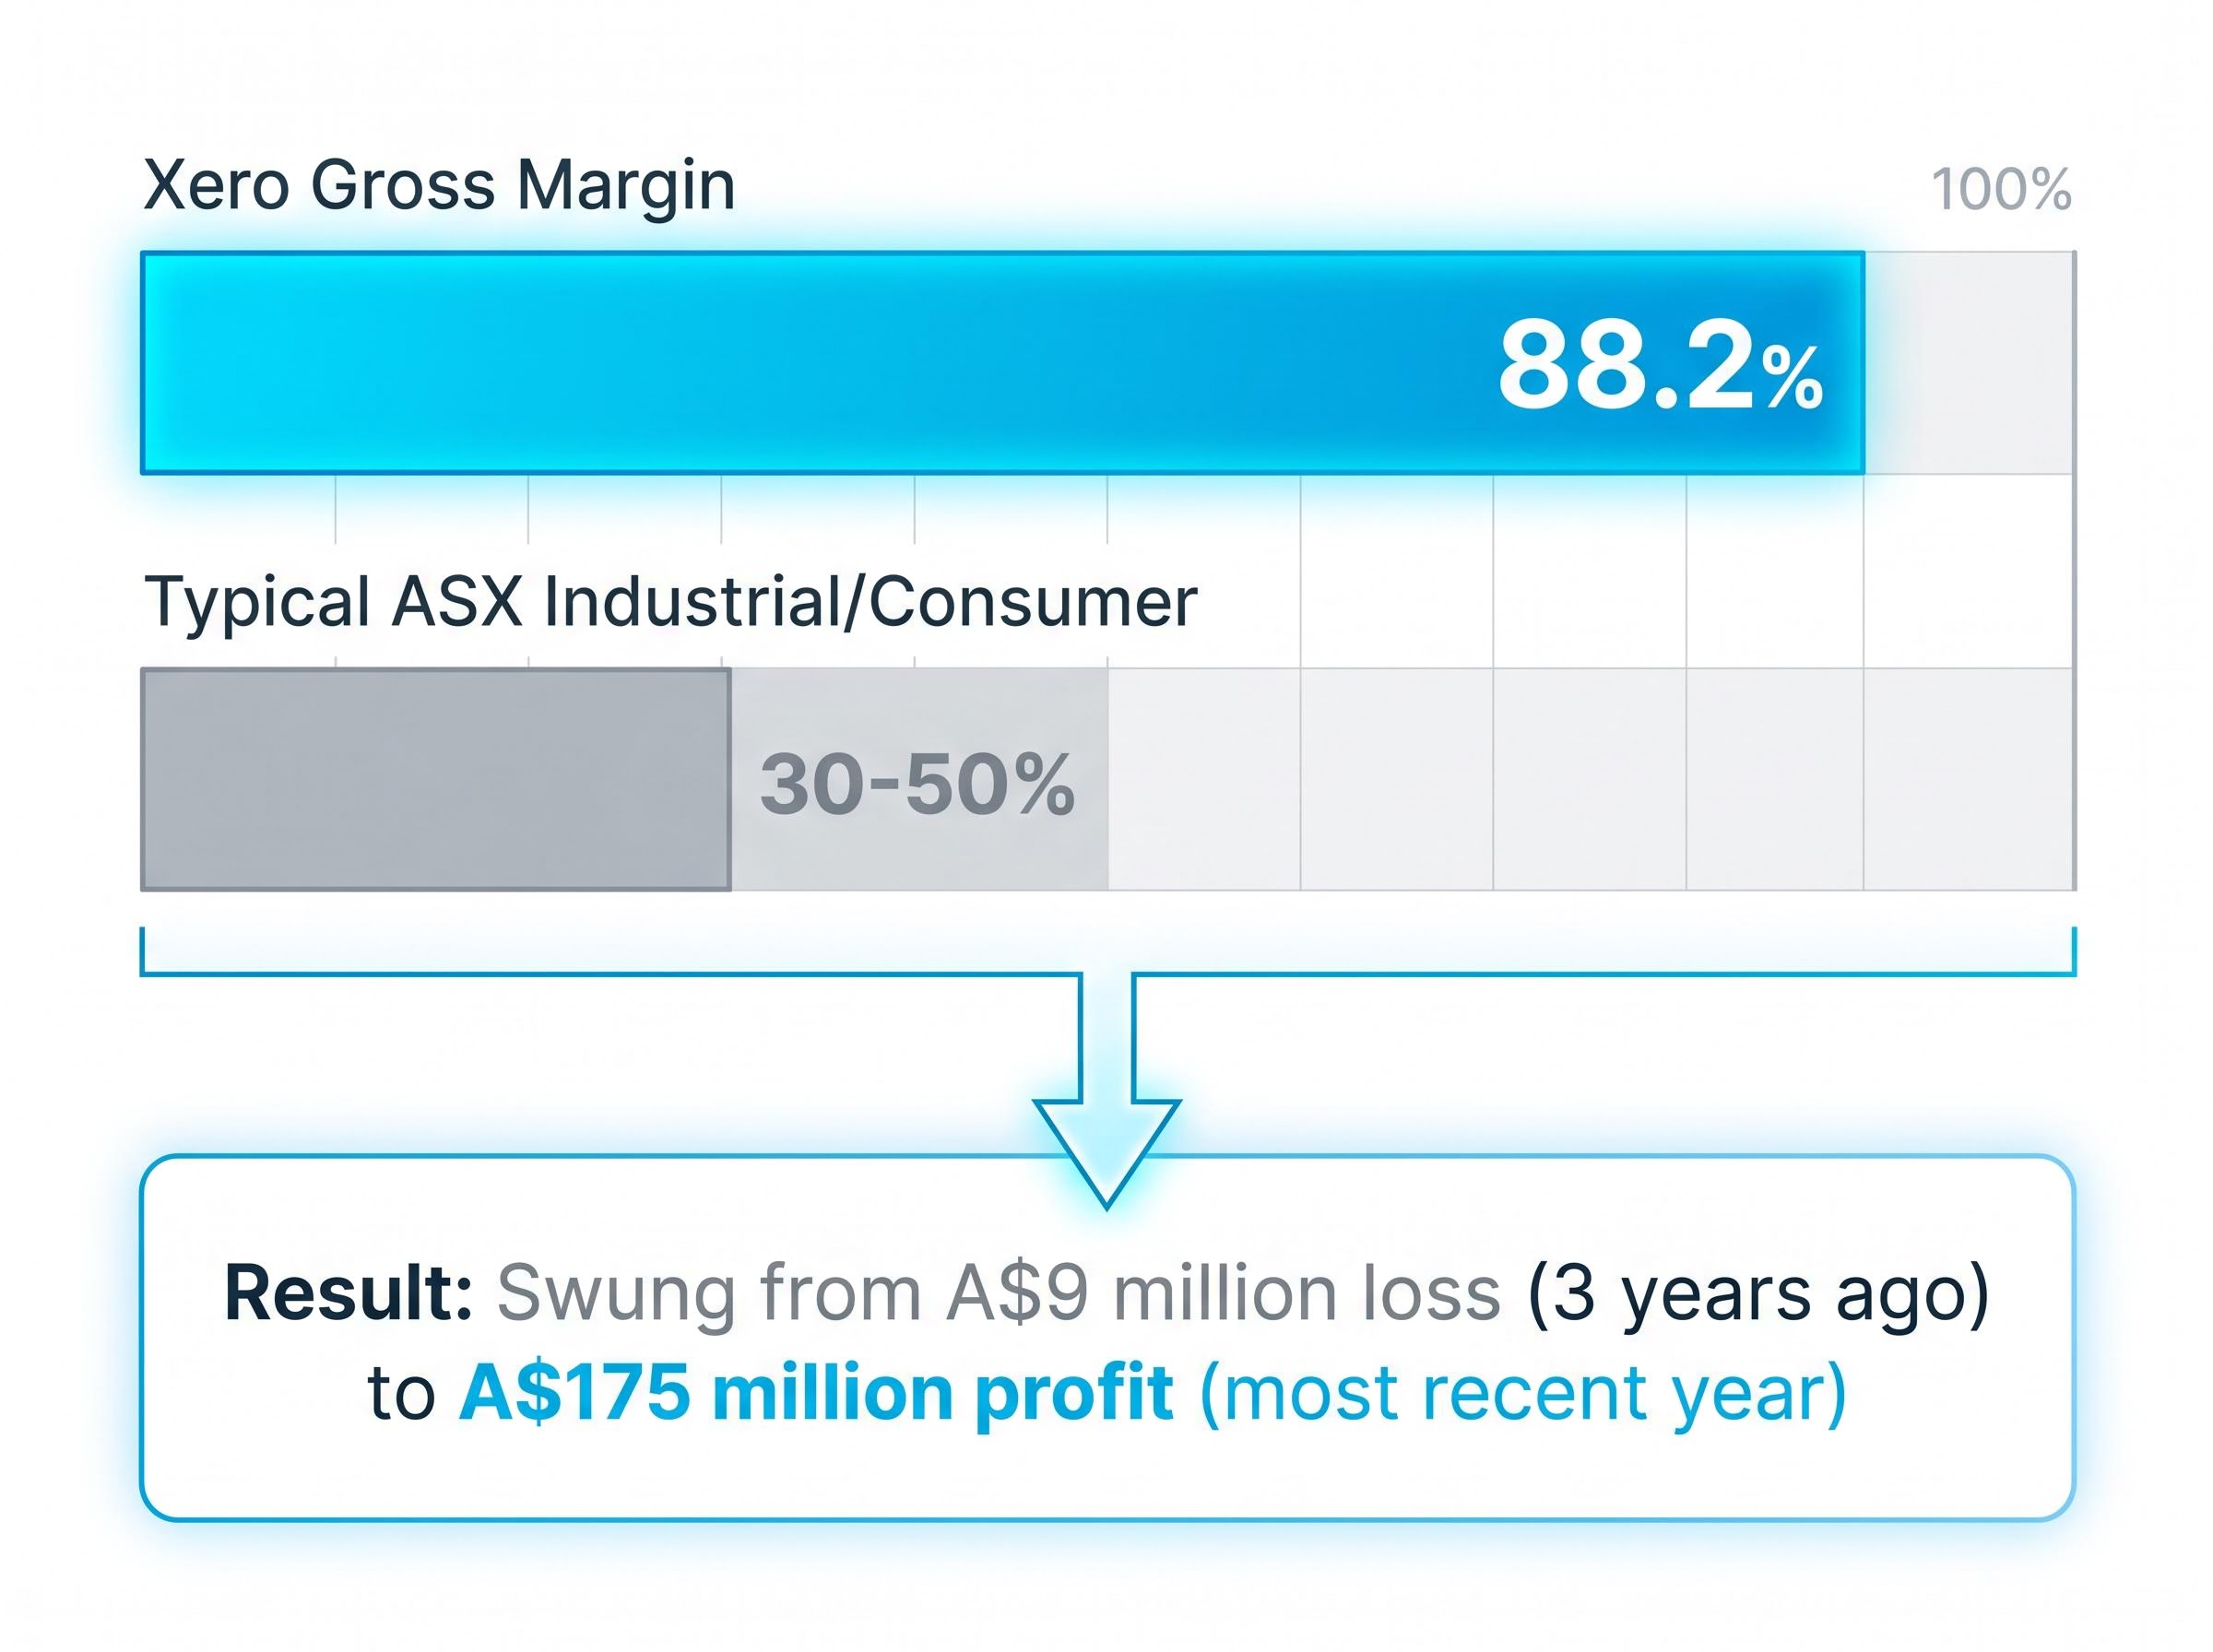
The profitability swing is striking on its own. Three years ago, Xero reported a net loss of A$9 million. The most recent financial year delivered a net profit of A$175 million. The number that explains how the business got from one to the other is the gross margin.
Gross margin: 88.2%. This means Xero retains more than 88 cents of every dollar of revenue after direct product costs, before overhead expenses such as sales, marketing, and R&D are applied.
Gross margin measures the profitability of the core product itself, before a company spends on growth, administration, or expansion. An 88.2% gross margin is exceptionally high by any standard and signals strong pricing power and scalability.
The contrast tells the story:
First-half FY26 results reinforced the trajectory: net profit of A$54.1 million compared with a net loss of A$16.1 million in H1 FY23. EBITDA for the same period reached approximately A$206.1 million, up roughly 90% versus the prior comparable period.
The Melio acquisition impact on margins is the most significant new variable in Xero’s FY26 result: gross profit margin contracted from 89% to 83.9%, the largest single-year compression in Xero’s listed history, even as EBITDA rose 18% and free cash flow expanded 9%, signalling that the margin question is real but operating momentum beneath the headline remained intact.
For investors assessing whether the profitability is durable or cosmetic, the gross margin is the single most telling number. It confirms that the business model itself is highly profitable, and that the historical losses were an investment choice rather than a structural flaw.
A balance sheet tells an investor whether a company can survive a downturn, sustain investment, or pursue strategic opportunities without diluting shareholders. Each of Xero’s three key balance sheet metrics answers a specific question.
| Metric | Value | What it signals |
|---|---|---|
| Net debt | Negative A$306 million | Cash reserves exceed total borrowings by A$306 million, providing a buffer against rising interest costs or an economic downturn |
| Debt-to-equity ratio | 87.9% | Equity exceeds debt; the ratio should be read alongside the net cash position rather than in isolation |
| Return on equity (FY24) | 14.3% | Measures how efficiently shareholder capital is deployed; for a high-growth software company reinvesting heavily, this reading is context-dependent |
The net cash position of A$306 million is the most important of the three. It means Xero does not face refinancing pressure, can continue investing in AI and product development from internal cash generation, and is not reliant on equity markets to fund operations.
No major equity raising or capital structure overhaul has been announced via ASX since January 2025. The balance sheet provides meaningful insulation against the macro risks that have pressured the share price.
The question behind every share price decline is the same: is it the business deteriorating, or is it the valuation premium the market was willing to pay? Xero’s own data provides a worked example for a four-step evaluation framework that applies to any ASX-listed growth stock where the share price and the business narrative appear to diverge.
XRO’s price-to-sales discount relative to its own five-year average sits at approximately 53%, with the current ratio of 8.70x compared against a historical average of 18.65x, a compression that contextualises the analyst consensus targets and helps explain why long-term holders see the current level as a structural dislocation rather than a valuation correction.
Morningstar’s 14 May 2026 assessment adds a qualifier: despite the 30% decline, the stock was still described as trading at a “premium to fair value,” meaning not all independent analysts view the current price as definitively cheap.
Financial metrics alone are a starting point, not a conclusion. Intuit, Xero’s nearest global comparable, provides useful context. Xero commands a higher revenue growth premium but operates at lower current margins, a profile that justifies a growth multiple but also embeds execution risk.
Peer comparison prevents investors from evaluating any single stock in isolation. Competitive positioning, addressable market size, and relative valuation against comparable businesses are the next steps before any investment decision.
Intuit’s FY2025 results reported total revenue of US$18.8 billion growing at 16% year-on-year, a useful benchmark that highlights Xero’s faster top-line growth rate while also illustrating the margin maturity gap that investors weighing the two businesses must account for.
The operational signals are clear. Revenue growth is intact at 31% for FY26, gross margin is exceptional at 88.2%, the balance sheet carries net cash, and the subscriber base has expanded to approximately 4.92 million. The tension is that even after a 30% decline, independent analysts including Morningstar characterise the valuation as premium rather than cheap.
Two strategic variables will most influence the share price from here:
The Melio breakeven timeline, targeted for H2 FY28 with management guiding toward US$70 million in revenue synergies, is the most specific forward indicator the market has for assessing whether the US payments strategy can eventually contribute to margins rather than compress them.
Morningstar’s Roy Van Keulen noted on 14 May 2026 that Xero’s ANZ business is “overlooked” by the prevailing international expansion narrative, a reminder that the most reliable earnings engine may be closer to home than the market’s attention suggests.
For investors watching ASX:XRO in 2026, the question is not whether the business is good. The metrics confirm it is. The question is whether the price already reflects that quality.
Xero’s financial fundamentals are among the strongest on the ASX for a technology company of its size. The current share price, even after a 30% decline, is not yet characterised by independent analysts as cheap.
Three points anchor the analysis. The decline is overwhelmingly valuation-driven rather than business-driven. The gross margin and balance sheet provide structural resilience. Forward returns depend on US execution and the AI margin trajectory.
Investors considering a position should review Xero’s official FY26 investor materials, particularly the H1 FY26 ASX announcements from November 2025, compare the stock against global peers such as Intuit, and monitor analyst consensus revisions as H2 FY26 results emerge.
This article is for informational purposes only and should not be considered financial advice. Investors should conduct their own research and consult with financial professionals before making investment decisions. Past performance does not guarantee future results. Financial projections are subject to market conditions and various risk factors.
The decline is primarily valuation-driven rather than business-driven. Global interest rate rises and a rotation away from long-duration growth stocks compressed SaaS multiples, hitting Xero's historically elevated price-to-sales and forward P/E ratios even as underlying revenue and profitability continued to improve.
Xero's gross margin is 88.2%, meaning the company retains more than 88 cents of every revenue dollar after direct product costs. This exceptionally high figure confirms the core business model is highly profitable and that past losses were the result of deliberate growth investment rather than a structural flaw.
Across 14 brokers, the consensus target range sits between A$129 and A$141, compared to the current trading price of approximately A$78.62, though the full range of individual analyst targets spans from A$77 to A$236, reflecting significant disagreement on fair value.
Xero ended FY26 with approximately 4.92 million subscribers, up from 4.16 million at the end of FY25. Subscriber additions ran at roughly 10% year-on-year in the first half of FY26, supported by average revenue per user growth of approximately 8% in constant currency.
The two main forward variables are whether AI product investment delivers margin expansion or further margin compression, and whether the US expansion strategy including the Melio payments partnership gains measurable commercial traction, with the Melio breakeven targeted for H2 FY28.