ASX 200 Enters June 2026 With Stretched Valuations and Upside Risk
10 hrs ago

Westpac shares fell 6.5% during May 2026 while the S&P/ASX 200 posted a gain of 0.76%, a gap of more than seven percentage points that demands a precise explanation rather than a vague reference to market conditions. The decline unfolded against three simultaneous pressures: a scheduled ex-dividend date in early May, a $26 million Federal Court penalty ruling handed down on 27 May 2026, and sector-wide selling that dragged the S&P/ASX 200 Banks Index (XBK) down 5.33% over the month. None of these factors is straightforward in isolation; together they compounded in ways that can mislead investors who encounter only the headline price movement. What follows breaks down each driver independently, explains the mechanics behind it, and synthesises what the combination means for investors assessing whether May’s decline is a temporary price dislocation or something more structurally concerning.
Westpac opened May near $38.50 and closed the month at $36.00, a decline of approximately 6.5%. The S&P/ASX 200 gained 0.76% over the same period. That seven-percentage-point divergence is striking, but the more revealing comparison sits one level closer to Westpac’s peer group.
The XBK fell 5.33% in May, confirming that bank stocks broadly sold off. Westpac’s additional underperformance versus the banking index was approximately 1.2 percentage points, a narrower gap that reframes the analytical question. How much of the 6.5% decline is mechanical? How much is sector-driven? And how much reflects company-specific news that investors need to weigh independently?
The table below sets out the month’s performance side by side.
| Index / Stock | May 2026 Open (approx.) | May 2026 Close (approx.) | Monthly Return |
|---|---|---|---|
| Westpac (WBC) | $38.50 | $36.00 | −6.5% |
| XBK Banks Index | — | — | −5.33% |
| S&P/ASX 200 | — | — | +0.76% |
Westpac’s decline did not occur against a healthy sector backdrop. The XBK’s 5.33% fall confirms that Australian bank stocks collectively came under pressure during May, with banks and miners leading the broader ASX 200 softness for the month.
Three macro catalysts were cited across Australian Financial Review and Motley Fool Australia coverage as drivers of the sector-wide selling, though independent claim-level confirmation remains limited:
These factors applied across all four major Australian banks simultaneously. An investor attributing all of Westpac’s May decline to company-specific issues would be misreading the environment. The sector headwind accounts for the bulk of the fall, and recognising that distinction is the first step toward accurate portfolio assessment.
The three macro forces compressing bank earnings in May 2026, a rapid RBA re-hiking cycle, federal budget property measures, and an energy price shock, were not operating sequentially but simultaneously, a combination that drove the sector’s approximately $800 million in additional loan loss provisions before any confirmed deterioration in arrears had materialised.
On 8 May 2026, Westpac shares went ex-dividend. The bank declared a fully franked interim dividend of 77 cents per share, with a payment date of 26 June 2026. On the ex-dividend date, the share price is expected to fall by approximately the value of the dividend, because the forthcoming cash payment is effectively removed from the stock’s market price.
This is not a loss for investors who held shares before the ex-dividend date. They retain entitlement to the 77-cent payment. The economic value has not disappeared; it has shifted form from capital to income. On a $38.50 opening price, the 77-cent adjustment accounts for approximately 2 percentage points of the month’s 6.5% decline, a portion that carries no negative signal about the company’s health.
At the month-end price of $36.00, Westpac’s estimated forward fully franked yield sits at approximately 4.3% (annualised on 155 cents per share). The grossed-up yield, which incorporates the benefit of franking credits at the 30% corporate tax rate, ranges from approximately 5.5% to 6.2% depending on the reference price and methodology used.
The grossed-up yield calculation uses a standard formula, cash dividend multiplied by 30 divided by 70, reflecting the 30% corporate tax already paid by Westpac at the company level, and the result differs meaningfully depending on whether the investor is an individual, a superannuation fund in accumulation phase, or an SMSF in pension phase paying zero tax.
Grossed-up yield context: Westpac’s own 1H26 investor materials report a grossed-up yield of 5.5% based on the share price at time of results, while analysis from Motley Fool Australia calculates approximately 6.2% at $36.00. For eligible Australian investors who can access franking credits, these figures represent the effective after-tax return, a consideration that headline yield figures alone do not capture.
Three dates matter for dividend investors:
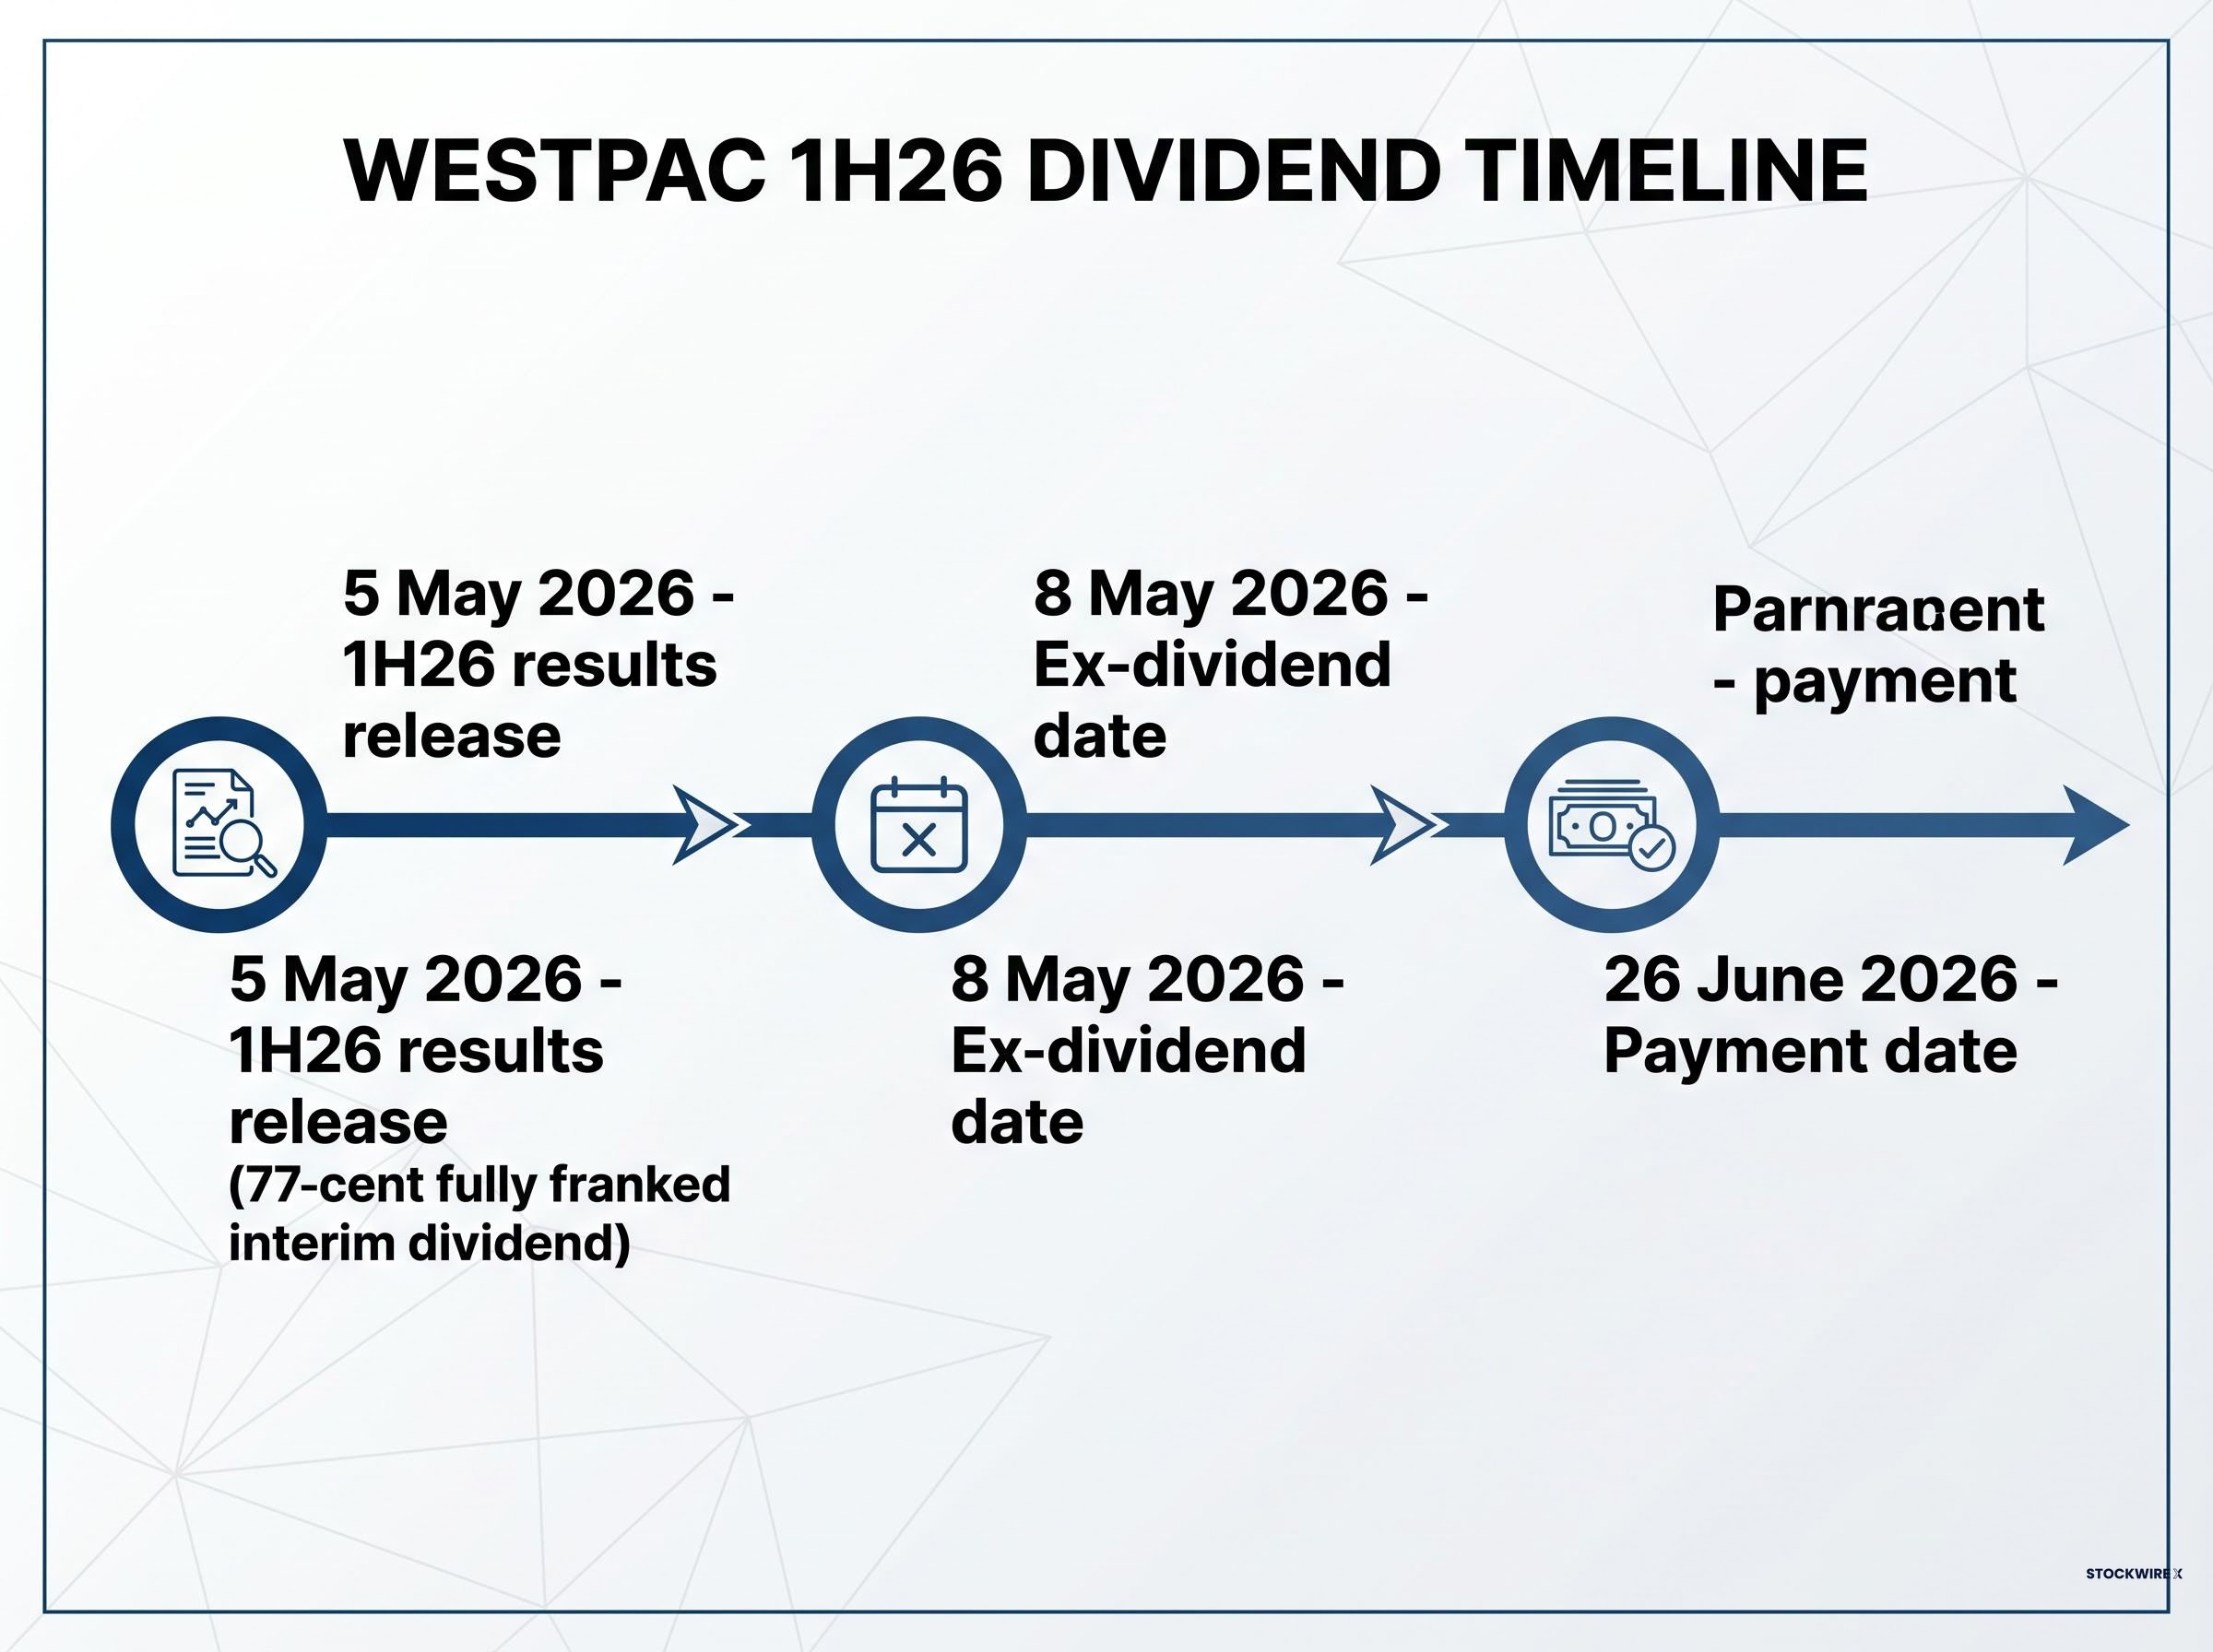
On 27 May 2026, the Federal Court of Australia delivered a ruling that carried more weight in sentiment than in dollars. Justice McEvoy ordered Westpac to pay a $26 million civil penalty after finding the bank failed to respond to more than 200 online hardship requests within the statutory timeframe. The breaches spanned approximately six years, from 2017 to 2023. ASIC initiated the proceedings and published the findings under media release 26-107MR.
The ASIC media release 26-107MR sets out the Federal Court’s findings in full, including the statutory obligations Westpac breached, the duration of the failures across 2017-2023, and Justice McEvoy’s reasoning for the $26 million penalty quantum.
The scale of the breach: More than 200 online hardship requests went unanswered within the legally required timeframe, over a period spanning 2017 to 2023. The six-year duration of the failures intensified the regulatory scrutiny surrounding the ruling.
Financially, the $26 million penalty is modest relative to Westpac’s earnings base. It does not materially affect near-term profitability or dividend capacity; the 77-cent interim dividend remains confirmed for 26 June 2026 payment.
The share price reaction, however, reflected something beyond the dollar amount. Westpac carries a compliance history that gives each new regulatory development amplified weight. The 2020 AUSTRAC money-laundering settlement, responsible-lending remediation programmes, and now the hardship-response failures create a pattern that investors price through sentiment rather than through direct earnings impact. Distinguishing between the financial materiality of a penalty and its sentiment materiality is a skill this ruling illustrates clearly: the $26 million figure alone would not move a major bank stock, but the pattern behind it can.
The Federal Court ruling landed into an already-strained environment: the ASX Financials sector on 27 May faced a rare configuration in which supportive bond yield conditions were overwhelmed by stock-specific headwinds, with Westpac’s penalty compounding the sector-wide drag from ASX Ltd.’s record single-day collapse.
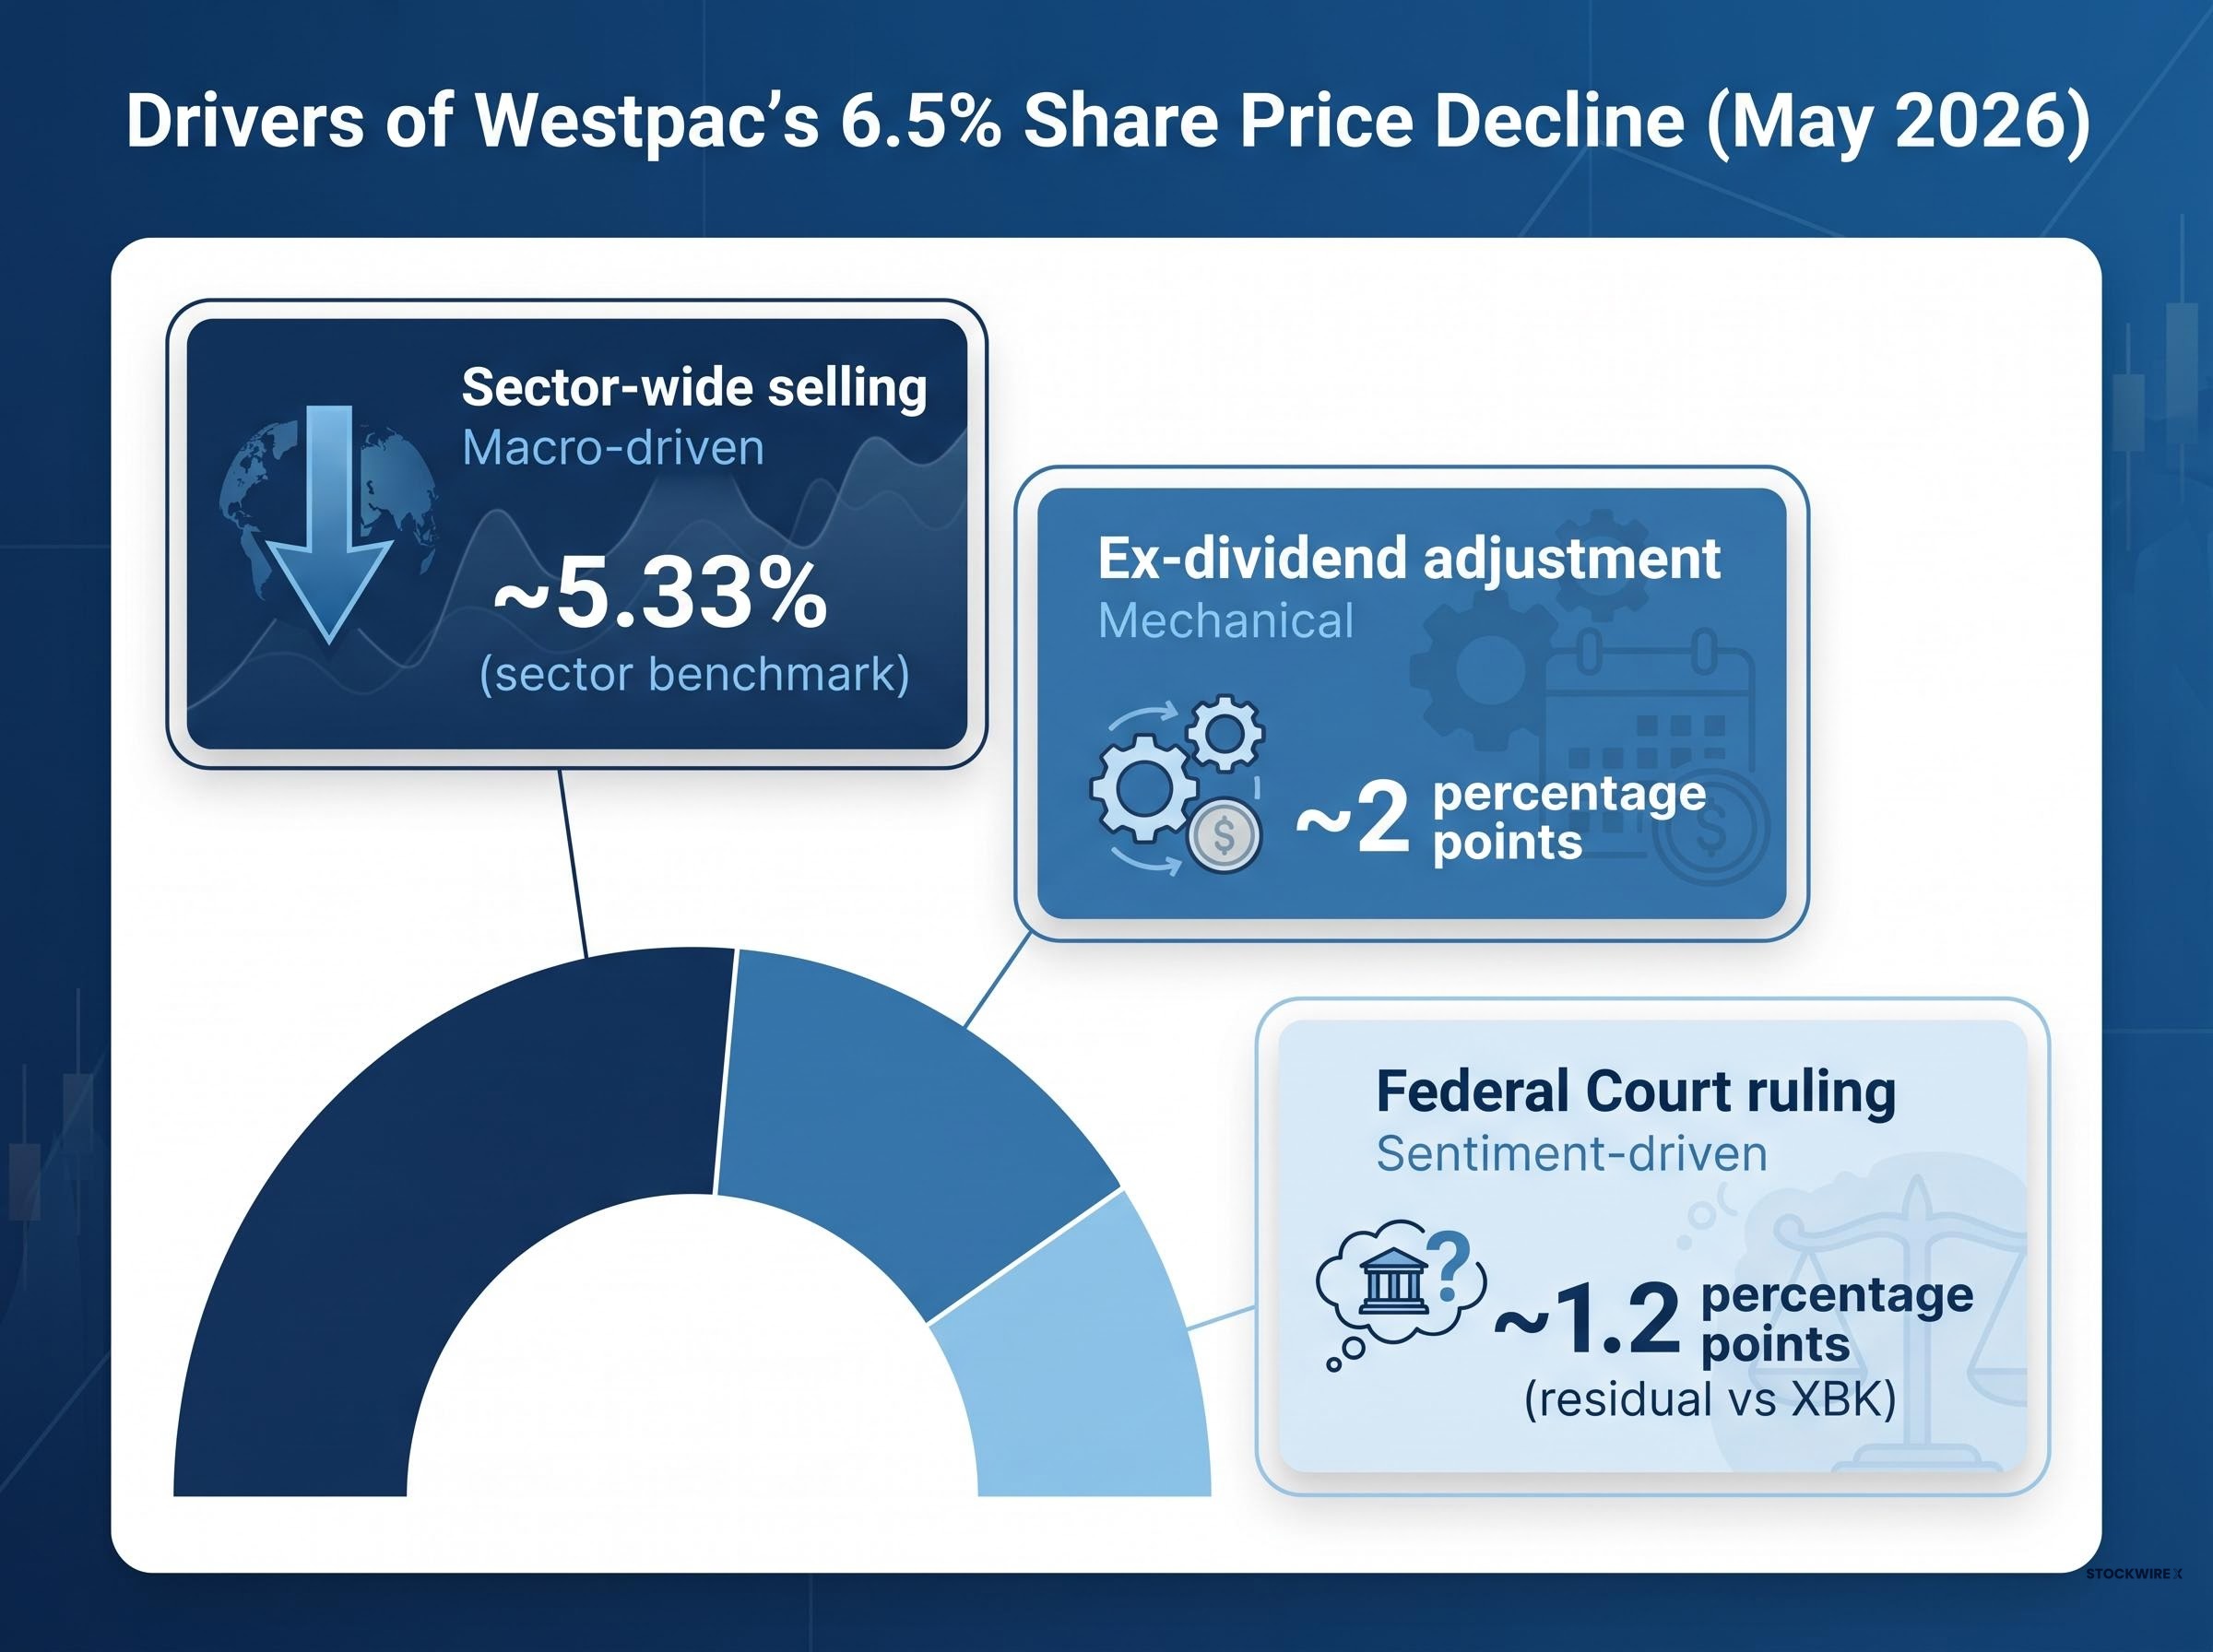
Three distinct forces contributed to Westpac’s 6.5% May decline, and each belongs in a different analytical category.
| Driver | Type | Estimated Impact |
|---|---|---|
| Ex-dividend adjustment (77c on ~$38.50) | Mechanical, value-neutral for entitled holders | ~2 percentage points |
| Federal Court ruling ($26M penalty) | Sentiment-driven, limited financial materiality | ~1.2 percentage points (residual vs XBK) |
| Sector-wide selling (XBK decline) | Macro-driven, exogenous to Westpac fundamentals | ~5.33% (sector benchmark) |
The mechanical component requires no investor response. Shareholders entitled to the dividend receive it on 26 June 2026; the price adjustment is arithmetic, not a signal. The sector component reflects macro conditions, specifically the RBA outlook, Federal Budget changes, and global inflation pressures, that are beyond any single bank’s control. The residual 1.2 percentage points of incremental underperformance versus the XBK is the portion most plausibly attributable to the court ruling’s sentiment impact.
This disaggregation introduces a distinction worth carrying beyond Westpac. A temporary price dislocation occurs when the fundamental investment case, earnings capacity, dividend sustainability, competitive position, remains unchanged despite a share price fall. Fundamental deterioration occurs when those underlying factors have genuinely worsened.
The $26 million penalty does not impair Westpac’s dividend capacity. The sector selling reflects macro conditions that could shift. The ex-dividend adjustment is resolved by the payment itself. By these measures, the May decline sits closer to dislocation than deterioration, though the compliance trajectory introduces a variable that cannot yet be resolved.
As of 31 May 2026, the state of play is relatively clear on two of the three drivers and genuinely open on the third. The mechanical ex-dividend impact is resolved: investors entitled to the 77-cent dividend will receive it on 26 June 2026. The sector macro pressures remain live, with the RBA’s rate path and Federal Budget implications still unfolding. The compliance risk trajectory is the open question.
Income dimension: At a share price of $36.00, Westpac’s grossed-up yield sits between approximately 5.5% (Westpac investor pack basis) and 6.2% (Motley Fool Australia calculation). For eligible Australian investors, the franking credit component lifts the effective return materially above the nominal yield.
The question that matters most for existing holders is whether the 6.5% decline represents a buying opportunity at a higher grossed-up yield, or whether the persistent pattern of compliance events, from the 2020 AUSTRAC settlement through responsible-lending remediation to the May 2026 hardship ruling, represents an accumulating risk that is not yet fully priced in.
Available sourced analyst commentary as of 31 May 2026 does not resolve this question definitively. The honest investor position is one of informed watchfulness rather than confident conclusion.
For investors wanting to extend their analysis beyond the confirmed 77-cent interim payment, our deep-dive into Westpac’s dividend forecast through FY28 examines the earnings trajectory assumptions, UNITE programme cost risks, and mortgage margin compression pressures that could either support or constrain the projected growth from $1.53 to $1.70 per share.
Westpac’s May performance is not an isolated curiosity. It reflects structural features of Australian bank stocks that repeat across reporting seasons and ex-dividend cycles.
Three characteristics make the sector behave distinctively:
Grossed-up yields illustrate the income appeal of Australian bank stocks. Fully franked dividends carry attached tax credits (franking credits) redeemable by eligible Australian investors, effectively lifting the after-tax yield above the nominal dividend yield. This income dimension keeps retail investor interest high, but it also means that any development threatening dividend sustainability, including sustained regulatory pressure, receives outsized attention.
Westpac’s compliance history, from AUSTRAC through responsible-lending remediation to the May 2026 hardship ruling, is the clearest current example of how regulatory risk can accumulate without any single event being financially material on its own.
Westpac’s 6.5% May decline against the ASX 200’s 0.76% gain produced a seven-percentage-point gap that looks alarming as a headline. Disaggregated, it tells a more measured story: approximately 2 percentage points of mechanical ex-dividend adjustment (value-neutral for entitled holders), a 5.33% sector headwind driven by macro conditions beyond Westpac’s control, and an incremental 1.2 percentage points of company-specific sentiment pressure most plausibly linked to the Federal Court ruling.
What remains genuinely open is the compliance trajectory, the evolving RBA and Federal Budget macro environment, and whether $36.00 represents an attractive entry point or a fair reflection of accumulated risk.
The 26 June 2026 dividend payment is the next concrete data point confirming the income dimension of the Westpac holding case. ASIC’s ongoing regulatory activity is the leading indicator of whether compliance risk is stabilising or compounding.
This article is for informational purposes only and should not be considered financial advice. Investors should conduct their own research and consult with financial professionals before making investment decisions. Past performance does not guarantee future results.
Westpac shares fell approximately 6.5% in May 2026 due to three overlapping factors: a 77-cent fully franked ex-dividend adjustment on 8 May (accounting for roughly 2 percentage points), sector-wide bank selling that dragged the XBK Banks Index down 5.33%, and a $26 million Federal Court penalty ordered on 27 May 2026 for failing to respond to hardship requests within the required timeframe.
An ex-dividend price adjustment is a mechanical drop in a share price on the ex-dividend date, reflecting the removal of the upcoming dividend payment from the stock's market value. For Westpac shareholders who held shares before 8 May 2026, the 77-cent decline in price is offset by their entitlement to receive that 77 cents as a cash dividend on 26 June 2026, meaning no economic value is lost.
On 27 May 2026, the Federal Court ordered Westpac to pay a $26 million civil penalty after finding the bank failed to respond to more than 200 online hardship requests within the statutory timeframe, with the breaches spanning approximately six years from 2017 to 2023. ASIC initiated the proceedings and published the findings under media release 26-107MR.
At a share price of $36.00 following May 2026's decline, Westpac's grossed-up yield (which incorporates the 30% corporate tax already paid via franking credits) is estimated between approximately 5.5% based on Westpac's own investor materials and approximately 6.2% based on external analysis, making it materially higher than the nominal dividend yield for eligible Australian investors.
The S&P/ASX 200 Banks Index (XBK) tracks the collective performance of Australian bank stocks, providing a sector benchmark that helps investors separate macro-driven selling from company-specific factors. In May 2026, the XBK fell 5.33%, revealing that most of Westpac's 6.5% decline was driven by broad sector headwinds rather than Westpac-specific issues, with only around 1.2 percentage points of incremental underperformance attributable to company news.