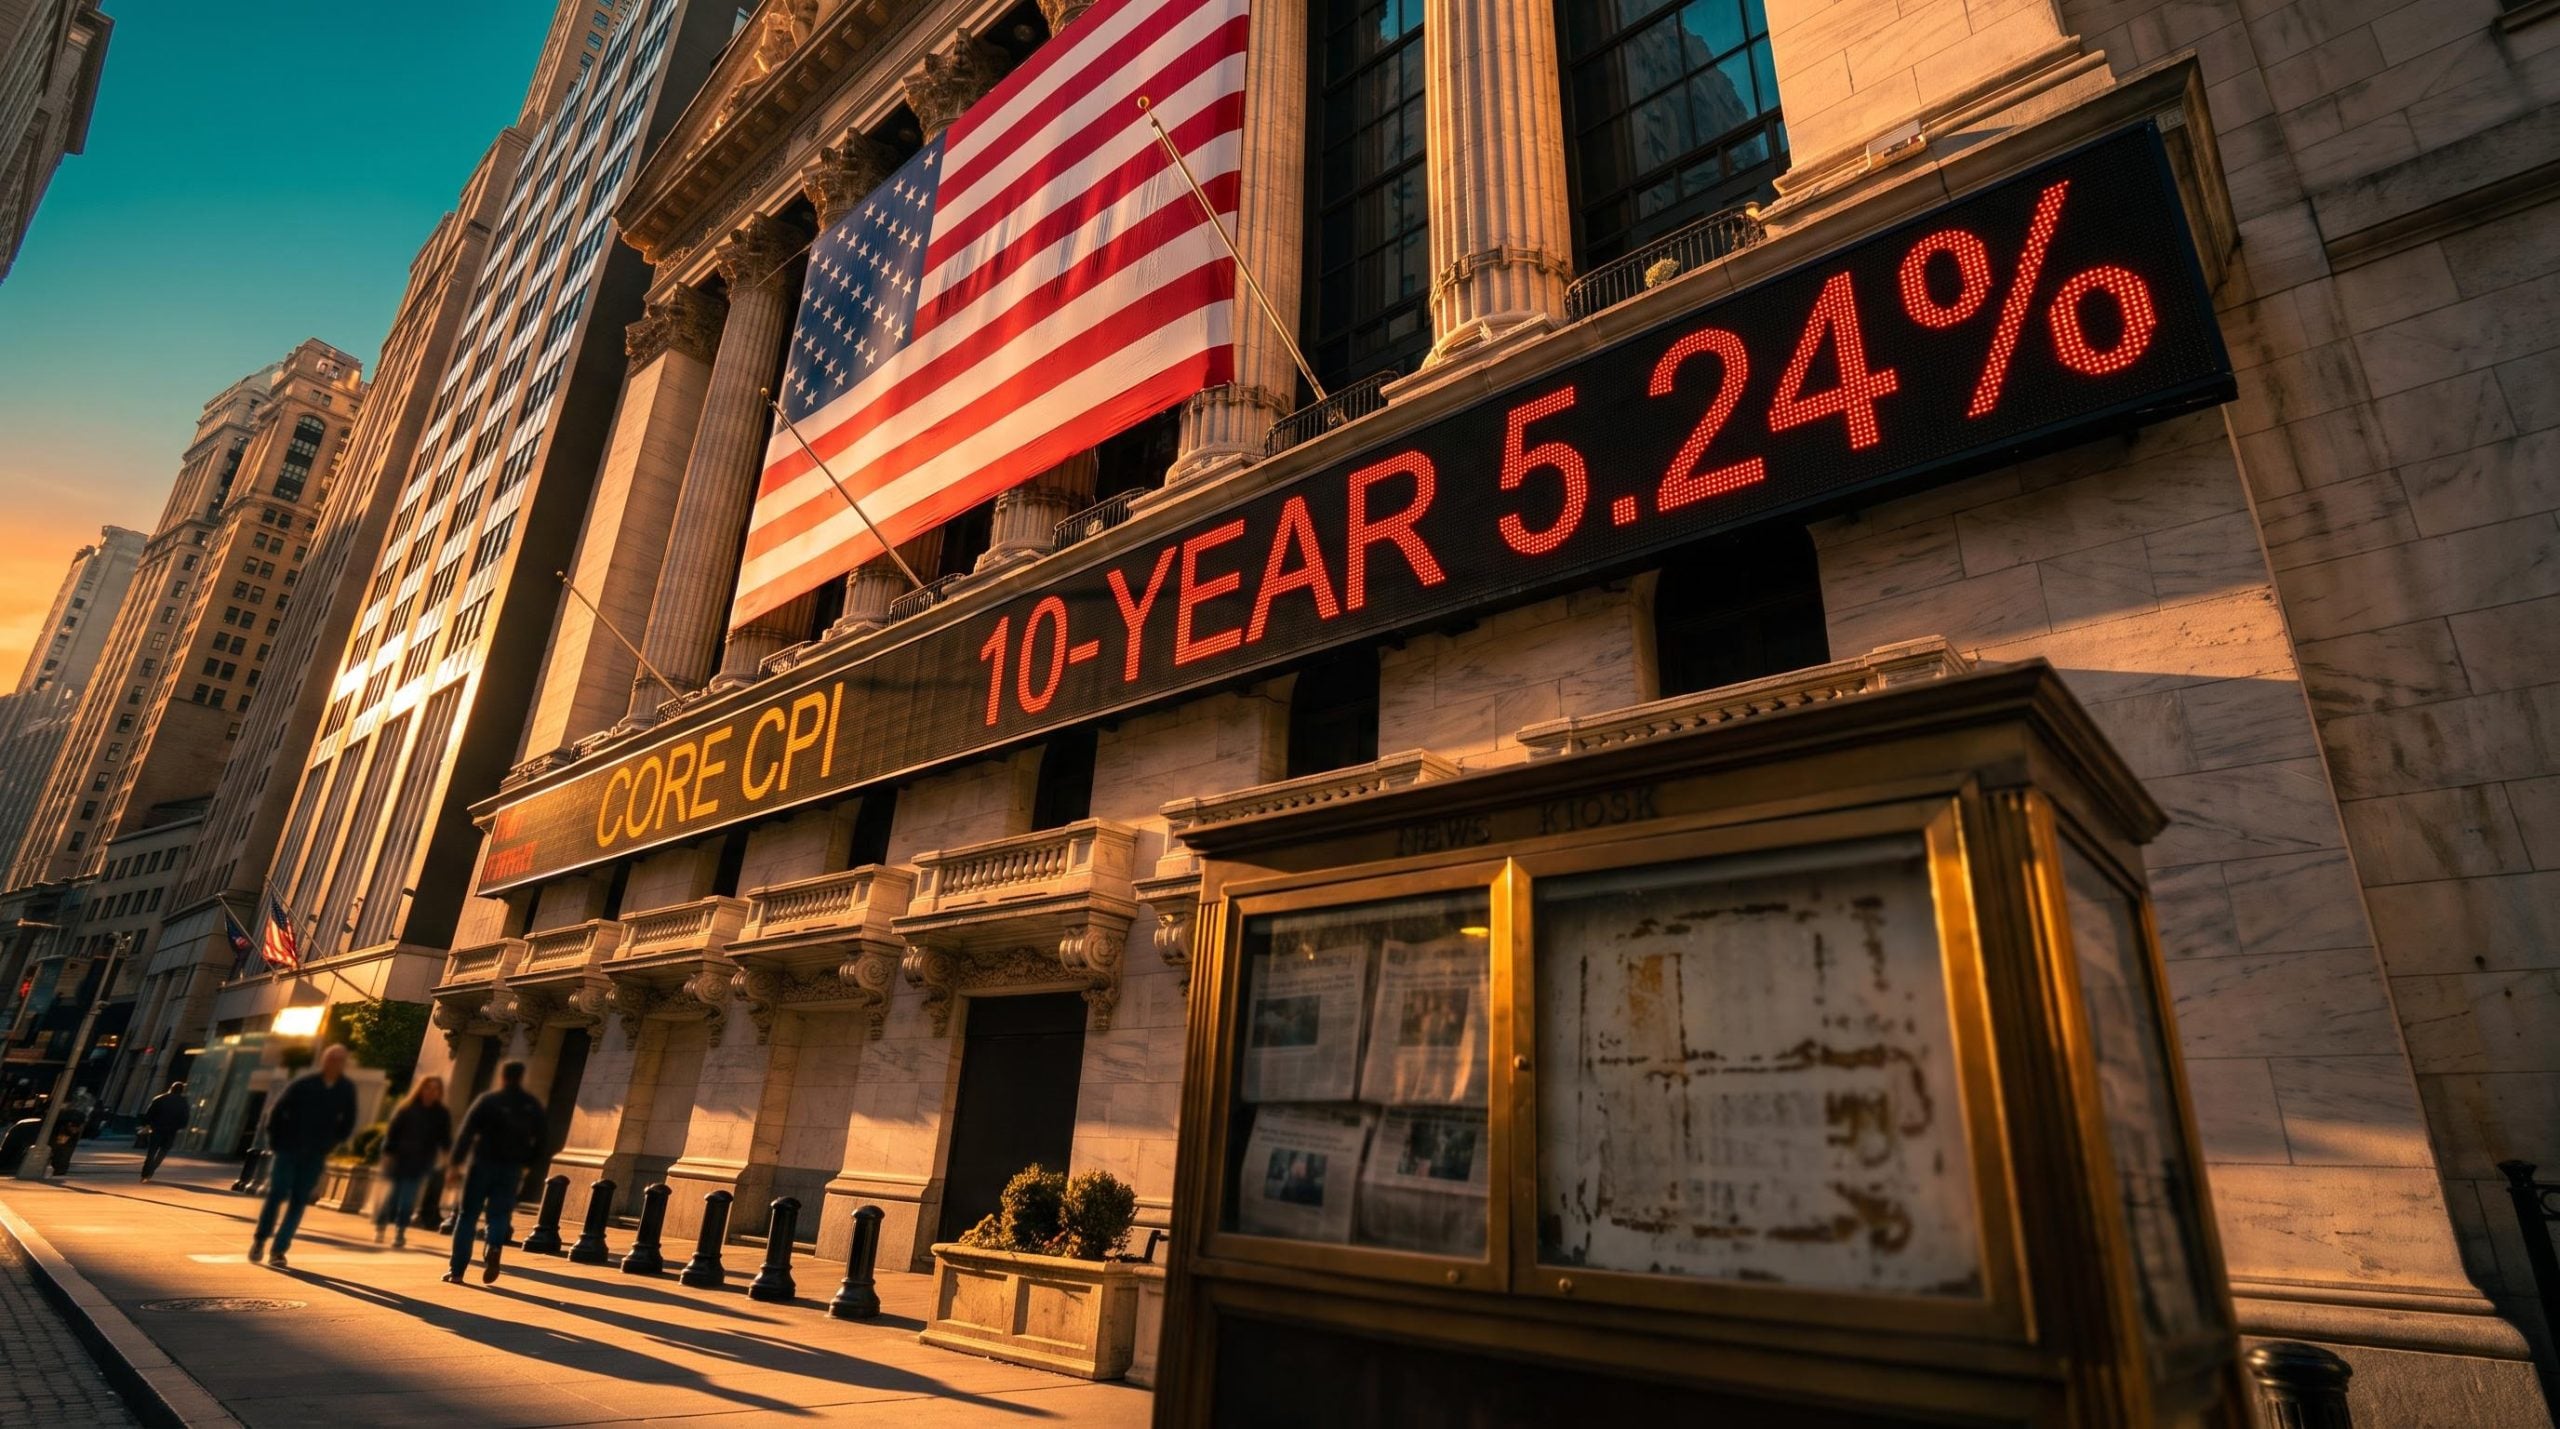
The S&P 500 closed Friday at 7,811.54, up 0.59%, and the Nasdaq Composite added 0.64% to 27,366.17. On the surface, US stocks look calm heading into the week ahead. Underneath, the 10-year Treasury yield sits near 5.24% and Brent crude is holding above $104 a barrel, a pairing that rarely sits comfortably with rising share prices.
The rally now runs into three tests in quick succession. JPMorgan, Goldman Sachs, Citigroup and Wells Fargo report on Tuesday. September consumer price index (CPI) data lands on Wednesday, 14 October. Both feed straight into the Federal Reserve’s 27-28 October meeting, its first decision since September’s hike, which was the central bank’s first increase since 2023.
The Dow Jones Industrial Average gained 0.83% to 51,654.95 in the same session. Gains across all three indices make the tape look healthy, but a rising index is not the same thing as a sturdy one.
Here is what the evidence says about which numbers carry the most weight this week, what a hot or cool inflation print would change, and where Wall Street’s strategists part ways.
Why does a choppy, tech-led rally face its biggest test this week?
Friday ended a bumpy week on a constructive note. Technology shares did the heavy lifting, recovering ground lost to high yields, expensive oil and a wobble in AI-related names.
| Index | Close (9 October 2026) | Point change | Percent change |
|---|---|---|---|
| S&P 500 | 7,811.54 | +46.18 | +0.59% |
| Nasdaq Composite | 27,366.17 | +172.83 | +0.64% |
| Dow Jones Industrial Average | 51,654.95 | +423.31 | +0.83% |
Equities reached their peak levels of the day once President Trump announced that Russia’s Vladimir Putin had consented to send diesel to American and international buyers. Oil dipped briefly, then shrugged off the headline. Brent settled above $104 and WTI near $92, both up about 0.4%.
That stubbornness matters. Expensive energy feeds inflation, and inflation feeds yields. The 10-year yield finished around 5.24% (with reports ranging up to 5.30%), not far from the 24-year high it touched recently.
Those two pressures capped how far Friday’s buying spread. Goldman’s read on market participation shows how thin the base has become.
Narrow leadership Goldman Sachs says market breadth, a measure of how many stocks are participating in a rally, is the narrowest since 2000, with a small group of tech companies carrying the index.
What this tells you is that the index level overstates how broadly healthy the market is. If you hold an S&P 500 tracker, your returns lean heavily on a handful of AI names, and those names are among the most sensitive to rising rates. Your portfolio may carry more concentrated risk than the headline close suggests.
Record tech concentration, with the sector weighting above its dot-com era peak, helps explain why a rate-driven wobble in a few AI leaders can drag the whole index.
When big ASX news breaks, our subscribers know first
How could Wednesday’s CPI reading move yields, Fed odds and stock valuations?
Forecasters expect September headline CPI to rise about 0.6% month on month and 3.7% year on year, according to a Reuters poll and previews from Barclays, Morgan Stanley and Westpac. That is far above the Fed’s 2% target. Core CPI, which strips out volatile food and energy prices, is expected at about 0.2% for the month and 2.4%-2.5% annually.
| Measure | Consensus | Cleveland Fed nowcast (7 October) | Source |
|---|---|---|---|
| Headline CPI, monthly | ~0.6% | 0.53% | Westpac, Barclays, Morgan Stanley |
| Headline CPI, annual | ~3.7% | 3.60% | Reuters poll, Barclays |
| Core CPI, monthly | ~0.2% | 0.20% | Barclays, Morgan Stanley |
| Core CPI, annual | 2.4%-2.5% | 2.39% | Barclays, Morgan Stanley, Reuters poll |
Producer price and retail sales data also arrive this week, though no firm consensus forecasts for either were found.
How a print flows through to stocks
The chain runs in four steps. A hotter-than-expected print raises the odds of another Fed hike. Higher hike odds push Treasury yields up. Higher yields lift the discount rate, which is the interest rate used to convert a company’s future profits into today’s value, and that hits high-multiple tech and AI stocks hardest because most of their expected earnings sit years away.
Hike expectations have already swung sharply. CME FedWatch put the chance of an October move at about 18%-19% on 8 October, down from roughly 70% earlier, while odds of at least one more hike by December sit near 85%. UBS describes the Fed as flexible and in no hurry, expects one more hike priced for December, and believes equities should withstand measured tightening.
The Fed rate hike outlook shows a committee still leaning toward another increase this year while traders price a pause in October, a gap that explains why a single inflation print can move yields so sharply.
Previews differ slightly on the exact consensus, so a 0.1 point miss could come down to rounding. Even so, a small surprise can carry weight when positioning is this finely balanced.
The figure to watch is core. Headline inflation is being pushed up by energy, which the Fed can partly look through. A hot core reading is the scenario that revives October hike bets and puts your rate-sensitive holdings under pressure; a benign core print could cushion an ugly headline.
Why yields and oil are elevated
- Oil-supply risk: Middle East conflict and US-Iran tensions have lifted crude.
- Sticky inflation: Energy costs spill into transport, goods and services.
- Fiscal concerns: Deficits and debt push up long-dated yields.
- Higher-for-longer policy: A hot CPI would delay easing and revive hike talk.
- Valuation pressure: Higher discount rates shrink the value of long-duration stocks.
Baird’s Ross Mayfield separates the two ends of the curve: short yields track expected Fed hikes, while long yields reflect deficits, debt and the term premium (the extra return investors demand for holding longer bonds). The oil shock looks largely cyclical and geopolitical. Deficits, debt and the capital intensity of AI are structural, and they will not fade with a ceasefire.
What can the big bank earnings reveal about the economy?
Inflation data shows what prices are doing. Bank results show how borrowers are coping with those prices, which is why this earnings run matters beyond financials.
Last quarter, big bank earnings showed strong loan growth and a capital markets boom, while consumer credit stress stayed concentrated in late-stage auto delinquencies rather than spreading broadly.
The numbers to expect
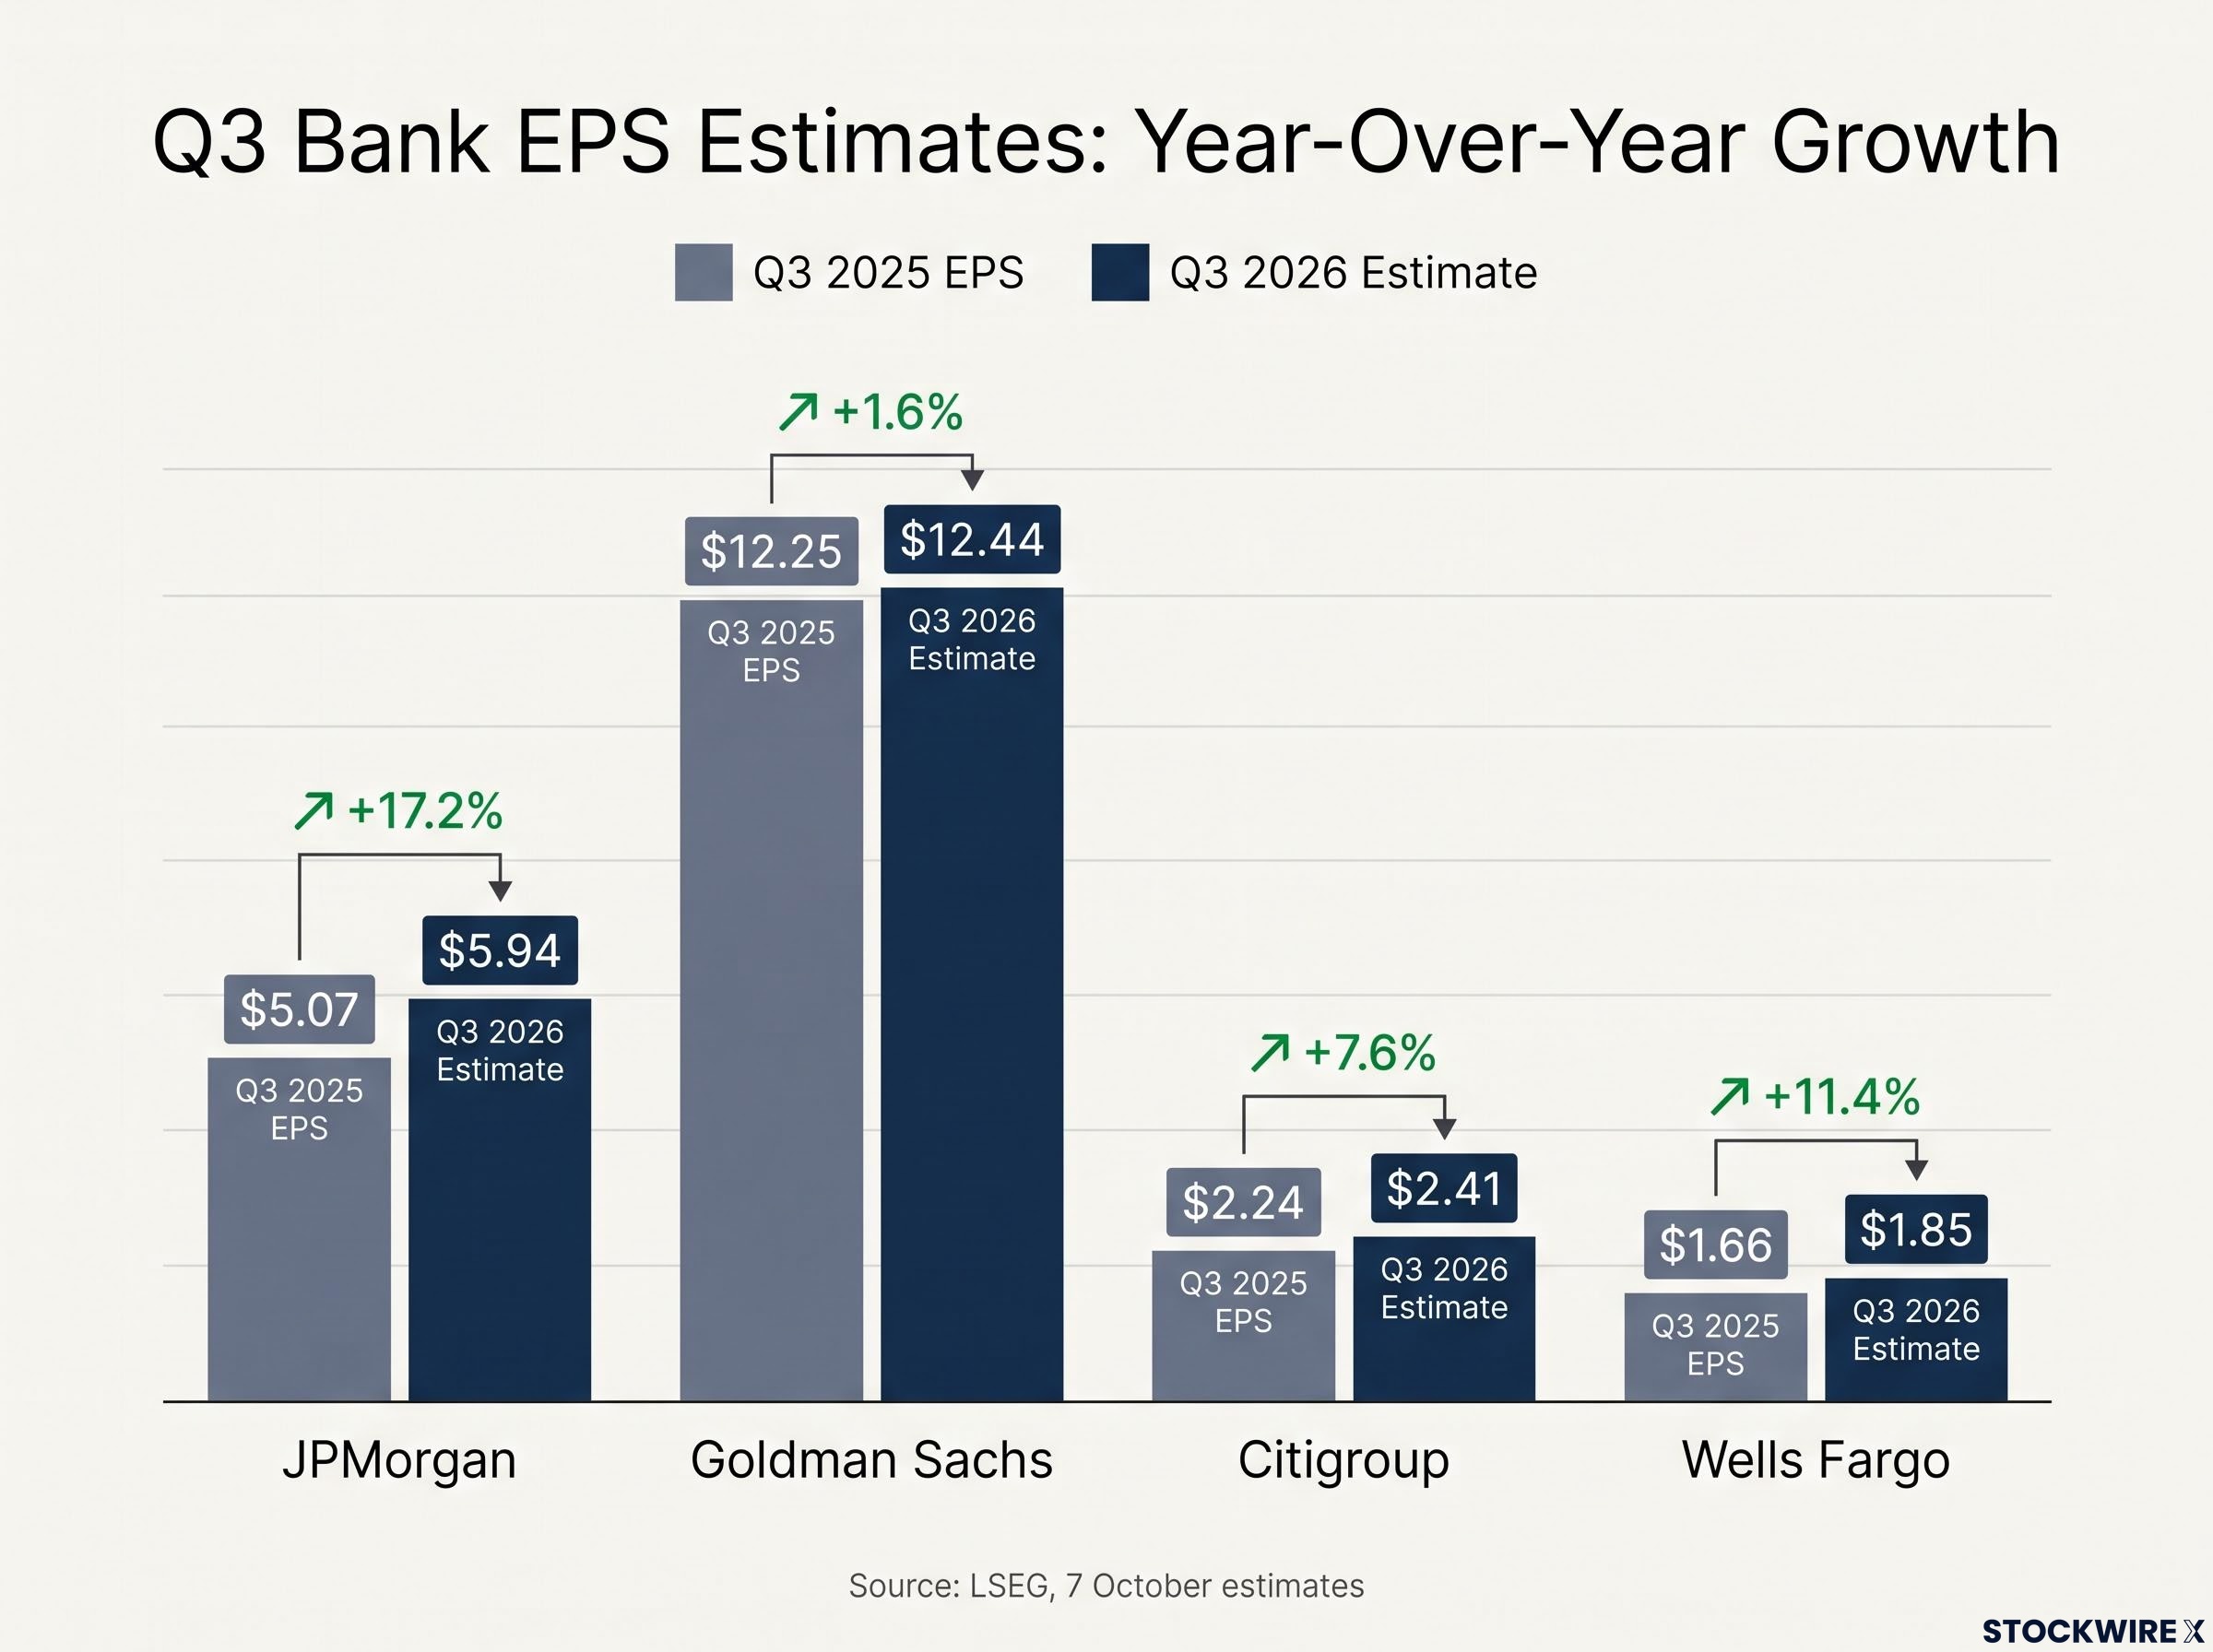
JPMorgan, Goldman, Citigroup and Wells Fargo report Tuesday, with Morgan Stanley and Bank of America following Wednesday. Johnson & Johnson, UnitedHealth and BlackRock also report this week.
| Bank | Q3 2026 EPS estimate (LSEG, 7 October) | Q3 2025 EPS | Expected change |
|---|---|---|---|
| JPMorgan | $5.94 | $5.07 | +17.2% |
| Goldman Sachs | $12.44 | $12.25 | +1.6% |
| Citigroup | $2.41 | $2.24 | +7.6% |
| Wells Fargo | $1.85 | $1.66 | +11.4% |
Visible Alpha’s 9 October figures look different: net income growth of 12.5% for JPMorgan, 30% for Citi and 5% for Wells Fargo. These are not errors. Earnings per share (EPS) and net income are separate measures, and share buybacks alone can pull them apart.
The broader backdrop is strong. FactSet now sees S&P 500 Q3 earnings growth of 29.5%, up from 26.7% at the end of June, while Goldman estimates about 27%.
What to read beyond the headline
Headline beats are expected. The signal sits in the detail:
- Credit quality and provisions: Stable delinquencies suggest healthy borrowers; rising charge-offs would show damage from higher rates and energy costs.
- Consumer loan growth: Steady demand supports the soft-landing case; weakness feeds the growth-scare argument.
- Net interest income and margins: Visible Alpha expects aggregate net interest income (NII) for the four largest banks to rise 9.6% to $72.8 billion, but Wells Fargo’s net interest margin is forecast at 2.41% with NII growth of only 5.5%.
- Trading and investment banking: Strength confirms healthy corporate activity; a sequential slowdown would suggest Q2 was unusually strong.
Evercore ISI has put financials first on its watchlist, noting that the Financial Select Sector SPDR Fund (XLF) has slid to its 200-day moving average, raising the chance guidance moves stocks sharply either way. For you, provisions and outlook commentary matter more than the EPS beat, because they reveal whether consumers and businesses are absorbing higher rates and fuel costs.
Will the bull market hold? Where JPMorgan, Goldman, Evercore ISI and RBC split
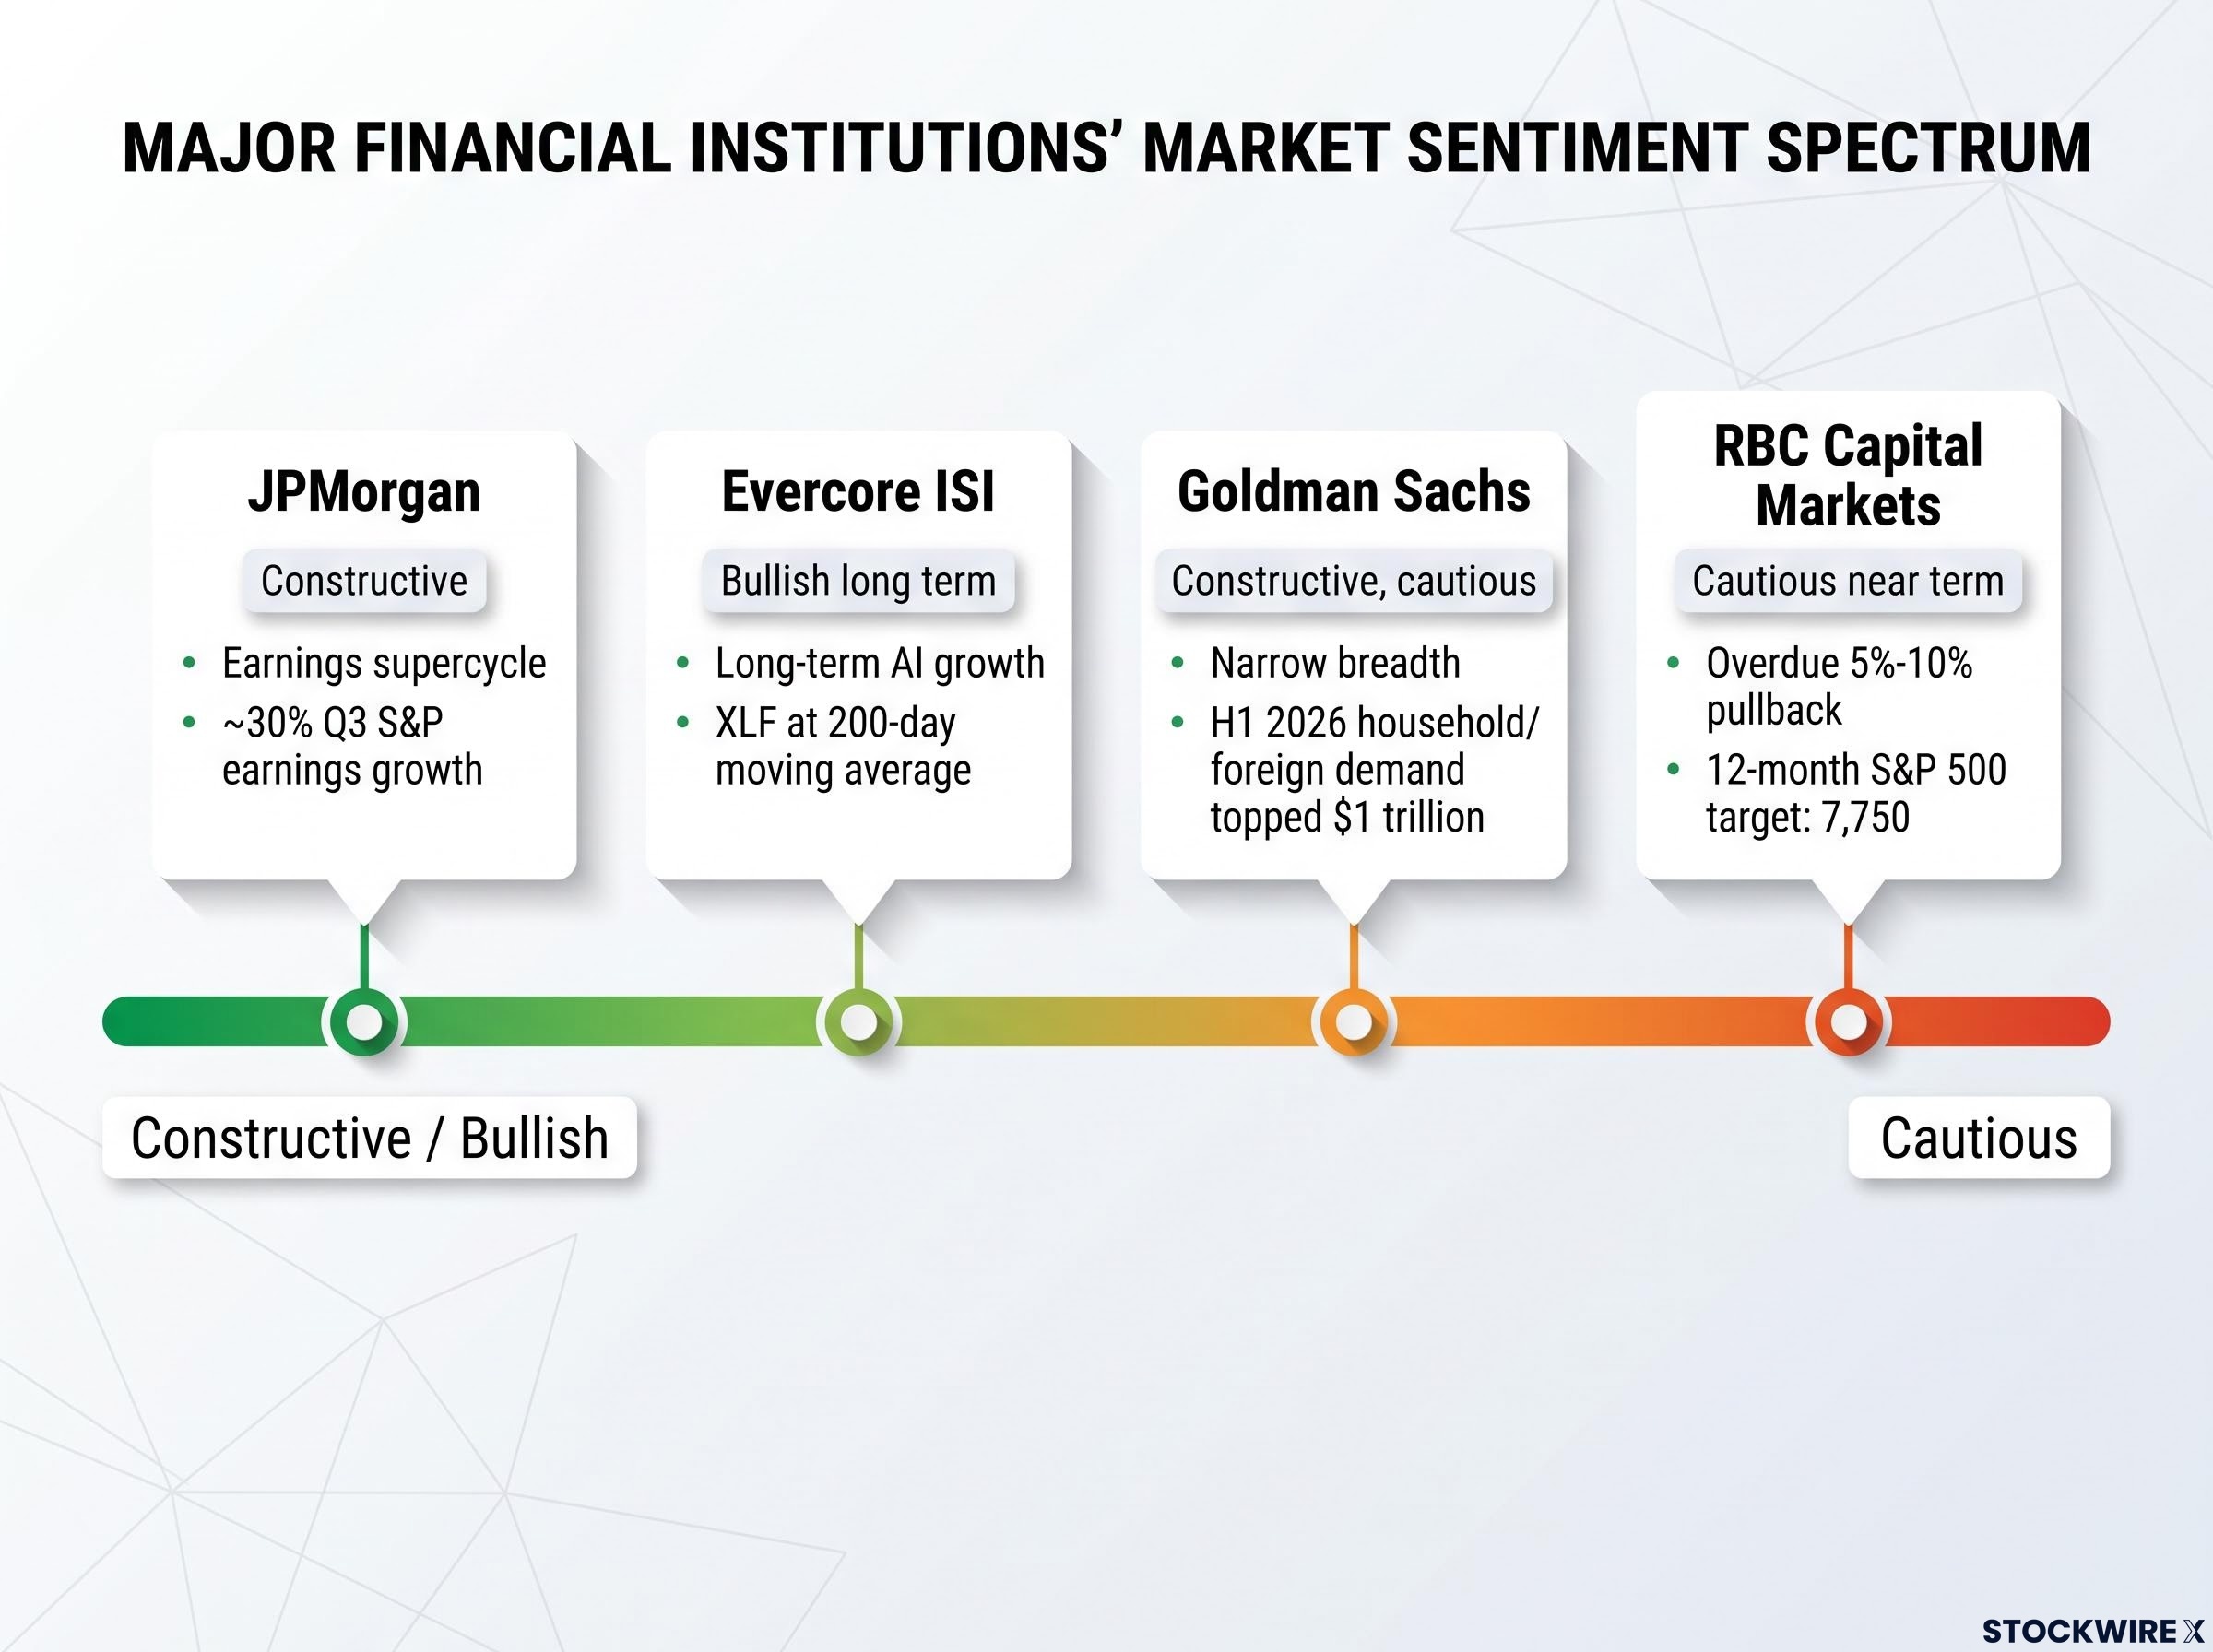
Strategists line up along a spectrum, and the striking thing is how much common ground they share on profits.
JPMorgan sits at the constructive end. Jacob Manoukian points to an earnings supercycle, with S&P earnings growth of roughly 30% this quarter, and expects earnings to support the market despite volatility. Evercore ISI expects turbulence but calls the long-term bull market intact and remains very bullish on AI.
Goldman is constructive with caveats. Alongside its breadth warning, it argues that rising corporate equity supply pressures valuations but should not end the bull market, noting household and foreign demand for equities topped $1 trillion in H1 2026.
RBC Capital Markets is the most cautious.
RBC Capital Markets A routine 5%-10% S&P 500 pullback is overdue, and a 14%-20% growth-scare decline has become likelier, though it is not the base case.
RBC’s 12-month S&P 500 target of 7,750 sits below Friday’s 7,811.54 close.
| Institution | Stance | Key concern | Key support |
|---|---|---|---|
| JPMorgan | Constructive | Earnings disappointments | Earnings supercycle, AI |
| Evercore ISI | Bullish long term | Near-term volatility, financials | Long-term AI growth |
| Goldman Sachs | Constructive, cautious | Narrow breadth, equity supply | Earnings growth, investor demand |
| RBC Capital Markets | Cautious near term | Overdue pullback, growth scare | Earnings-driven gains |
The dividing line is clear. Bulls lean on earnings, AI investment and nominal growth; the cautious camp worries about valuations, narrow breadth, financing costs and AI expectations already priced in. The combination that would hurt most:
- A hot core CPI print
- A 10-year yield moving materially above 5%
- Weak bank guidance
- Renewed weakness in AI leaders
The read you should take is that a 5%-10% pullback would be routine, not a crisis. Sizing positions and knowing your tolerance for volatility will serve you better than trying to call the top.
For readers weighing the breadth risk, our detailed coverage of Goldman’s momentum warning shows how 85% of year-to-date gains came from technology stocks.
What this week’s data changes, and what it does not
The bull case needs two things this week: core CPI staying moderate despite energy prices, and bank results confirming that borrowers are holding up. The bear case needs yields and hike odds to climb together.
Neither outcome settles the Fed question. The 27-28 October meeting is the real decision point, so this week’s prints shift the odds rather than decide them.
Three markers will tell you most:
- Core CPI against the 0.2% monthly consensus
- The 10-year yield relative to 5.24%
- Bank provisions and forward guidance, not headline EPS
This article is for informational purposes only and should not be considered financial advice. Investors should conduct their own research and consult with financial professionals before making investment decisions. Past performance does not guarantee future results. Financial projections are subject to market conditions and various risk factors.